

This policy brief draws its foundation from the paper: Škrinjarić, T. (2026). Developing a house price-at-risk framework for the UK, Staff Working Paper, No. 1193, Bank of England. Any views expressed in the paper are those of the author and not necessarily those of the Bank of England or its committees.
Abstract
The framework shifts attention from the average house-price outlook to the full distribution of possible outcomes. Transaction growth, mortgage-rate changes, the credit-to-GDP gap and financial stress emerge as key predictors of national downside risk, while exuberance captures persistent boom dynamics and contributes to the explanation of subsequent corrections. Regional models reveal materially different sensitivities to mortgage rates and housing supply.
I develop a House Price-at-Risk (HPaR) framework for the UK. Rather than forecasting only mean or median house-price growth, the model estimates different points of the conditional distribution, with particular attention to the lower tail. This makes it possible to quantify adverse but plausible outcomes, the probability of negative nominal house-price growth, and the size of losses expected in the tail.
There is a strong motivation from the financial stability point of view. Housing accounts for a substantial share of household wealth and mortgage lending is central to the balance sheets and cash flows of UK lenders and households. Large house-price corrections can weaken collateral values, household balance sheets and credit quality. A framework that identifies growing downside risks before an observed fall therefore has direct relevance for macroprudential monitoring and stress testing.
A second motivation is the heterogeneity of the UK housing market. National aggregates can conceal large differences in supply constraints, local demand, affordability and the transmission of financing conditions. The paper therefore combines a UK-wide model with separate analysis for nine English regions, Wales, Scotland, and Northern Ireland.
Data. The dependent variable is annualised future nominal house-price growth. Nationwide house-price indices provide a long UK series beginning in the 1950s and regional series beginning in the 1970s. The empirical exercise considers roughly 50 candidate indicators covering financial conditions, demand, supply, non-fundamental behaviour and confidence or uncertainty. Variables include mortgage rates, the credit-to-GDP gap, financial stress, stock-market performance, GDP and income growth, housing investment, transaction volumes, consumer confidence, economic-policy uncertainty, price-to-rent dynamics and an exuberance1 measure.
Supply indicator. A distinctive contribution of the paper is the construction of a time-varying housing-supply misalignment indicator. A system of supply and demand equations is estimated using seemingly unrelated regressions. A Hodrick-Prescott-filter measure is used as an alternative check.
Main House Price-at-Risk model. Quantile regressions are estimated at different points of the future house-price-growth distribution and over horizons from one to sixteen quarters. Candidate models are screened using tail calibration, information criteria, pseudo-R-squared, probabilistic forecast accuracy, coefficient significance and economic interpretability. Estimated quantiles are then used to fit a skewed-t distribution for each date. This distribution produces four monitoring measures: the lower-tail forecast, distance to tail, expected shortfall and the probability of negative growth. The reduced-form estimates are interpreted as predictive relationships rather than causal effects.
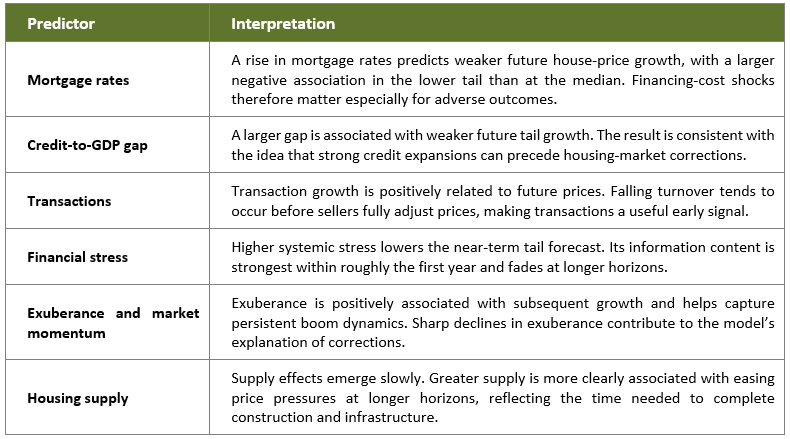
The national model identifies transaction growth, changes in mortgage rates, the credit-to-GDP gap and financial stress as the most important predictors of the lower tail of future nominal house-price growth (see Table 1). The estimated effects often differ between the fifth percentile and the median, illustrating why a tail-focused model adds information beyond a conventional linear forecast.
Table 1. Main findings for the UK-based model
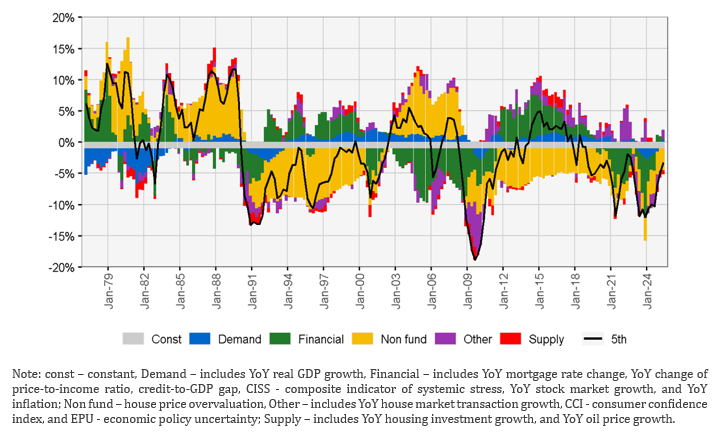
The relative importance of predictors changes with the forecast horizon. Financial stress, transactions, stock-market growth and policy uncertainty are primarily short-term indicators. Consumer confidence, credit conditions, inflation, price-to-rent growth and GDP become more informative at medium horizons. Supply, oil-price growth and the credit-to-GDP gap matter further out. This horizon dependence is useful for separating immediate warning signals from slower-moving vulnerabilities. Historical decompositions (Figure 1) show that different downturns had different drivers. The early-1980s decline was linked to recession, oil prices and subsequently mortgage rates. The early-1990s correction also involved lower exuberance, weaker credit and fewer transactions. During the global financial crisis, transaction volumes, financial stress and credit contraction were central. The latest decline was preceded by weaker transactions, rising mortgage rates and falling exuberance.
Figure 1. Decomposition of the tail risk of house price growth one year ahead, UK level
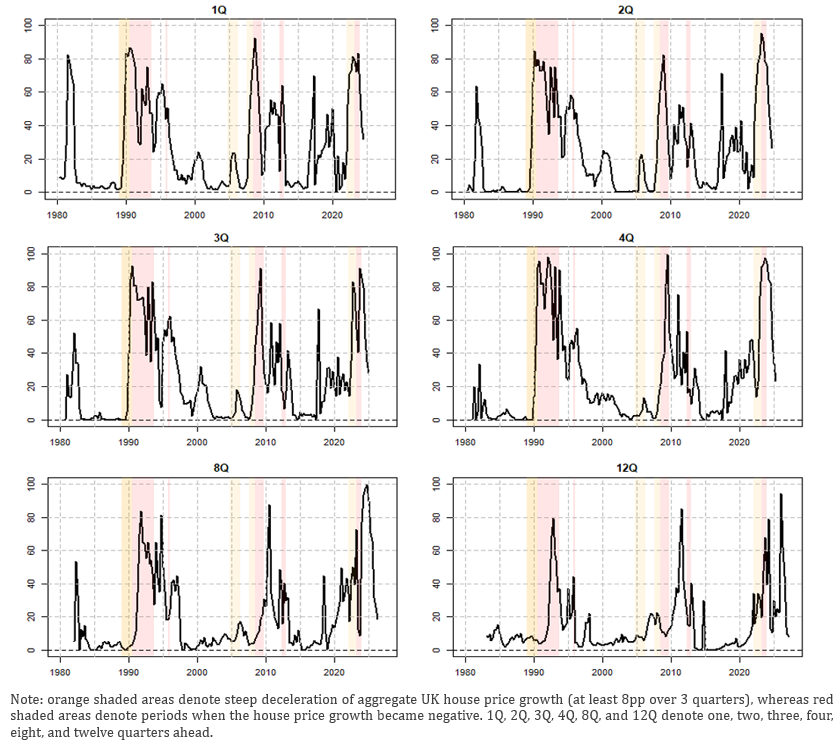
Another useful metric I propose from this framework is the probability of negative house price growth h quarters ahead. In Figure 2, I plot this probability for various time horizons and contrast it with periods when house prices underwent a substantial decline (orange shaded areas) and entered negative territory (red shaded areas).
Figure 2. Forward-looking national vulnerability measures: probability of negative nominal house-price growth
The regional analysis confirms that national estimates cannot simply be imposed on every local market. Panel models provide a common framework but constrain coefficients to be equal across regions. Separate regional models reveal substantial differences in both the magnitude and, for some variables, the sign of estimated relationships.
Demand and credit. Positive demand effects are strongest in London, the South West, South East and East. The credit-to-GDP gap is most negatively associated with future tail growth in London and the southern and eastern regions that also experienced stronger exuberance, suggesting that the same national credit conditions can imply different risks depending on the regional cycle.
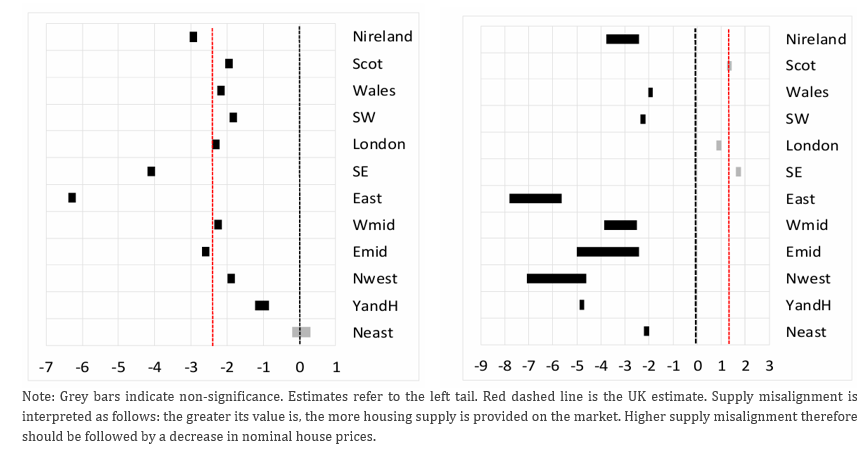
Mortgage-rate sensitivity. Mortgage-rate coefficients are more negative in supply-constrained regions (Figure 3 left). In markets where construction cannot adjust rapidly, higher borrowing costs reduce demand while supply remains inflexible, producing sharper price responses. Southern regions also react more quickly, especially within the first two years after a rate change.
Housing supply. Greater supply is followed by lower price pressure in most regions (Figure 3, right). London, the South East and Scotland are exceptions in some specifications. For large built-up areas, high land and remediation costs, planning constraints and infrastructure improvements may make new development coincide with higher local prices rather than immediate relief.
Figure 3. Range of lower-tail estimates for mortgage-rate changes (left) and supply misalignment (right) across regions. Grey bars indicate statistical insignificance; the dashed red line is the UK estimate
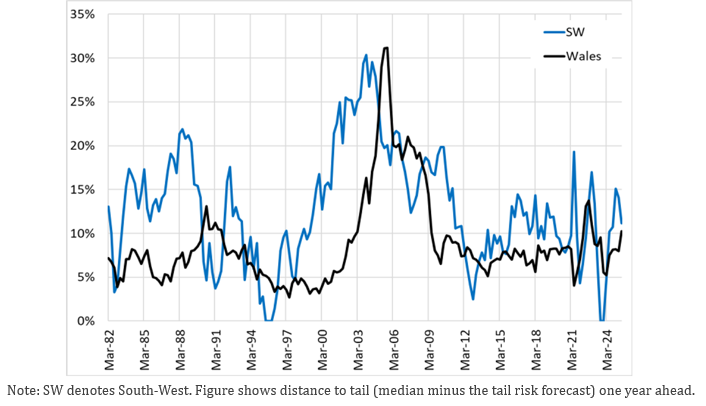
Regional risk indicators. Region-specific predictive distributions successfully identify episodes of negative growth despite shorter samples. The probability of negative growth and distance-to-tail indicators are complementary: the former measures the likelihood of crossing below zero, while the latter measures the separation between the central forecast and an adverse tail outcome. Vulnerabilities are built at different times and to different degrees across regions, supporting separate monitoring (Figure 4).
Figure 4. One-year-ahead distance to tail for the South West and Wales, illustrating different timing and magnitude of regional vulnerability build-ups
The paper provides a coherent distribution-based framework for monitoring UK housing-market vulnerability. Its main value is that it converts a broad set of macro-financial and housing indicators into forward-looking measures that are directly interpretable from a risk perspective. The framework also asks how severe a plausible downside outcome could be, how far that outcome lies below the projected median, and how likely negative growth is.
For macroprudential surveillance, transaction volumes and financial stress provide timely near-term signals, while mortgage rates and the credit-to-GDP gap help identify more persistent downside risks. Regional models add information that is obscured by UK aggregates, especially about the interaction between mortgage-rate shocks and constrained housing supply. Combining national and regional results is therefore preferable for risk monitoring, stress-test design and structured “what-if” analysis.
Used together, the national and regional models can help macroeconomic policymakers identify where housing vulnerabilities are building, distinguish immediate warning signals from slower-moving risks, and assess whether common macroeconomic scenarios imply materially different housing outcomes across the UK.
Škrinjarić, T. (2026), “Developing a house price-at-risk framework for the UK”, Bank of England Staff Working Paper No. 1,193, July 2026.
Stiglitz, J. E. (1990), “Symposium on Bubbles”, Journal of Economic Perspectives, 4(2), pp. 13-18.
Defined as significant increase in real estate prices beyond their intrinsic value, often driven by investor expectations that prices will continue to rise, even when fundamental factors cannot justify such valuations (Stiglitz, 1990). This overvaluation refers to house prices rising above levels that can be explained by economic fundamentals such as income, interest rates, credit conditions and housing supply. It therefore captures the part of house price growth that appears disconnected from these factors and is often associated with speculative expectations.