

The views expressed herein are those of the author and do not necessarily reflect those of the Bank of Italy or the Eurosystem. This note was prepared for the 53rd OeNB-SUERF Conference 2026, held in Vienna on 18–19 June, and greatly benefited from comments received during the discussion.
Abstract
This note assesses whether, by the first quarter of 2026, the recovery of real wages in the euro area after the 2022 energy shock could be considered complete. Real wages deflated by consumer prices had returned to their 2019 levels by early 2025. This is an informative benchmark, but only a partial one: absent the sequence of shocks that hit the euro area, real wages would most likely have continued to grow in line with productivity. A more complete assessment therefore requires comparing observed real wages not only with their pre-pandemic level, but also with a counterfactual wage path. We construct a pre-shock benchmark consistent with the productivity trend observed over 2013–2019. The comparison suggests that the terms-of-trade shock triggered by the 2022 energy price surge has been largely absorbed. However, real wages remain below the benchmark, mainly because productivity is still weaker than implied by its already modest pre-shock trend. The aggregate picture also masks substantial cross-country heterogeneity: some of the largest economies still record negative deviations from the benchmark, while several smaller economies have experienced much more favourable wage dynamics.
In the first part of 2026, renewed international tensions started to push energy prices and inflation upwards, with a potential deterioration in the purchasing power of wages. This makes it important to assess whether the effects of the previous energy crisis — the one triggered in 2022 — had been fully absorbed by the time these new pressures emerged.
After the 2022 energy shock and the productivity slowdown associated with the increase in intermediate input prices relative to labour, real wages in the euro area returned to their 2019 levels in early 2025. This comparison is often used to assess whether workers’ purchasing power has recovered. Yet it is incomplete. In the absence of the energy shock, real wages would probably have followed a rising path, broadly linked to productivity growth. Returning to the pre-shock level does not therefore necessarily imply a full recovery: it may still represent a loss relative to the path wages could have followed without the shock.
This distinction matters because households and workers base consumption and saving decisions not only on the current level of real income, but also on its expected trajectory.
A simple macroeconomic framework helps clarify the issue. In standard models, firms set product prices as a markup over marginal costs. Under stable markups, real wages measured in terms of the price of domestic output tend to move in line with labour productivity. These are referred to as “product real wages”: nominal wages deflated by the value added deflator, rather than by consumer prices (here referred to as “real consumption wages”). However, workers care about what their wages can buy. Their purchasing power is therefore measured not against the price of domestic value added, but against consumer prices, which also include imported goods and energy.
This distinction is crucial in the case of an energy shock. If consumer prices rise faster than the price of domestically produced output, workers’ purchasing power falls even if wages keep pace with domestic prices. In other words, a deterioration in relative prices — or a negative terms-of-trade shock — directly reduces real consumption wages.
Real consumption wages can therefore be decomposed into three multiplicative components.
The decomposition is useful for two reasons. First, it isolates the channels through which shocks affect real consumption wages: relative prices, productivity and the wage share. Second, it provides a natural basis for constructing a counterfactual real wage path. The benchmark used here assumes that productivity evolves along its 2013–2019 linear trend, while the relative price term and the product real wage relative to productivity remain at their 2013–2019 averages.2
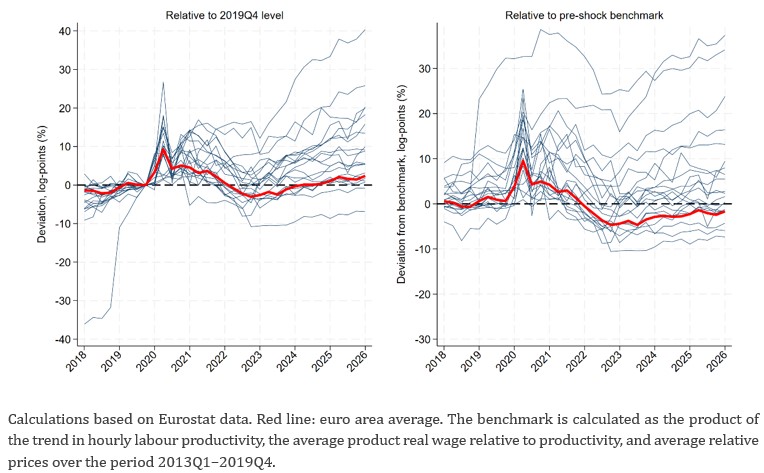
Figure 1 compares real consumption wages across euro-area countries using two alternative metrics. The left-hand panel reports the log deviation of real hourly wages from their 2019Q4 level. Thin blue lines refer to individual countries, while the red line shows the euro-area aggregate. According to this metric, the loss of purchasing power recorded in 2022–2023 had been largely absorbed by early 2025: real consumption wages in the euro area were again close to their 2019Q4 level.
The right-hand panel instead reports the deviation from the pre-shock benchmark. This second metric gives a less favourable assessment. In the euro area aggregate, real consumption wages remained below the benchmark throughout the post-energy-shock period. After reaching a trough in 2022–2023, the gap narrowed, but in 2026Q1 it was still negative, at around 2 percentage points.
The figure also points to pronounced cross-country heterogeneity. In some countries, real wages are now well above their 2019Q4 levels; in others, they remain below. Heterogeneity is also visible relative to the benchmark: in 2026Q1, some countries recorded large positive deviations, while others remained significantly below the counterfactual path. This dispersion suggests that the shock interacted with country-specific differences in productivity dynamics, the transmission of relative-price shocks, and the distribution of value added.
Figure 1. Real wages in the euro area: deviation from the pre-pandemic level and from a benchmark calculated over 2013Q1–2019Q4
Taking logs makes the decomposition additive and allows the gap between observed real consumption wages and the benchmark to be attributed exactly to the deviations of each component from its pre-shock norm.
Figure 2 reports this decomposition for the euro area aggregate. The blue line is the overall gap between real consumption wages and the benchmark. The green line measures the deviation of observed hourly productivity from the path implied by its 2013–2019 trend. The red dashed line captures the gap in the product real wage relative to productivity. When this component is negative, real product wages are lower than implied by the average wage-productivity relationship observed before the shock. The grey dashed line measures the relative-price gap, namely the deviation of relative prices from their pre-shock average.
Figure 2. Euro area: Decomposition of real wage dynamics, expressed as the deviation from the benchmark and its components
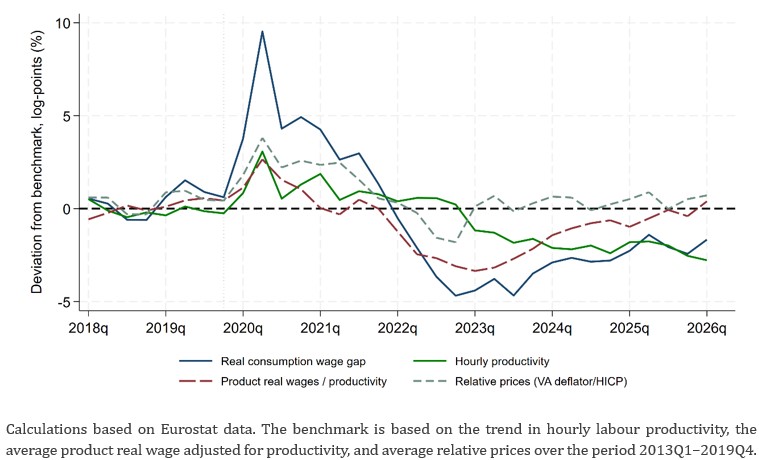
The adjustment after the shock occurred in several phases. In 2022 and early 2023, real consumption wages moved sharply below the benchmark. This reflected the surge in energy prices, which pushed up consumer inflation, the fall in productivity below trend, and a compression of product real wages relative to productivity. Between 2024 and 2025, the wage-productivity component progressively normalised, as nominal wages recovered while domestic price pressures remained relatively contained. By the end of 2025, the product real wage relative to productivity was broadly back in line with its 2013–2019 average. Relative prices were slightly above their pre-shock average in 2026Q1, pointing to a substantial absorption of the 2022 energy shock. The remaining negative gap mainly reflected weak productivity.
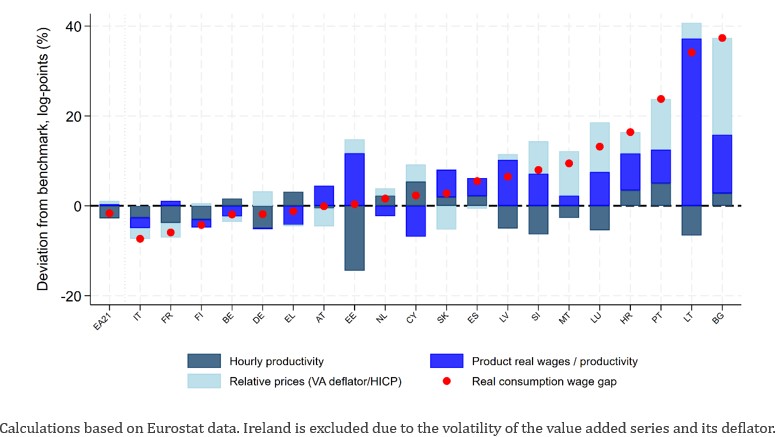
Figure 3 decomposes the benchmark gap across euro-area countries in 2026Q1. In nine countries, including Germany, France and Italy, labour productivity remained below its pre-pandemic trend, weighing on real wages relative to the benchmark. In Italy, France and Austria, relative prices also continued to contribute negatively, while in Germany the terms-of-trade shock had been largely absorbed.
In countries where real wages rose the most, the main contribution came from the product real wage relative to productivity, i.e. the wage share in value added. In Portugal, the result can partly be interpreted as a catch-up after exceptionally weak wage growth over 2013–2019. In Croatia and Bulgaria, it mainly reflects convergence in living standards towards the euro-area average.
Figure 3. Decomposition of real wage dynamics, expressed as the deviation from the benchmark and its components in 2026Q1
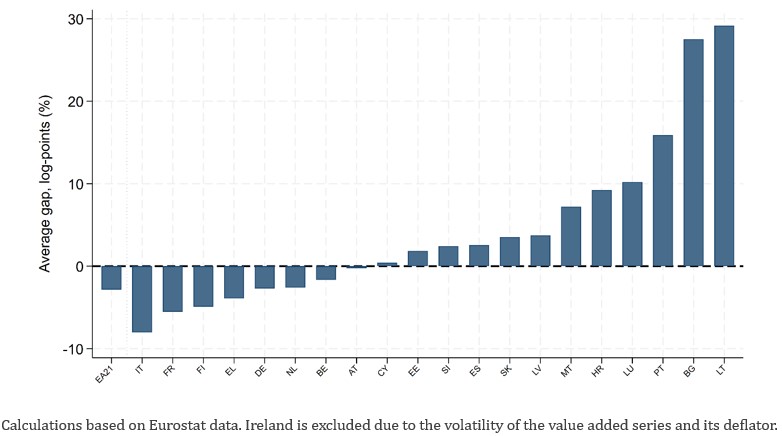
Finally, Figure 4 reports the average gap between real consumption wages and the benchmark over the period from 2022Q1 to 2026Q1. This measure is obtained by cumulating quarterly deviations and dividing by the number of quarters. In Italy, real wages were on average around 8 percentage points below the benchmark in each quarter between 2022Q1 and 2026Q1. The corresponding gap was around 5 percent in France and around 2.5 percent in Germany and the Netherlands. By contrast, sizeable positive deviations were recorded in several smaller economies.
Figure 4. Average deviation of real wages from the benchmark, 2022Q1–2026Q1
In the Italian case, for example, the generous reductions in social security contributions introduced over 2015–2019 helped contain the dynamics of labour costs paid by firms relative to wages. The main results are nevertheless confirmed when considering the evolution of real labour costs rather than real wages.
The period 2013–2019 is chosen because it corresponds to a phase of moderate but continuous expansion in the euro area before the pandemic and the energy shock. The decomposition results are robust to alternative pre-shock windows, for instance starting the benchmark period in 2011 or ending it in 2018.