

This policy brief is based on Saldías (2026), “Common Funding, Divergent Models: Network Evidence on Euro Area Bank Liability Structures After TLTRO”, Banco de Portugal Economic Studies, Vol. XII, No. 3, July 2026, pp. 51–78. The opinions expressed are those of the author and do not necessarily coincide with those of Banco de Portugal or the Eurosystem. Acknowledgement: I am grateful to Nuno Alves, João Amador, António Antunes, Armin Leistenschneider and Nuno Silva for comments and discussions.
Abstract
The phase-out of the ECB’s targeted longer-term refinancing operations (TLTROs) required euro area banks to replace a large stock of cheap central bank funding while interest rates were rising and depositor behaviour was changing. Using harmonised supervisory funding-plan data for 83 significant institutions over 2020–2025, this article links banks to 21 liability categories in a two-mode network and identifies three recurring funding profiles: retail-deposit, diversified and market-funded banks. The sharpest shift coincided with the TLTRO unwind: the market-funded group fell from 38 banks in 2023 to 13 in 2025, while the retail-deposit group doubled. At the same time, banks became more selective individually but increasingly rely on the same instruments. This combination may raise correlated refinancing and crowding risks under stress and it strengthens the case for monitoring funding structures system-wide, alongside bank-by-bank liquidity metrics.
Between 2020 and 2025, euro area banks replaced the majority of their central bank funding under markedly tighter conditions. During the pandemic, the ECB’s TLTROs provided around EUR 2.2 trillion of low-cost funding to banks. Together with very high excess liquidity and strong deposit inflows, this reduced the need to issue debt or borrow in wholesale markets. The picture changed when inflation rose, monetary policy tightened and the conditions on TLTRO III were recalibrated in late 2022. Large early repayments followed, and banks had to replace central bank funding in a materially more expensive environment. Supervisors and international institutions have flagged this transition as a potential source of vulnerability. The IMF’s 2025 Financial System Stability Assessment for the euro area singles out liquidity demands, funding market disruptions and growing interlinkages between banks and non-bank financial intermediaries as channels through which risks may materialise (IMF, 2025).
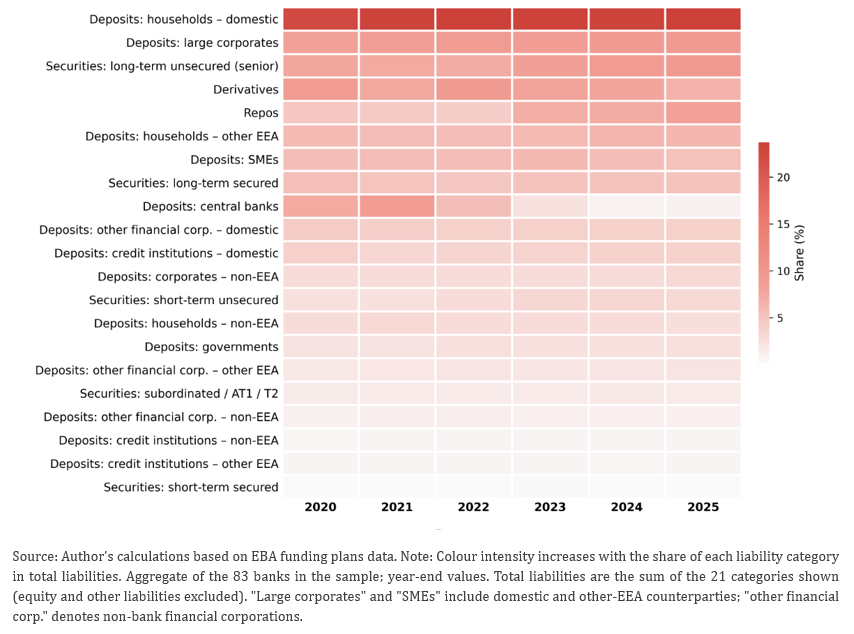
The replacement of central bank funding was spread across instruments and maturities, with deposits remaining the anchor. In the sample, central bank funding rose to 9.1% of total liabilities in 2021 and fell to only 1.0% by 2025 (Figure 1). Repo funding almost doubled from 4.3% of liabilities in 2022 to 8.4% in 2025, while long-term unsecured securities increased from 7.4% to 9.8%, partly reflecting the need to meet resolution-related (MREL) requirements. Short-term unsecured funding, such as commercial paper and certificates of deposit, also rose from 2.3% to 3.2%, so that the substitution extended across the whole maturity spectrum. At the same time, deposits remained the system’s main funding anchor, as domestic household deposits increased from 22.9% to 24.5% of liabilities, and large corporate deposits gained share, from 8.4% to 9.8%.
Figure 1. Liability composition of the euro area banking system, 2020–2025
(% of total liabilities)
Aggregate shares do not show whether banks adjusted in the same way. Two banking systems can have the same aggregate funding mix while including very different groups of institutions. Existing analyses by the EBA (2025) and the ECB document the aggregate recomposition of bank funding in detail. A network perspective complements this work by addressing additional questions: which banks rely on similar combinations of instruments, how these groupings evolve over time, and whether common liability exposures may give rise to correlated refinancing risk. This is where a network approach adds a further dimension to the analysis.
The analysis draws on harmonised supervisory funding plans. It uses the EBA funding-plan templates for 83 euro area significant institutions, representing more than 94% of the assets of significant institutions, over 2020–2025.1 For each bank, the data capture exposure to 21 liability categories, distinguishing deposits by counterparty (households, SMEs, large corporates, financial institutions, governments and central banks) and geography (domestic, other EEA and rest of the world), and debt securities by maturity, seniority and collateralisation. Repos and derivatives are treated as standalone categories.
A two-mode network links each bank to the instruments it uses. One side of the network contains banks and the other contains funding instruments. A link is drawn when a bank uses a particular source of funding, and its weight reflects the amount involved. The resulting map allows us to ask three questions that are difficult to answer from aggregate statistics alone, namely which funding sources tend to be used together; which banks have similar liability structures; and whether those similarities are becoming stronger or weaker over time.2
Community detection groups banks with similar liability structures into three recurring profiles. The exercise consistently identifies retail deposit banks, diversified funding banks and market-funded banks. To compare years, community labels are harmonised against the 2025 profiles, so that the membership of each bank can be tracked over time. These are not supervisory classifications, nor do they imply that one model is intrinsically safer than another. They are empirical groupings that describe how banks in the sample actually combine their funding sources.
Retail deposit banks form the largest and most concentrated group. In 2025 it comprises 39 banks, which rely heavily on domestic household deposits. These account for about 40% of their liabilities on a weighted basis. They are predominantly smaller institutions (28 of the 39 have total assets below EUR 100 billion) and are relatively specialised in their funding structure, which places them at the periphery of the network. None of the seven euro area G-SIBs in the sample belongs to this group.
Diversified funding banks form the core of the network. This group of 31 banks combines a substantial retail deposit base with broader use of repos, unsecured debt and secured market funding. Household deposits account for about 21% of liabilities, repos for 9% and long-term unsecured securities for close to 9%, with a further 9% from household deposits raised elsewhere in the European Economic Area (EEA). The group spans the whole size distribution and includes four of the seven G-SIBs in the sample.
Market-funded banks are few but heterogeneous. The remaining 13 institutions place more weight on long-term unsecured securities (11.5% of liabilities), derivatives (11%), repos (9%) and non-domestic deposits, while domestic household deposits play a smaller role (18%). The group brings together highly specialised issuers, such as development and promotional lenders, and three G-SIBs with broad but market-oriented funding. The split of G-SIBs between the diversified and market-funded groups is a useful reminder that bank size alone does not determine the structure of funding risk.
A notable result is the extent of migration across groups. The market-funded community expanded from 19 banks in 2020 to 38 in 2023, before falling sharply to 19 in 2024 and 13 in 2025. The retail-deposit group followed the opposite pattern: it declined from 27 banks in 2020 to 19 in 2023, then rose to 38 in 2024 and 39 in 2025 (Figure 2). In the 2023–2024 transition alone, 35 banks moved as a block from the market-funded to the retail-deposit group. The diversified group, fluctuating between 23 and 37 banks, acted as a transitional corridor between the two poles.
Figure 2. Number of banks per harmonised funding community, 2020–2025
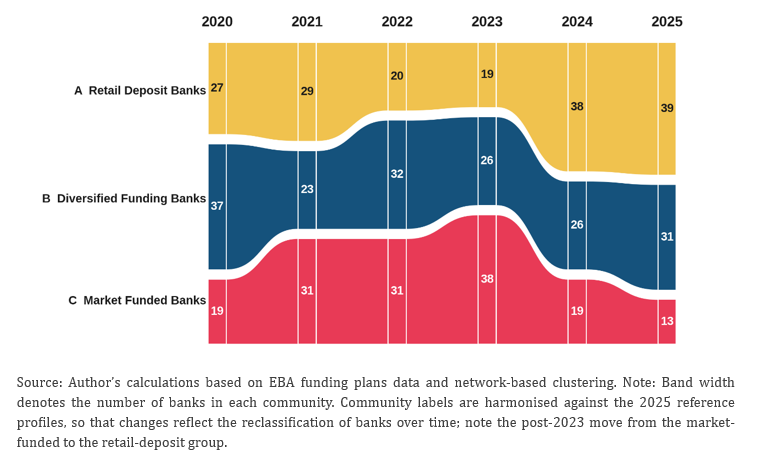
The timing of the reshuffling coincides closely with the unwind of TLTRO funding. This alignment should not, however, be read as identifying a causal TLTRO effect in isolation. Funding models also respond to interest rates, deposit competition, market access, regulatory issuance needs and bank-specific balance-sheet strategies. Still, the concentration of the largest movement around 2023–2024, with an entire segment of the system moving in the same direction, is consistent with a common adjustment to the withdrawal of central bank funding.
The transition has also been unusually fluid. None of the 83 banks remained in the same harmonised community in every year between 2020 and 2025, and the share of bank pairs that stay co-classified from one year to the next never exceeds 54%.3 In 2024, only 2 of the 38 retail deposit banks had been in that group the year before. Retention improved in 2025, when 26 of the 39 retail deposit banks kept their classification, a first sign of consolidation. The broader message, however, is that the euro area banking system has not yet settled into a stable post-TLTRO funding configuration.
Banks have become more selective in their individual funding structures, while increasingly relying on the same instruments. A bank can simplify or specialise its own funding strategy while still moving toward the same set of instruments used by many other institutions. In the network, this shows up as slightly greater bank-level exclusivity but lower segregation across liability categories.4 The banking system as a whole remains structurally stable, with a persistent hierarchy in which specialised banks draw on a subset of the instruments used by more diversified institutions, but the intensity of that hierarchy was temporarily disrupted in 2023–2024, at the peak of the tightening cycle.
Diversification bank by bank is not the same as diversification for the system. If many banks rely on the same instruments, investors or market infrastructures, a common shock can produce correlated refinancing needs. Repos are a clear example. Their growing role improves the ability of banks to redistribute liquidity and use collateral efficiently in normal times. But it also strengthens the link between bank funding conditions, collateral availability and the capacity of dealers and non-bank investors to intermediate during stress. Dealer balance sheets are themselves absorbing a growing share of sovereign issuance (Marinaro et al., 2026), and non-bank intermediaries add capacity in normal times but may withdraw procyclically. The result is a form of state-dependent fragility, where market-based intermediation works well when constraints are slack, but funding conditions may deteriorate rapidly when several of them bind at once.
The same logic applies to unsecured debt markets. As banks replace central bank funding and continue to meet MREL issuance requirements, more institutions may approach the same investor base at the same time. Under benign conditions, markets can absorb that issuance. Under stress, however, market access can become more expensive or temporarily constrained. What may look well diversified at the individual-bank level may therefore conceal a common system-wide refinancing exposure.
First, network metrics complement bank-level liquidity ratios. Standard indicators such as the LCR and NSFR remain essential, but they are designed around the resilience of individual institutions. Because the homogenisation documented here operates at the level of shared instruments rather than individual banks, an institution-by-institution assessment may underestimate the systemic dimension of funding risk, particularly when many banks seek to roll over similar instruments in capacity-constrained markets. A network view adds information on commonality, detecting whether many banks are becoming dependent on similar funding channels and whether particular market segments are becoming systemically important for refinancing. This is especially relevant when liquidity is less abundant and more unevenly distributed across banks.
Second, funding structure shapes monetary policy transmission and the operational framework. Retail deposit banks, diversified institutions and market-funded banks face different marginal funding costs and repricing speeds, so a change in policy rates affects their balance sheets through different channels. Aggregate pass-through measures may obscure significant differences across funding models, while common reliance on selected wholesale instruments can amplify responses when several banks adjust simultaneously, so that uniform interventions may have asymmetric effects across groups. The instability documented here is also consistent with Eurosystem refinancing operations retaining a structural role in banks’ liquidity management as the operational framework moves towards less abundant reserves, rather than serving only as a backstop.
Third, the current funding map provides a baseline for the Savings and Investments Union. The strong role of domestic retail deposits is a defining feature of the current euro area funding system. Over time, deeper and more integrated European capital markets could broaden the investor base for bank securities and support more cross-border funding. The network map offers a benchmark against which to assess whether initiatives such as the Savings and Investments Union lead to a more geographically and instrument-diversified funding system.
The TLTRO phase-out changed how euro area banks fund themselves, but it did not produce a single new model. Central bank funding has largely disappeared from liability structures and has been replaced through a combination of deposits, repos and debt issuance. Three distinct funding profiles coexist, and banks have moved substantially between them.
The system-wide message is subtler than the aggregate numbers suggest. Banks are becoming somewhat more selective individually, while increasingly sharing the same funding channels. That combination can be efficient in normal times but may create correlated refinancing pressures when market capacity is strained. Monitoring the post-TLTRO transition therefore requires looking not only at whether each bank is liquid, but also at how the funding choices of many banks interact.
The transition is not over. The euro area banking system appears to be moving toward a new funding equilibrium, but it is not there yet. Tracking these structural links will remain important for supervision, financial stability and the assessment of monetary policy transmission in a regime of less abundant central bank liquidity. Natural next steps are to link the three funding profiles to interest-rate pass-through and credit volumes, to separate the quantity effect of the TLTRO withdrawal from the price effect of higher policy rates, and to bring collateral and money-market data into the picture.
European Banking Authority (2025), Risk Assessment Report: December 2025.
International Monetary Fund (2025), “Euro Area Policies: Financial System Stability Assessment”, IMF Country Report No. 25/203, Washington, DC.
Marinaro, M., Podlich, N., Saldías, M. and Scheicher, M. (2026), “An analysis of euro area dealer banks’ sovereign bond holdings”, SUERF Policy Note No. 417, September.
Saldías, M. (2026), “Common funding, divergent models: network evidence on euro area bank liability structures after TLTRO”, Banco de Portugal Economic Studies, Vol. XII, No. 3, July 2026, pp. 51–78.
The templates (EBA/GL/2019/05, template P.01.02) report the carrying amount of each liability item at year-end. Subtotals, equity and other liabilities are excluded so that the analysis focuses on the components of the funding mix. The sample is a balanced panel of institutions reporting in every year.
The geographic split in the templates is defined relative to each bank’s home jurisdiction, so a category such as “domestic household deposits” aggregates different depositor pools across banks. The results should therefore be read as capturing similarity in the composition of funding models and common exposure to category-level dynamics, rather than competition for identical counterparties.
Measured by the Jaccard co-membership index between adjacent years. The 2023–2024 transition recorded the highest value (0.54) despite the largest number of movers, because banks moved as a block; the 2024–2025 transition recorded the lowest (0.31), reflecting more dispersed, bank-specific recalibration.
Overlap among liability categories (Horn’s index) rises from 0.24 in 2020 to 0.26 in 2025 and the segregation of liability categories (C-score) falls from 0.30 to 0.24, while the bank-level C-score rises from 0.16 to 0.18. Overlap among banks is stable at around 0.48. The changes are modest in size but consistent in direction across metrics.