

This policy brief is based on “Concepts and Challenges of Measuring Production of Artificial Intelligence in the U.S. Economy”. The views expressed are those of the authors and not necessarily those of the institutions the authors are affiliated with.
Abstract
Much of the current literature on the economic impact of artificial intelligence (AI) focuses on the uses of AI, but little is known about the production of AI and its impact on the economy. Accurate and reliable macroeconomic statistics describing AI production are necessary to understand the contribution of AI to economic growth, the industries involved in production, and the number of workers employed in the AI production process. This note summarizes a recent paper by the US Bureau of Economic Analysis (BEA) that outlines the concepts and challenges related to measuring production of AI using standard national accounting practices employed to calculate official statistics like gross domestic product (GDP). As with many new or transitioning areas of the economy, AI measurement issues relate generally to defining the scope of production and source data availability.
Macroeconomic statistics like GDP are often published by type of industry, such as manufacturing and construction. For areas of the economy that are not easily identifiable under standard industry classifications, or that span multiple industries, national accountants sometimes develop “satellite accounts” that allow for an analysis of selected slices of the economy. For example, BEA has developed satellite accounts for outdoor recreation, travel and tourism, the marine economy, and the digital economy. Satellite accounts are developed using data and methods consistent with official economic statistics, so they can be used to identify what share of the economy is attributable to the satellite account area. For example, recent BEA reports show that the marine economy represented 1.8 percent of GDP in 2022, while the digital economy represented 10.0 percent.
The US Supply and Use Tables (SUTs) provide the basis for BEA’s GDP by Industry statistics and its satellite accounts. The SUTs provide a comprehensive accounting of the value of products purchased by consumers, businesses, and government, plus the value that is imported and exported, all delineated by the producing industry. Developing a satellite account involves three main steps:
Identifying relevant product categories to include in a satellite account (step 1) requires a solid definition of the subject being measured.
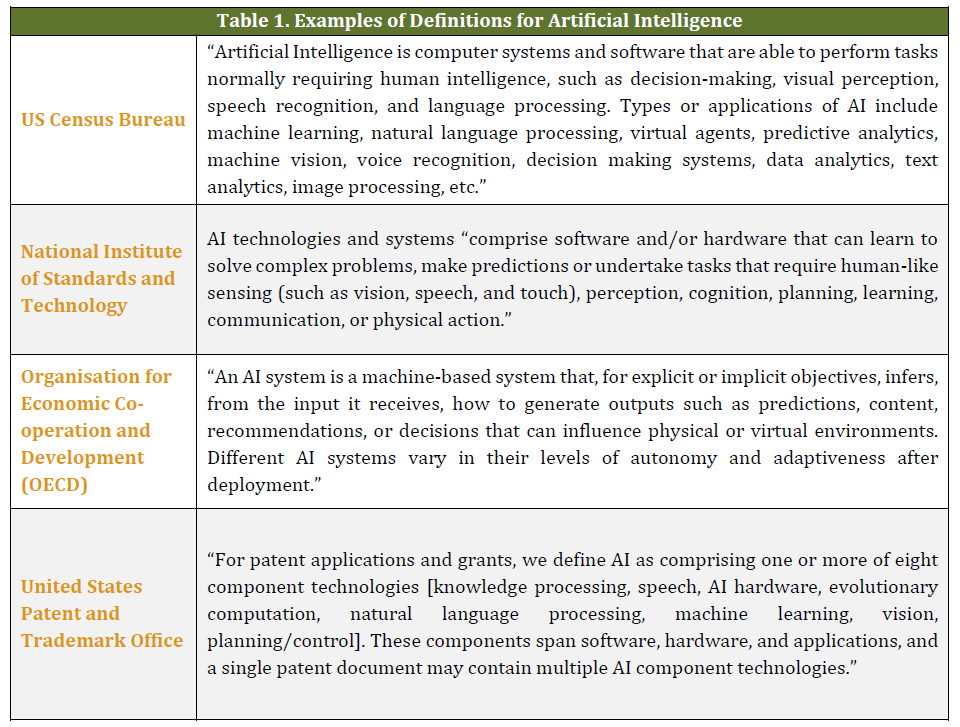
Defining the subject of interest is often the most important phase of a satellite account because it provides the overall framework for the new statistics and shapes which goods and services are chosen to be part of the account. AI has been defined in many ways, though a common underlying theme is technologies that perform tasks by mimicking human-like senses, learning, and actions (table 1).
For the purposes of developing an AI satellite account, an operationalizable definition must clearly delineate what products and industries are considered part of AI production. In general, existing AI definitions tend to mention, at least implicitly, both hardware and software components needed for computing. Three industries in particular appear to be significant: manufacturing (including accelerator chips), information (including software publishing), and professional and business services (including R&D and computer and data services).
The SUTs are comprised of thousands of product categories that are often very specific, but this is not always the case depending on the original source of the data. For example, the SUTs separately track production of three different types of powered circular saw blades for woodworking (solid tooth, inserted tooth, and other), but there is only one general category for engineering services. Given the general nature of many of the SUTs product categories, all BEA satellite accounts use external data sources to isolate relevant production in certain areas, and this would be true for an AI satellite account.
Though it depends on how the economic production of AI is ultimately operationalized, one approach is to focus on the foundational areas present in existing definitions, specifically, manufacturing of chips, software publishing, computer and data services, and R&D. Within BEA’s SUTs, each of these production areas are included in categories that include non-AI production since there are currently no product categories related solely to AI.
Within government statistics, the International Trade Administration (ITA) has trade data that shows dozens of categories of semiconductor manufacturing that could be useful in identifying the imported and exported value of AI-related chips. Similarly, the US Trade in Advanced Technology Products by Technology Group and Country data from the Census have AI products embedded in certain categories that could potentially be useful. However, neither of these datasets could be used directly to quantify AI chip production, since the data categories commingle AI chips with non-AI chips.
Private data sources may be necessary to measure the production of AI chip manufacturing. The International Data Corporation (IDC), a private data firm, sells an “Artificial Intelligence Infrastructure Tracker” that contains revenue information for AI hardware, software, and various related services. Since purchasing data is sometimes expensive and necessitates special funding, this data source may not be feasible. An alternative is to use revenue information from public financial reports for major chip producers, such as 10-K filings required by the Security and Exchange Commission or publicly traded companies like NVIDIA.
As with manufacturing, since no standalone categories exist in the SUTs for the production of AI software and relevant computer and data services, private vendor data or public financial information for key companies would likely be needed to measure production in this area. Another possible resource is the Occupational Employment and Wage Statistics (OEWS) data from the US Bureau of Labor Statistics. The OEWS provides employment and wage information for occupations within industries and has been used in previous satellite accounts as a proxy to isolate production within general product categories. Within the software publishing and computer systems design and related services industries, the OEWS data provide information on a few occupations that are AI-related, such as data scientists, software quality assurance analysts and testers, and database architects. Although these occupations include non-AI work, the data could still be used for trend analysis and perhaps to serve as a comparison for potential estimates.
BEA currently uses spending data from National Science Foundation (NSF) surveys to estimate R&D production in the SUTs. In 2019, the NSF’s Business Enterprise Research and Development survey asked about AI-related R&D for the first time. In that survey, 2,590 domestic companies noted positive AI R&D spending for that year. While questions related to AI have not been asked consistently since 2019, the survey shows the possibility for these questions to be added to existing NSF surveys. Likewise, it may be possible to update data collections from the National Center for Education Statistics to measure R&D in academia.
AI R&D occurs in both the private and government sectors. In 2018 alone, the Defense Advanced Research Projects Agency (DARPA) launched a $2 billion initiative to continue AI R&D, an area that the agency has been engaged in for over five decades. Information on AI R&D spending by the federal government is available via public budget documents for each agency.
The price indexes currently used to deflate components within the three categories mentioned above come from multiple sources, including the BLS Producer Price Index and Consumer Price Index, the Federal Reserve Board’s communication equipment prices, and several BEA-derived indexes that utilize private data sources. Until government agencies collect data specifically on AI products, private data sources would likely be needed to estimate price trends. The impact of prices on growth could be substantial in many areas, especially manufacturing of chips and servers.
As with many new or transitioning areas of the economy, AI measurement issues generally relate to defining scope and availability of source data. Although many AI definitions appear similar in concept, extensive research and outreach to subject matter experts would be needed to ensure a comprehensive and operational definition to anchor the development of macroeconomic statistics like GDP. There are often legitimate reasons to include or exclude certain types of economic production in satellite accounts. In the case of AI production, one could potentially argue that construction of data centers should also be included in a satellite account. But perhaps a larger issue is data availability. Since AI production is commingled with non-AI production within the SUTs, external data sources would be needed to isolate economic production of AI to develop satellite account statistics. While there is always the potential to change or add government data collections to better isolate AI production in the SUTs, that would take many years to implement and become available for the uses described in this Policy Brief.