

The views expressed here are those of the authors and do not necessarily represent the views of De Nederlandsche Bank or the Eurosystem.
Abstract
To understand whether financial stability may be at risk from extreme weather, appropriate analytical tools are needed. This policy brief argues that loan-to-value ratios (LTVs) offer an intuitive and informative way to monitor financial vulnerabilities related to extreme weather and real estate. Assessing vulnerabilities due to extreme weather will remain a complex task, but research focusing on LTV dynamics in this context is becoming increasingly available.
Damage due to extreme weather events can lead to financial instability (Carney, 2015; Bolton et al., 2020). However, whether such destabilizing effects can already occur in the short run remains a matter of debate (Cochrane, 2021; Waller, 2023).
To understand the extent to which financial stability may be at risk, policymakers need analytical tools. One key example is the use of climate scenario analyses, which have been conducted by the Bank of England, the European Central Bank and the Federal Reserve. These exploratory exercises provided helpful insights into tail risk, for instance by showing how damage to real estate can affect lenders’ credit risk. At the same time, scenario analysis is often data intensive and resource intensive.
This brief argues that loan-to-value ratios (LTVs) offer an intuitive and informative alternative to monitor financial vulnerabilities related to extreme weather and real estate. We sketch a theoretical framework and discuss recent research from the perspective of this approach.
The motivation for using LTVs is straightforward. Real estate is a large part of financial sector exposures. In turn, shocks to real estate can be a key source of financial instability.
The mechanics are as follows. A loan-to-value ratio compares the outstanding loan amount to the value of the underlying collateral. When extreme weather damages a property or reduces its market value, the denominator falls, mechanically increasing the LTV. In somewhat more technical terms, we can compute the LTV (after the shock) by dividing the initial LTV by a factor of (1 – damage), where damage is the percentage decline of the collateral value due to the weather shock. For instance, a weather-related shock of 50% of the collateral value would increase a pre-shock LTV of 50% to a post-shock level of 100%.
Focusing on LTVs in this context has clear benefits. First, LTVs are already a commonly used way to monitor financial vulnerabilities in the household sector. For example, they constitute a standard element used for vulnerabilities discussions in the context of, say the IMF or the FSB. Second, given that LTVs feed directly into bank credit risk calculations, they also provide an important leading indicator for ultimate financial risk impacts.
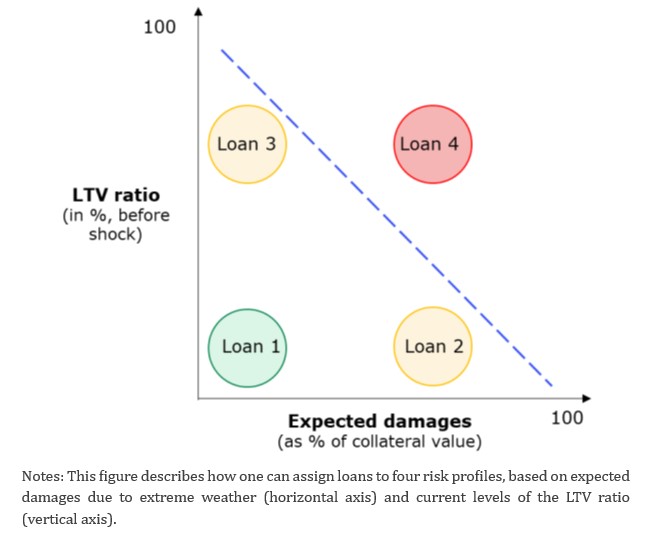
In an ideal case, authorities would monitor the financial vulnerabilities associated with extreme weather based on granular exposure data for real estate using a forward-looking perspective on damages. Figure 1 illustrates this ideal case. The example sketches a hypothetical situation where a lender has originated four loans of equal size. The four loans differ in terms of sensitivity to extreme weather (horizontal axis) and financial vulnerability (vertical axis). More precisely, the horizontal axis shows the expected severity of extreme weather shocks, as a percentage of the current collateral value. The vertical axis shows the LTV of the loan before the shock. The blue dotted line shows a threshold where the sum of the current LTV ratio and expected damages equal 100. The focus in Figure 1 is on the situation before the shock, which makes it suitable for vulnerabilities monitoring.
In terms of financial vulnerabilities related to extreme weather, one would evaluate the four loans as follows. For loan 1, both the expected damage and the current LTV ratio are close to zero. From the perspective of financial stability, this loan would be seen as low risk. At the other end of the spectrum, loan 4 would need careful monitoring, as the sum of its current LTV ratio and expected damages lies above 100. The level of the LTV ratio might be seen as unproblematic by itself. But, from the perspective of extreme weather, an adverse shock might push the LTV above 100%. Loans 2 and 3 present intermediate cases. For loan 2, the expected damages are high, even though the current LTV rate is low. For loan 3, the reverse is true. The LTV rate is close to 100%, implying that even a small amount of weather-related property damage would push the LTV above 100%.
Figure 1. LTV rates and expected damages for four types of loans
Admittedly, the ideal case presented in Figure 1 has its requirements in terms of data granularity and information on weather-related hazards. But one should not let the perfect be the enemy of the good. First, evidence along the lines of Figure 1 is already available. A research paper by Caloia et al. (2026) presents various versions of Figure 1 in case of flood events in the Netherlands. They find that under some extreme tail-risk flood scenarios, lenders would have a share of exposures for which the sum of expected damage rates and pre-shock LTV ratios is above 100%.
And, if granular data is not yet readily available, it is possible to start with jurisdiction-level information. For instance, one could construct a similar graph as in Figure 1, but with leverage-type indicators plotted against country-level exposures to extreme weather. The former might be proxied by household debt over GDP, while the latter might be sourced from databases such as ND-GAIN.
Third, there is emerging evidence from research papers regarding LTV dynamics and extreme weather events. There seems to be some interesting heterogeneity in terms of findings, which we can describe with the help of Figure 1. Here, it is important to reiterate that Figure 1 describes the ex-ante situation, while some of this research focuses on the LTV after the extreme weather event. A 2023 study shows that in Spain, pre-shock LTVs in areas with flood risk are not lower than outside of such risky areas. An interesting question would be, whether this finding is more comparable to the combination of Loans 1 and 2 or, more worrisome, to the combination of Loans 3 and 4. Bellrose et al. (2021) find that, in case of climate change, a share of Australian real estate loans would move to LTVs above 90%. This type of finding might be represented by Loan 3 in Figure 1. For Canada, Johnston et al. (2023) find that average LTVs would remain low after floods. Such an ex-post outcome might be akin to the ex-ante level of vulnerabilities represented by Loan 1 in Figure 1.
Assessing vulnerabilities due to extreme weather is a complex task, but it does not have to rely solely on highly sophisticated models or resource intensive analyses. Loan-to-value ratios offer a practical and intuitive way to understand weather-related risks related to real estate from a financial stability perspective. As authorities deepen their understanding of weather-related risks, LTV-based indicators can already play a useful role alongside more complex analytical tools, particularly in monitoring real estate-related vulnerabilities and guiding further analytical refinements. This is an area where research and policy can continue to reinforce each other.
AMCESFI (2023), Biennial report on climate change risks to the financial system.
Bellrose et al (2021), Climate Change Risks to Australian Banks. RBA Bulletin, September.
Bolton, P., M. Després, L.A. Pereira da Silva, F. Samama, and R. Svartzman (2020). The green swan: Central banking and financial stability in the age of climate change. Bank for International Settlements.
Caloia et al (2026), Floods and financial stability: Scenario-based evidence from below sea level, Journal of Financial Stability, forthcoming.
Carney, Mark J. (2015). Breaking the tragedy of the horizon—climate change and financial stability. Speech at Lloyd’s of London, 29 September 2015.
Cochrane, J. H. (2021). A convenient myth: Climate risk and the financial system. National Review, 17 November 2021.
Johnston et al. (2023), Climate-related flood risk to residential lending portfolios in Canada, Bank of Canda, Staff Discussion Paper 2023-33, December.
Waller, C. J. (2023). Climate change and financial stability. Speech given at the IE University-Banco de España-Federal Reserve Bank of St. Louis Conference Current Challenges in Economics and Finance, 11 May 2023.