

This policy brief is based on Xia, F.D. and Zulaica, O. (2026), “Embracing carbon uncertainty in portfolio construction”, BIS Working Papers No 1362. The views expressed are those of the authors and do not necessarily reflect those of the BIS or its member central banks.
Abstract
How can sovereign bond investors integrate climate objectives into portfolio construction? This brief summarizes a framework designed to account for both financial and environmental considerations in sovereign bond portfolios. Central to this approach is the concept of “carbon returns”—analogous to financial returns—which are modelled as random variables to capture the inherent uncertainty of future emissions outcomes. Based on the financial and carbon return profiles of individual countries’ sovereign bonds, we employ an algorithm inspired by Hierarchical Risk Parity (HRP) to construct portfolios that balance each country’s contribution to the portfolio’s tail risk, as measured by expected shortfall, of financial and carbon returns. Applied to developed-market sovereign bonds, the results show that investors can build portfolios that align decarbonisation objectives with financial performance both in-sample and out-of-sample, while accommodating different preferences by tilting toward financial downside-risk control, carbon downside-risk control, or combinations of both.
Institutional investors — including reserve managers — are increasingly integrating sustainability objectives into portfolio decisions. In sovereign fixed income, this raises two practical questions: how to measure a portfolio’s carbon footprint, and how to combine that footprint with financial performance considerations.
Most existing portfolio approaches decarbonise by imposing carbon constraints (for example, a maximum “carbon budget”) while optimizing financial objectives such as tracking error relative to a benchmark. A key limitation of this practice is that it typically treats countries’ carbon footprints as deterministic — either the latest observed level, or a single forward-looking scenario path. This treatment is at odds with the reality that transition outcomes are uncertain and can differ materially across states of the world. In financial portfolio construction, ignoring uncertainty and co-movement in returns would be considered poor risk management; we argue that the same logic should apply to emissions outcomes when climate objectives matter for portfolio choices.
To capture this uncertainty directly, we introduce carbon “returns”, defined as the negative change in a country’s carbon emissions over time so that emissions reductions correspond to positive “returns”. Carbon returns are therefore analogous to financial returns: once defined, they allow standard summary statistics (means, volatility, tail risk measures, dependence) to be computed for decarbonisation outcomes just as they are for prices.
Shifting the focus to stochastic carbon returns from historical emission levels and/or deterministic emission projections offers two key advantages. First, focusing on emissions changes rather than emissions levels avoids mechanically favouring today’s low emitters and instead rewards actual reductions over time. Second, we document that while measured emissions levels vary substantially across accounting conventions (production-based vs consumption-based, and land-use adjustments), the distributions of carbon returns are comparatively similar across these definitions. This reduces the sensitivity of portfolio construction to debates about the “right” emissions accounting level, by focusing on a more stable object: the historical distribution of emissions changes.
In the empirical implementation, we use CO₂ emissions as a proxy for carbon footprints, motivated by their large share of overall greenhouse gas emissions in advanced economies and by better data availability. Production-based CO₂ emissions are used as the baseline measure. The sample covers 23 advanced economies with annual emissions data from 1982 to 2021 and financial return data for USD-based monthly returns on constant-maturity 5-year sovereign bonds from September 2001 to May 2023.
We first find that the classical mean-variance optimisation algorithm can be applied to carbon returns, delivering an “efficient frontier” defined between expected decarbonisation and decarbonisation volatility. However, it also highlights a familiar drawback: mean-variance solutions tend to produce corner allocations, concentrating weights in a small number of countries. This feature is often unattractive for sovereign investors that value diversification and robustness.
We therefore propose an allocation framework inspired by Hierarchical Risk Parity (HRP) proposed by Lopez de Prado (2016). HRP is designed to avoid corner solutions and to reduce sensitivity to estimation error by clustering assets based on their dependence structure and allocating risk hierarchically rather than relying on covariance-matrix inversion as in mean-variance optimisation.
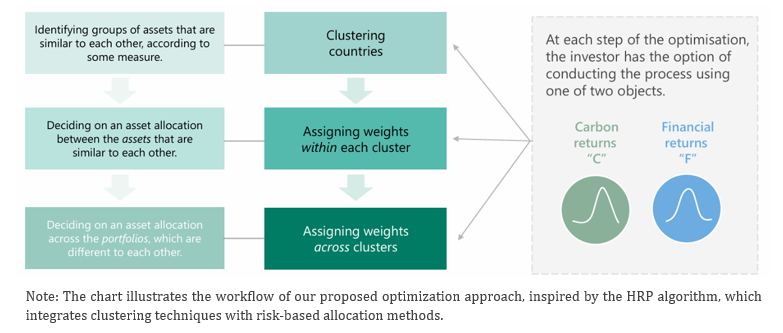
We introduce two modifications to the standard HRP approach. First, we replace volatility with expected shortfall (ES) as the risk metric, so that the optimisation focuses on tail risk. Given that carbon risk is characterized by extreme but infrequent events with significant impact, we believe that focusing on tail risk management is crucial to climate risk management. Second, we allow the inputs at each step of the HRP procedure to come from either financial returns or carbon returns. The workflow therefore has three stages: (1) clustering countries, (2) allocating weights within clusters, and (3) allocating weights across clusters. Each stage can be implemented using financial (F) or carbon (C) returns, yielding eight portfolio configurations in total, going from a purely financial implementation (F,F,F) to a purely carbon-focused one (C,C,C), with mixed variants in between. Figure 1 illustrates the workflow.
Figure 1. Optimization workflow
Because carbon returns are available only annually and the historical sample is therefore short, the paper enriches the carbon return distribution using a simulation approach: a t-copula is estimated to capture joint dependence (non-linear correlation, therefore incorporating tail dependence), while the marginal distributions are preserved using non-parametric estimation. The resulting simulated scenarios are used to obtain more stable tail risk estimates for carbon returns.
We evaluate the approach both in-sample and out-of-sample. The out-of-sample exercise begins in January 2008, using financial data up to December 2007 and emissions data up to 2006 (reflecting the necessary reporting lags), then re-optimises iteratively as new observations arrive.
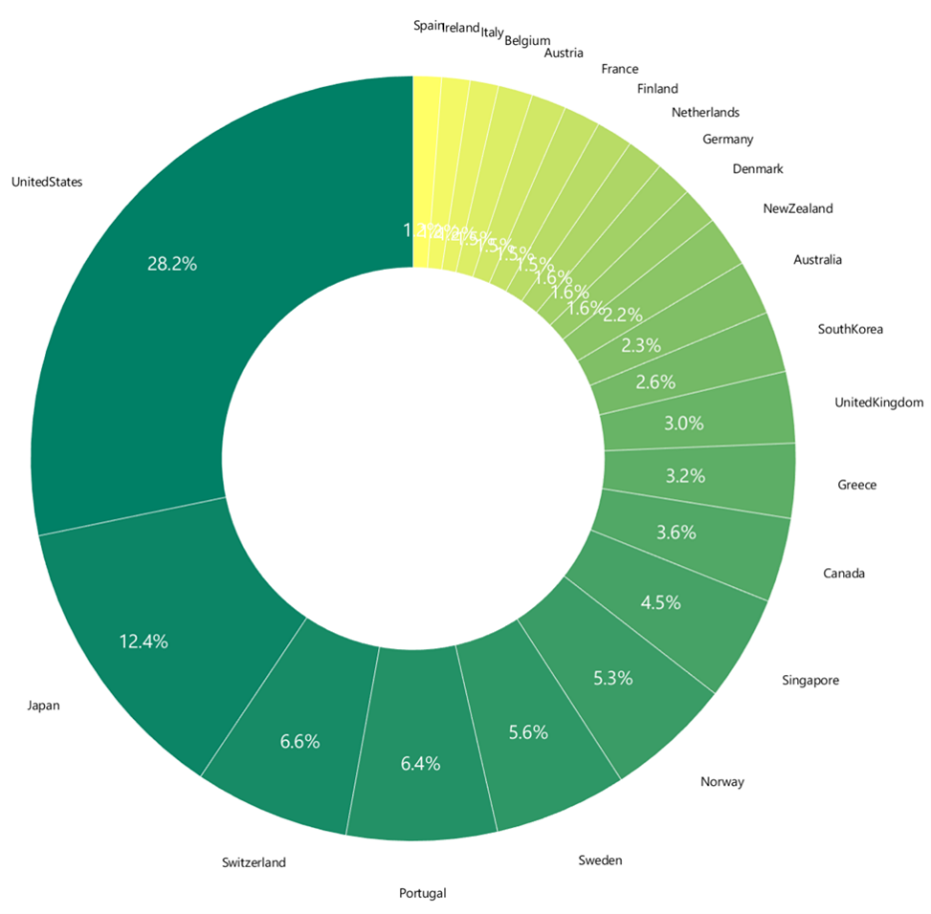
Two extreme configurations help illustrate the mechanism: (F,F,F) and (C,C,C). Portfolios differ substantially in their country weights depending on whether optimisation is conducted in financial space or carbon space. In-sample, the paper reports that the (F,F, F) portfolio places large weight on sovereigns associated with lower financial expected shortfall, while the (C,C,C) portfolio produces a more even distribution across countries.
Figure 2. Weights of individual countries for in-sample optimized portfolios
(F,F,F) portfolio
(C,C,C) portfolio
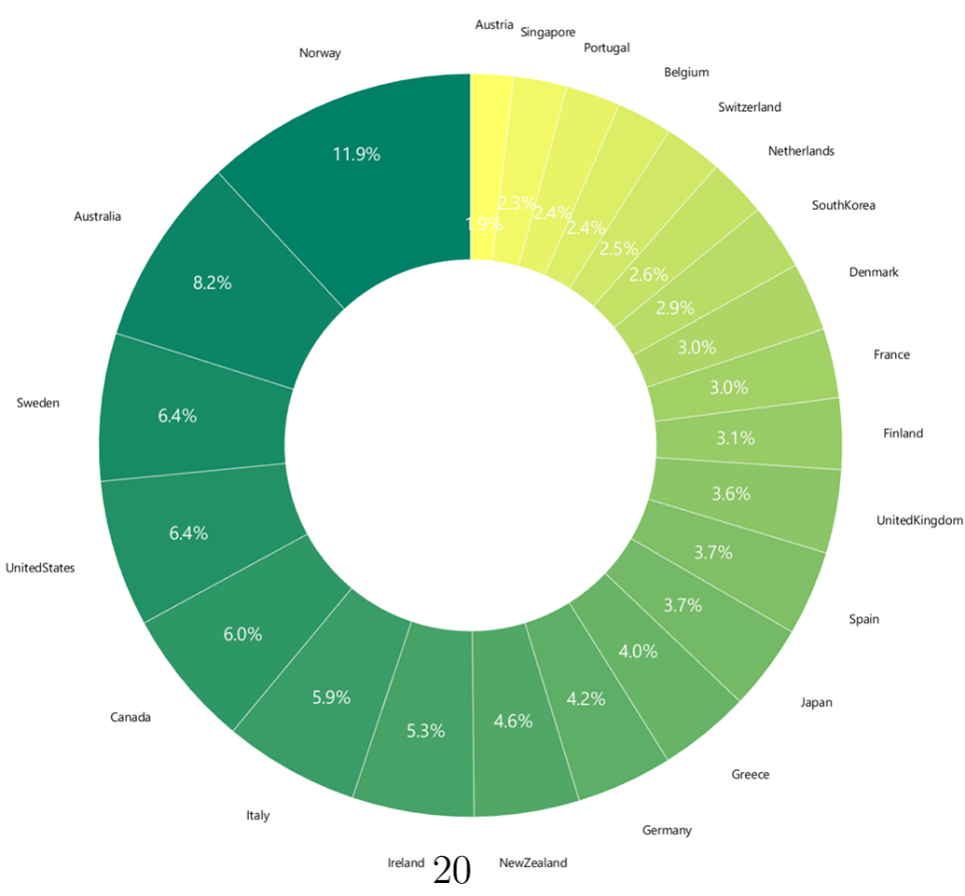
Note: The first pie chart shows the weight of individual countries in the (F,F,F) optimized portfolio, while second pie chart shows the weight of individual countries in the (C C,C) optimized portfolio. The three letters indicate the inputs used at the three stages of the optimisation workflow: clustering countries, allocating weights within clusters, and allocating weights across clusters. F denotes financial returns and C denotes carbon returns. Thus, (F,F,F) uses financial returns at all three stages, whereas (C,C,C) uses carbon returns at all three stages.
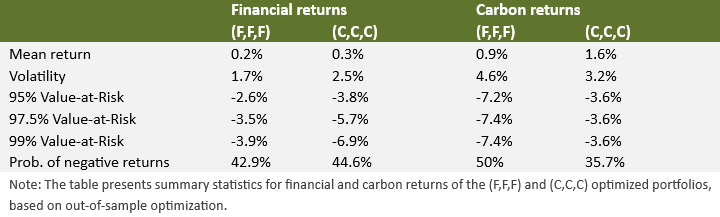
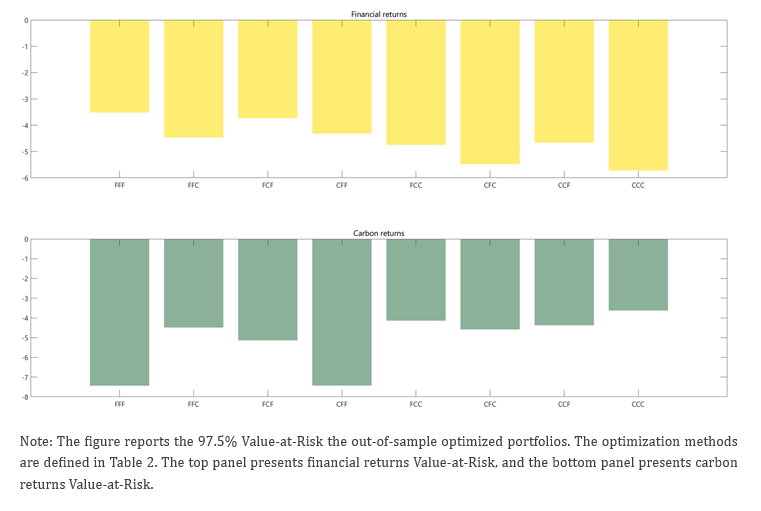
Crucially, the framework behaves as designed when evaluated in the two “return spaces”. In out-of-sample results, the (F,F,F) portfolio exhibits lower downside risk for financial returns, while the (C,C,C) portfolio exhibits lower downside risk for carbon returns. The summary statistics Table 1 shows this contrast clearly. For example, out-of-sample financial return 97.5% VaR is less negative for (F,F,F) (-3.5%) than for (C,C,C) (-5.7%). In the carbon dimension, the ordering reverses: out-of-sample carbon 97.5% VaR is less negative for (C,C,C) (-3.6%) than for (F,F,F) (-7.4%). The probability of negative carbon returns (years in which emissions rise) is also lower for (C,C,C) (35.7%) than for (F,F,F) (50.0%).
Tabe 1. Return summary statistics for out-of-sample optimized portfolios
Beyond these extremes, we also reports a general pattern across the full set of eight configurations: portfolios that place more weight on financial inputs (“more F’s”) tend to have lower financial tail risk, while portfolios that place more weight on carbon inputs (“more C’s”) tend to have lower carbon tail risk. In this sense, the framework provides a menu of implementable choices that can be aligned with different investor mandates, while keeping the methodology consistent across variants.
Figure 3. 97.5% Value-at-Risk (%) for different out-of-sample optimized portfolios
Lopez de Prado, Marcos. (2016) “Building diversified portfolios that outperform out-of -sample,” Journal of Portfolio Management.
Xia, F.D. and Zulaica, O. (2026). Embracing carbon uncertainty in portfolio construction. BIS Working Papers No 1362.