

The views expressed are those of the authors and do not necessarily reflect those of the Bank of Finland or the Eurosystem.
Abstract
Just recently, the OECD published results from a new PISA survey that indicated large, mainly negative, changes in educational achievement in many countries over the period 2003–2025. Similar results have been obtained with the mathematics TIMSS exams that have been carried out over the period 1995–2023. On the other hand, we have observed a marked decline – even a standstill – in productivity even though there has been no decline in R&D activity in most countries. Nor have we seen a decline in schooling expenditures; rather, there has been trend-line growth. We compare the co-movements of these variables in a panel setting and find that the relationships are far from linear, reflecting some tendencies of diminishing returns. Another important element that can explain the changing relationship is the change in the gaps between the local productivity level and the global productivity frontier. This factor is not constant either, but depends on the functioning of markets, which in turn shows up in the openness of the economy and the level of foreign trade.
In 1962, Edward Denison published a famous book on the sources of economic growth in the United States (Denison 1962). Denison’s study showed that investment in education is of crucial importance from the point of view of economic growth. The same conclusion applied to “knowledge,” which can be interpreted as the results of research and development activities. Denison’s results made a profound effect on economic thinking and economic policies not to speak about educational and research financing. Since 1962, nobody has really challenged Denison’s main results, even though estimates of the size of the respective contributions have changed many times. Here we do not challenge the basic logic of Denison’s results but rather consider the efficiency issue: does investment in education and R&D have a constant rate of return irrespective of time, the stock of human capital and knowledge, and the country?
Table 1. Existing data on educational attainment
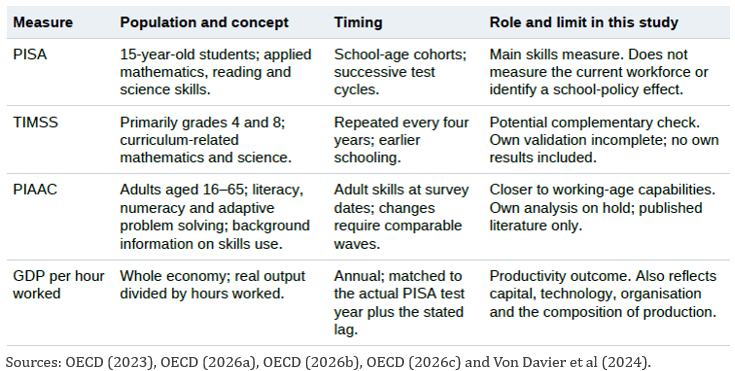
What makes us somewhat skeptical is the recent data on educational attainment. There are some alternative indicators of educational attainment (Table 1), but here we concentrate on the new PISA results and the relationship between PISA and labor productivity for practical data reasons (not because of different or “wrong results). In Figure 1 we show the basic scatter diagram for the values of all three PISA scores together with the corresponding aggregate productivity values. It seems that the relationship is not linear but rather concave, suggesting that there is some sort of diminishing-returns property in schooling. When the quality of basic education is already very high, further improvement may not show up in aggregate productivity. Estimation results are not, however, robust enough to exclude alternative explanations.
A similar outcome emerges when we focus on schooling expenditures (Figure 2), which are often used as an indicator of educational quality. As we see from Figure 2, however, there are many individual-country differences between the variables. The relationship between the PISA scores and expenditures is quite weak and sensitive to the sample. Thus, the positive slope is only due to relatively low income countries. Country differences show up more clearly when we look at the time series from individual countries, where we almost always see an upward-sloping trend in (real) expenditures but a decline in PISA results (thus pairwise correlations are typically negative). Even though the results seem quite robust, a warning is warranted. We do not have detailed expenditure data all the way down to the subject level, but only more aggregate expenditure numbers, and the development of real expenditures and the expenditures/GDP ratio is sometimes quite different.
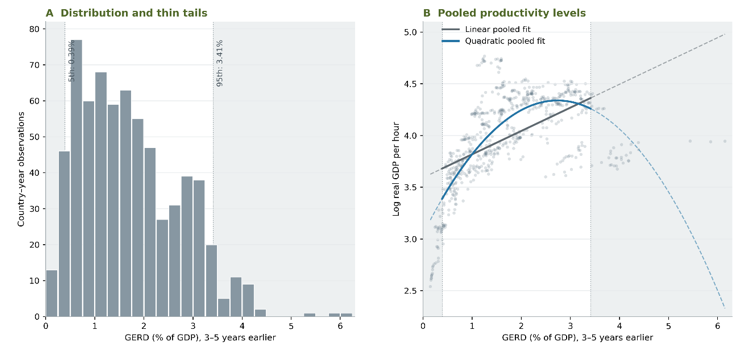
A somewhat similar nonlinearity result appears again when we focus on investment in R&D (Figure 3). This figure looks quite similar to the PISA–productivity graph, even though the distribution of R&D expenditures is so skewed that it is difficult to draw firm conclusions about the nature of the curvatures beyond GDP shares of 3 percent. Even so, here too, we find signs of diminishing returns that are consistent with the literature and the idea that it is more difficult and costly to make new innovations (cf. Bloom et al. 2020 and Goldin et al. 2024).
Figure 1. The relationship between PISA scores and productivity
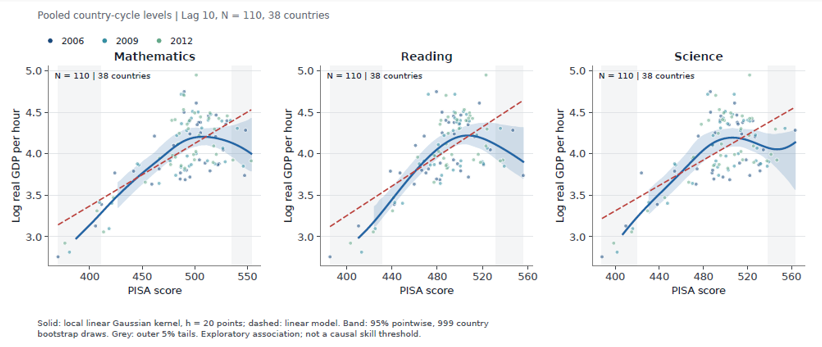
Figure 2. The relationship between educational expenditures and the PISA math scores
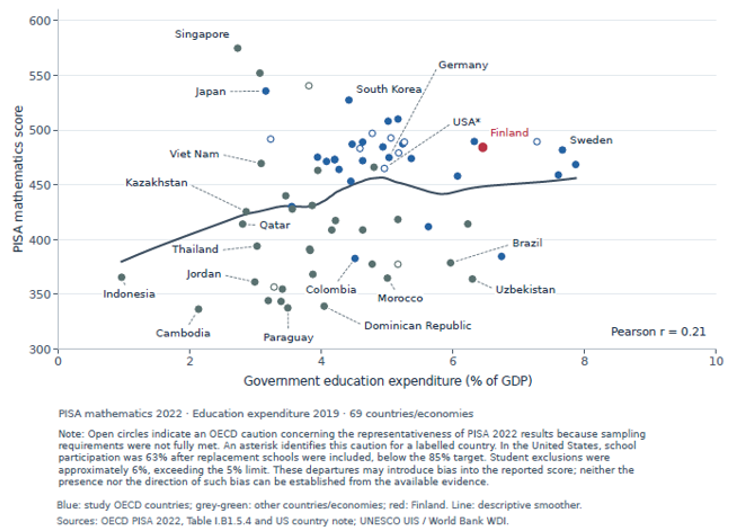
Figure 3. Investment in research & development and productivity
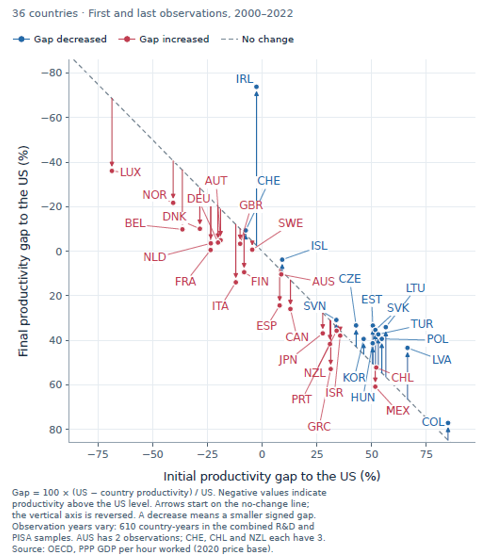
But why would there be such a nonlinearity in the schooling-attainment–productivity relationship? There is no shortage of suitable candidates, but in our view the most obvious explanation is the different country dynamics in terms of the global productivity frontier (cf., e.g. Andrews et al. 2025 and Egert et al. 2023). Following the seminal paper of Lucas (2009), we can argue that when a country is far from the frontier, technology adaptation is easy and cheap, while the opposite applies when it starts closing the gap. Then the return from domestic investment to human capital and knowledge will inevitably decrease. In Figure 4 we illustrate the dynamics with OECD countries. Clearly there is a difference between countries that start from a low level and those that have been closer to the U.S. level.
Figure 4. Changes in the productivity gap vis-à-vis USA
Lucas’s model says that the growth rate of output or productivity in country (i) is related to the frontier country in the following way: gi = g*(GDP*/GDPi)θ, where (g) denotes the growth rate of GDP and GDP itself is per-capita GDP at constant prices. Starred values indicate the productivity-frontier country (here, simply the USA). θ is the key parameter that reflects the strength of the catch-up effect. We estimated the parameter using the BCLD (2026) cross-country productivity comparison data with 1650 data points for the period 1950-2022 and obtained a value of 0.72 when the growth rates were computed over 10 years. When the lag length was increased to 50 years, the parameter value was 0.66, which both are very close to 0.70 that Lucas himself used in simulations.
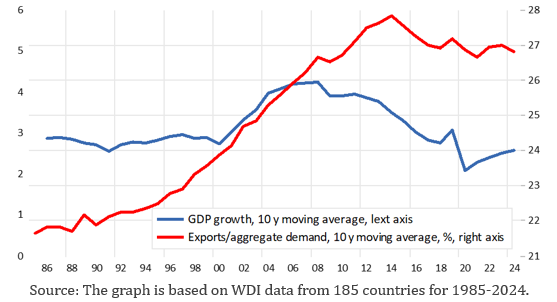
But what is behind the parameter θ? Lucas calls it “openness,” but not just the size of foreign trade; rather, openness in the sense of “openness to the functioning of free markets” (see Gräbner 2018 for the numerous different measures of openness that are far from equal both in terms of levels and change rates). Even though this is the case, we estimated a panel equation in which GDP growth was explained by the export share of aggregate demand (the most often used measure) and lagged GDP growth (plus fixed effects) for 27 EU countries for 1960–2025 and obtained an elasticity estimate for the trade share equal to 0.12 (R2=0.60). This clearly indicates that “closed economies” will ultimately fail to achieve high growth rates. This may also (partly) explain the slowdown of growth after the financial crisis: economic opening has not continued to increase in the same way as during the pre-2015 period but has rather started to decline.
Figure 5. The relationship between openness and growth
We are used to hearing recommendations of the type: just increase educational and research finance to avoid a productivity-growth slowdown. But our analyses suggest that the outcome is not so simple as proposed. The proposed remedies may work well with less-developed countries, but when countries are close to the productivity frontier a more sophisticated investment strategy is required that acknowledges the simple fact that not all schooling and not all research is equally productive. And the functioning of the whole society—i.e., the product and labor markets—deserves more than just lip service.
Andrews, D., Égert, B. and de la Maisonneuve, C. (2025). Adult skills and productivity. OECD Economics Department Working Papers 1834. https://doi.org/10.1787/12ac6e8c-en.
BCLD (2026) The long-term productivity database. https://www.longtermproductivity.com/
Bloom, N., C. Jones, J. Van Reenen, and M. Webb (2020) Are Ideas Getting Harder to Find? American Economic Review 2020, 110(4), 1104–1144, https://www.aeaweb.org/articles?id=10.1257/aer.20180338.
Denison, E. (1962) The Sources of Economic Growth in The United States and the Alternatives Before Us. New York: Committee for Economic Development.
Égert, B., de la Maisonneuve, C. and Turner, D. (2023). Quantifying the effect of policies to promote educational performance on macroeconomic productivity. OECD Economics Department Working Papers 1781. https://doi.org/10.1787/b00051cc-en.
Goldin, I., Koutroumpis, P., Lafond, F. and J. Winkler, (2024). Why Is Productivity Slowing Down? Journal of Economic Literature 62, 196–268. https://doi.org/10.1257/jel.20221543.
Gräbner, C., P. Heimberger, J. Kapeller and F. Springholz (2018) Measuring Economic Openness: A Review of Existing Measures and Empirical Practices. WIIW Working Paper 157. https://wiiw.ac.at/measuring-economic-openness-dlp-4741.pdf.
Lucas, R. E., Jr. (2009). Trade and the Diffusion of the Industrial Revolution. American Economic Journal: Macroeconomics 1, 1–25. https://doi.org/10.1257/mac.1.1.1.
OECD (2022) PISA 2022 Results. Volume I. https://www.oecd.org/en/publications/pisa-2022-results-volume-i_53f23881-en.html
OECD (2024). Do Adults Have the Skills They Need to Thrive in a Changing World?: Survey of Adult Skills 2023. OECD Skills Studies. OECD Publishing, Paris. doi: 10.1787/b263dc5d-en
OECD (2026a). PISA 2025 Results (Volume I): Future-Ready Students. PISA. OECD Publishing, Paris. Historical country scores: Tables I.B1.2a.36–38. doi: 10.1787/73451bc5-en
OECD (2026b). Towards a stronger link between PISA and PIAAC: Two assessments, one story? OECD Education Working Papers, No. 349. OECD Publishing, Paris. doi: 10.1787/95e96165-en
OECD (2026c). OECD Productivity Statistics: Database metadata. Productivity levels, GDP per hour worked. Data vintage accessed 17 September 2026; constant-price series used in this Note.
Von Davier, M., A. Kennedy, K. Reynolds, B. Fishbein, L. Khorramdel, C. Aldrich, A. Bookbinder, U. Bezirhan and L. Yin (2024). TIMSS 2023 International Results in Mathematics and Science. Boston College, TIMSS & PIRLS International Study Center. https://www.iea.nl/publications/timss-2023-international-report.