

The views expressed are those of the authors and do not necessarily reflect those of the Bank of Finland or the Eurosystem.
Abstract
Inflation expectations are commonly treated as a forward-looking variable that can be inserted into a Phillips curve. This paper asks a prior measurement question: what do household inflation expectations actually measure? Using monthly EA20 data from the European Commission consumer surveys and the ECB Consumer Expectations Survey, we show that measured expectations are best understood as part of a broader real-time belief system that is systematically related to perceived inflation, salient current prices, unemployment expectations and assessments of the general economic situation. The central result is not that expectations are useless, but rather that they cannot be treated in the same way as other (semi-)predetermined variables — particularly because their basic structure is not time- and regime-invariant. They are a fragile object to interpret as an autonomous structural expectations term in a Phillips curve.
Following the high-inflation period of the 1970s and 1980s, an extraordinary consensus emerged that expectations are the key ingredient in macroeconomics — to the point where some claim that “expectations are all that matters” (Woodford 2005). In empirical macroeconomics, this view appears in policy debates, official forecasts, and the prominent role of expectation variables in key behavioral equations, most notably the Phillips curve. There is no reason to downplay the importance of expectations. Nevertheless, we should acknowledge some puzzling features in their empirical implementation, not to mention the numerous measurement issues. In this paper, we address several of these issues using European consumer surveys (European Commission consumer confidence data and the ECB Consumer Expectations Survey) as our reference material.
When discussing conceptual issues, two main problems come to mind. First, how can we distinguish inflation “expectations” from other assessments of the overall economic situation (e.g., unemployment or capacity utilization) in a Phillips curve setting? Both variables are genuinely stochastic, and the measure of the overall economic situation is itself an expected value derived from some — possibly even the same — information set. At any given moment, the quality of these assessments can vary depending on the strength and concordance of the available signals. Turnovsky (1969) provides a nice Bayesian model of how new information is used to update expected market prices. The resulting framework is essentially an adaptive expectations (or learning) model, in which the key ingredient is the dispersion of signals (see also D’Acunto et al. 2021 on the importance of different signals). Because signal dispersion is seldom constant, the basic structure of the forecasting model is time varying. This produces specifications at odds with models such as Calvo (1983), which assume fixed probabilities of price changes.
The second conceptual problem concerns the frequency of price changes and price rigidities. Sticky prices are a central element of the New Keynesian Phillips curve and provide the justification for activist economic policy. Despite its crucial role, this assumption has remained largely untested and is typically presumed to be invariant over time and across inflation regimes. Recent evidence (e.g., Bun et al. 2025) strongly suggests that these invariance assumptions are unwarranted, which in turn casts doubt on parameter invariance in the Phillips curve.
Regarding the information signals relevant to expected inflation, it is difficult to argue that they exclude current economic activity. There is no obvious way to separate the role of this information from other potential drivers of inflation expectations. In the conventional New Keynesian Phillips curve, both inflation expectations and a measure of economic activity appear on the right-hand side, and researchers routinely attempt to disentangle their effects through empirical measures and econometric analysis. With survey data this separation is technically straightforward, but it is far from clear that the variables can be interpreted as arising from completely independent channels (this issue is discussed, for example, in Werning 2022).
Consumer survey data provide information not only on expected inflation but also on perceived current inflation. The latter is not the official statistical measure but rather respondents’ assessment of inflation based on the price signals they observe. We thus have two expected values of inflation that differ only in their time horizon. It is particularly interesting to compare these alongside the corresponding assessments of economic activity, which the surveys also collect. This is what we intend to do in the remainder of the paper.
Before proceeding, it is worth asking why expected inflation appears in the Phillips curve (apart from ensuring long-run homogeneity of degree zero in real variables, as emphasized by Friedman 1968). The standard justification is the assumption of price rigidity (together with some degree of market power), which profoundly affects firms’ pricing decisions and creates scope for activist policies. Today, however, price rigidity increasingly sounds like an unrealistic description of many parts of the pricing system. So-called Amazon-type pricing — with extremely high frequency and automated responses to market signals — is becoming more common. It is therefore clear that the coefficient on expected inflation in the Phillips curve cannot be constant in the Lucas (1976) sense. Moreover, in a Bayesian (Turnovsky-type) adaptive/learning model, expectations are by no means a mechanical mapping from information to inflation forecasts; they depend crucially on the quality of the available information. When information quality is poor (e.g., conflicting signals), expectations may not be updated at all even if underlying conditions change (Turnovsky 1969; Coibion and Gorodnichenko 2015). We do not have direct hard data on price rigidities, but we may refer e.g. to Bun et al. (2025) who show that the share of state-dependent pricing in the UK retail sector rose to 48% in 2022, up from 31% in 2019.
Even with data on inflation expectations, we face the further problem of determining how changes in those expectations are transmitted into actual price setting. This transmission surely depends on the structure of price adjustment, the horizon of expectations, and the practical ways in which firms revise prices. Thus, even if expectations matter, their effect on inflation depends on the pricing environment through which they operate. When firms, households, or forecasters are introduced into a model with “some” measure of inflation expectations, what are those expectations actually capturing? Are they beliefs about future aggregate trend inflation, reactions to recent price developments, extrapolations from salient relative prices, signals of policy credibility, or reflections of broader macroeconomic and fiscal uncertainty? Quite obviously, before studying the pass-through from expectations to prices, we must first understand the formation and content of the expectations themselves. The difficulty of this task becomes clear when we observe the anomalies that arise between different measures and across time periods. In this paper we specifically examine some major crises during the euro area period.
In what follows, we scrutinize the data from both above-mentioned surveys. In Figure 1, we show the mean values from European Commission Consumer Confidence Survey (ECCCS) for the period 1995M10-2025M12 for 20 countries and figure 2 corresponding values from the ECB Consumer Survey (CES) which only covers the period 2020M4-2026M3 for 11 countries.
Figure 1. Average values form the European Commission Consumer Survey panel data
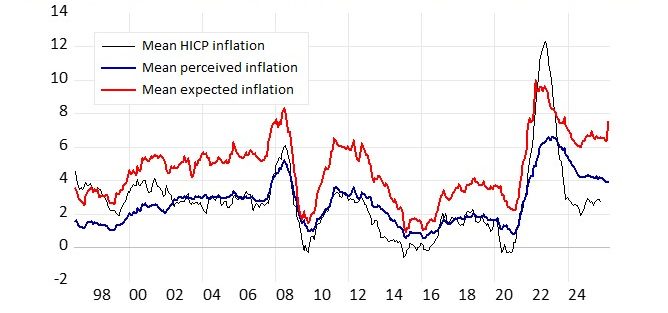
The European Commission only publishes the saldo numbers for the answers to the qualitative questions but we have constructed the pseudo growth rates for this data using the so-called Carlson-Parkin (1975) method. Hence the transformation should be interpreted as a quantification of ordinal survey responses, not as a direct observation of households’ numerical inflation forecasts.
Only in the case of Finland, actual percentage growth rates are available and can be used to control of the quality of the constructed (Finnish) series.
Figure 2. Average values form the ECB Consumer Survey panel data
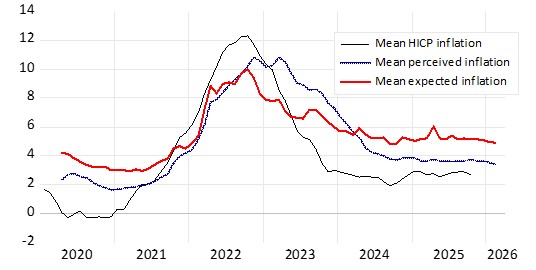
Both surveys display somewhat unusual features in the relationship between perceived and expected inflation during high-inflation periods, particularly 2022–2024. In those years, both survey variables remained relatively elevated despite the relatively rapid decline in official inflation. More recently, expected inflation has shown a renewed increase, possibly linked to the new conflicts in the Near East. Over time, expected inflation rates are clearly higher than perceived rates, while perceived inflation comes quite close to the official realized rate. (Of course, the two time series are not directly comparable because of the way the expected inflation series is constructed.) A notable feature of the survey data is that no (one-sided) Granger causality can be detected between the two series. Perceived and expected inflation are highly correlated (r = 0.88), suggesting that consumers have difficulties distinguishing between current and future price developments. However, the relationship is not time-invariant. When we regress expected survey inflation on perceived inflation, the coefficient becomes systematically smaller when inflation gets higher and even changes the sign as the following Table 1 shows. If expected inflation is predicted by expected unemployment, similar instability turns out. The negative sign comes out only in the high inflation regime.
Table 1. The relationship between expected inflation, perceived inflation and unemployment expectations
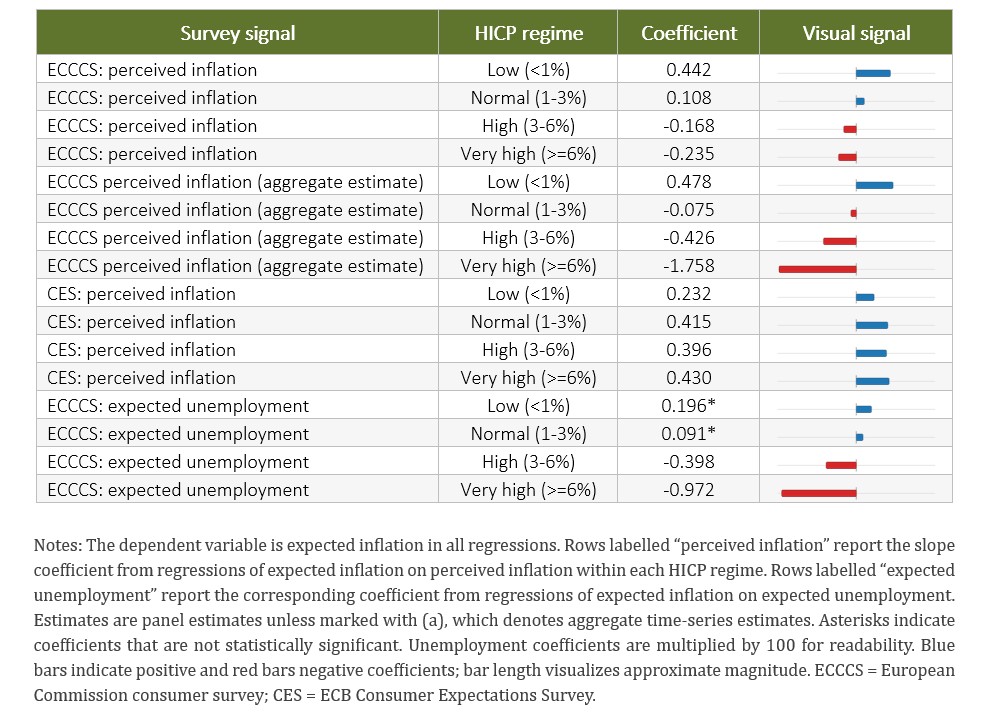
Similar patterns emerge in the ECB survey data. In time series, survey-based measures exhibit more persistence than actual inflation. This may simply reflect consumers’ gradual adjustment to new prices. Another possibility, which is supported by our data, is that consumers focus on different baskets of goods than statistical offices when forming their inflation perceptions and expectations. In contrast to the European Commission data, the ECB survey reveals some one-directional Granger causality running from actual HICP inflation to expected survey inflation, although the sample period is short. Also, behavior in different inflation regimes differs a bit from the ECCCS data.
When we examine the relationship between actual inflation and the survey values (Figures 3 and 4), the prime observation is that relationship between actual, perceived and expected inflation is highly dispersed across countries and over time, and it is far from a stable linear mapping.
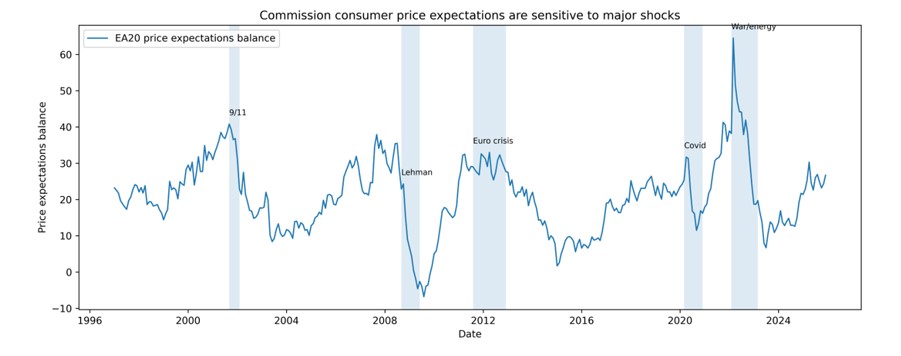
The relationship between expected inflation values for the ECCCS and CES data appears also to be very weak, almost nonexistent. Moreover, we find that the relationship between current inflation (both actual and perceived) is far from linear in the ECCS data. More precisely, the relationship is (inverted) L-shaped, suggesting that higher inflation does not translate one-to-one into expected inflation across all inflation levels. When inflation becomes very high, households appear to revert to the historical average as their expected value instead of relying on past observation. In other words — as suggested by Turnovsky (1969) — extraordinary price changes are not treated as reliable information. Nevertheless, large shocks clearly affect inflation expectations, even if the duration of the effect varies considerably. During the Covid-19 pandemic and the outbreak of the war in Ukraine, the impact on expectations was relatively short-lived — consistent with the short-lived peak in actual inflation (Figure 5).
Figure 3. The relationship between actual, perceived and expected inflation with the ECCCS data
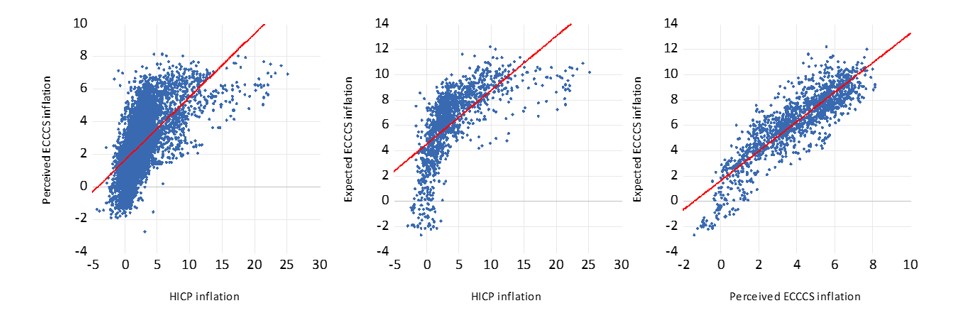
Figure 4. The relationship between actual, perceived and expected inflation with the CES data
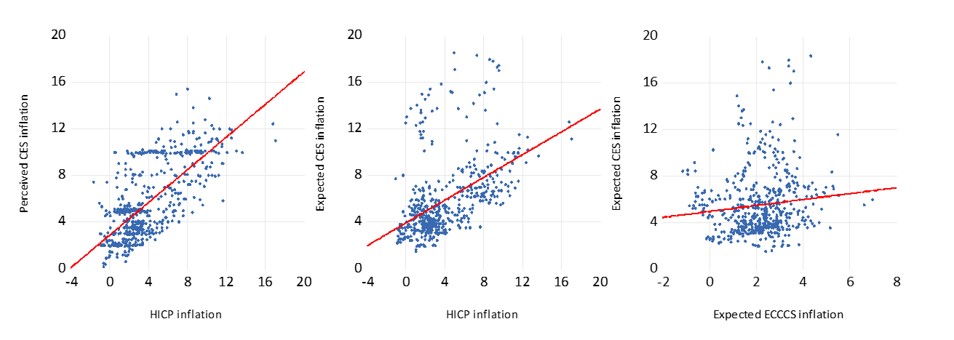
Figure 5. Effect of selected crises on changes in ECCCS inflation expectations
Everyone can freely interpret the various survey measures of inflation expectations, as is often seen in commentary following new survey releases. This makes it difficult to draw clear implications for monetary policy, since so many interpretations of changes in the inflationary environment remain possible. Although consumers’ inflation assessments are rather persistent, they do react to major shocks in the “correct” direction. We therefore cannot claim that survey information is useless. However, we have good reason to doubt that the expectations channel follows a simple time- and regime-invariant parameterized model. As firms increasingly adopt state-dependent pricing (Golosov and Lucas 2007), and as the frequency and magnitude of price changes evolve in ways that are difficult to forecast, the interpretation of survey data becomes even more challenging, at least if they are interpreted as a stable structural expectations term. And so does empirical analysis and monetary policy that is based on Phillips-curve-type behavioral equations.
Bunn, B., N. Bloom, C. Menzies, P. Mizen, G. Thwaites and I. Yotzov (2025) State- and time dependent pricing. Bank of England, Staff Working paper. No. 1166. Source: https://www.bankofengland.co.uk/-/media/boe/files/working-paper/2026/state-and-time-dependent-pricing.pdf
Calvo, G. A. (1983). Staggered prices in a utility-maximizing framework. Journal of Monetary Economics, 12(3), 383-398.
Carlson, J. and M. Parkin (1975) Inflation Expectations, Economica, 42:166, 123-38
Coibion, O., and Gorodnichenko, Y. (2015). Information rigidity and the expectations formation process: A simple framework and new facts. American Economic Review, 105(8), 2644-2678.
D’Acunto, F., Malmendier, U., Ospina, J., & Weber, M. (2021). Exposure to grocery prices and inflation expectations. Journal of Political Economy, 129(5), 1615-1639.
Friedman, M. (1968). The role of monetary policy. American Economic Review, 58(1), 1-17.
Golosov, M., and Lucas, R. E. (2007). Menu costs and Phillips curves. Journal of Political Economy, 115(2), 171-199.
Lucas, R. E. (1976). Econometric policy evaluation: A critique. Carnegie-Rochester Conference Series on Public Policy, 1, 19-46.
Turnovsky, S (1969) Bayesian Approach to the Theory of Expectations. Journal of Economic Theory 1, 220-227 (1969)
Werning, I. (2022) Expectations and the rate of inflation, NBER Working Paper 30260 https://www.nber.org/system/files/working_papers/w30260/w30260.pdf
Woodford, M. (2005) Central-Bank Communication and Policy Effectiveness.” Proceedings, Economic Policy Symposium, Federal Reserve Bank of Kansas City, August.