

This policy brief is based on the Banca d’Italia Working Paper n. 1525 “The awakening of inflation and the return of the Phillips curve in the euro area”. The views expressed in this brief are those of the authors and do not necessarily reflect the position of Banca d’Italia.
Abstract
During the 2021-22 inflation surge, euro-area firms significantly increased the frequency with which they adjusted prices. In a recent paper, we show that such change in price-setting behaviour led to a transitory steepening of the Phillips curve, which had remained persistently flat throughout the preceding low-inflation period. In a model with nominal rigidities, a higher frequency of price adjustment steepens the Phillips curve and enhances the effectiveness of monetary policy, enabling the central bank to contain cost-push shocks at a low output cost. We test these predictions using panel local projections and find robust evidence, confirming the increased effectiveness of monetary policy during the 2021-22 inflation surge.
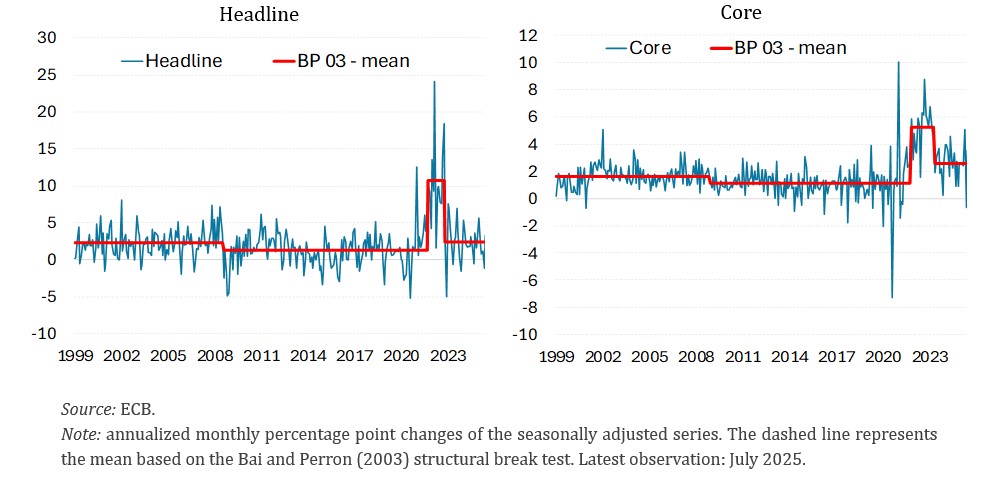
Over the past twenty-five years, the euro area has moved through several distinct inflation regimes. Prior to the Global Financial Crisis (GFC), inflation remained stable at between 2 and 3 per cent. After the crisis, a prolonged low-inflation phase set in, during which the relationship between inflation and economic slack — the Phillips curve — turned remarkably flat. This pattern reversed abruptly after the COVID-19 pandemic and the 2021-22 energy crisis, which was followed by the sharpest increase in inflation in the history of the Economic and Monetary Union, with headline inflation peaking at 10.6 per cent in October 2022 (Figure 1, blue lines).
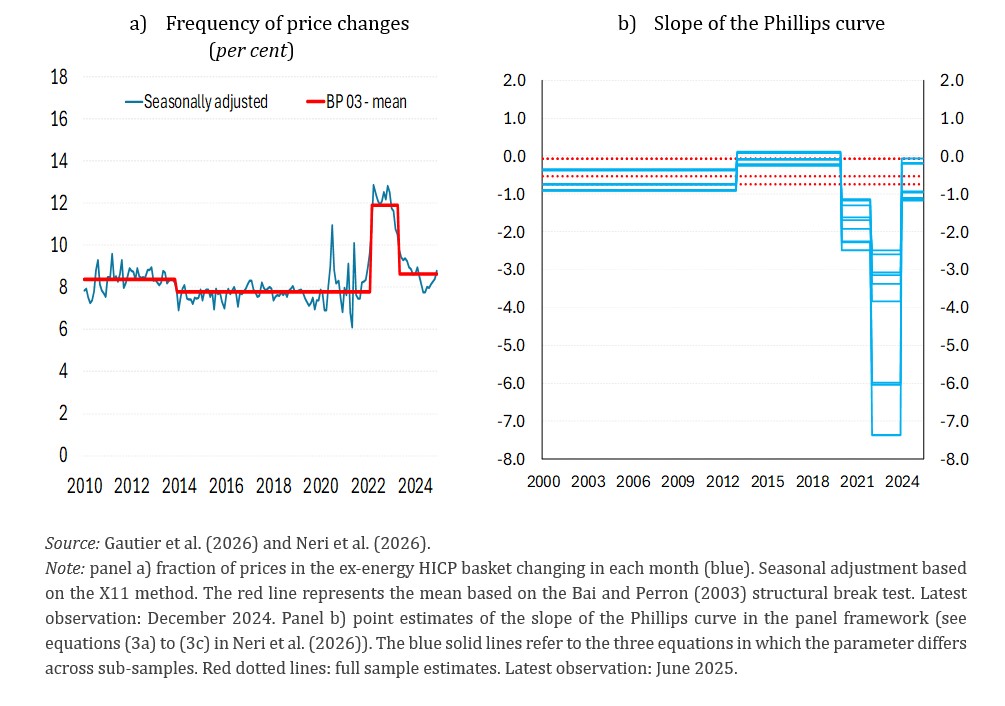
What makes this episode particularly notable is the speed of the disinflation that followed: inflation fell rapidly, with only a modest deterioration in activity and labour-market conditions. A key mechanism behind this decoupling lies in firms’ price-setting behaviour. When large cost-push shocks hit — most prominently via energy prices — firms adjusted their prices much more frequently than during normal times (Figure 2, panel a, blue line). Our recent paper (Neri et al., 2026) documents the time-variation in the slope of the Phillips curve in the euro area, relating it to the changes in the frequency of price adjustments, and tests the implications for the effectiveness of the monetary policy of the European Central Bank (ECB).
Applying a structural break methodology (Bai and Perron, 2003) to different inflation series, the paper identifies four phases (Figure 1, red lines): a pre-GFC period (1999-2008) of stable inflation around 2-3 per cent; a post-GFC low-inflation period (2008-2021) of persistently subdued inflation despite accommodative monetary policy; the energy-crisis surge (2021-22), driven by energy and supply-side bottlenecks as well as by post-pandemic reopening demand; a post-crisis normalisation (from spring 2023) in which inflation declined toward historical averages.
Figure 1. Inflation in the euro area
(annualized monthly changes; percentage points)
A central piece of evidence is the behaviour of the frequency of price changes in the euro area. Drawing on consumer price micro-data (Gautier et al., 2026), the paper shows that the average repricing frequency was stable at around 8 per cent of prices per month during the 2010-2022 period (Figure 2, panel a, red line). From March 2022, after Russia’s invasion of Ukraine, the frequency jumped by about 4 percentage points, reaching almost 12 per cent, before declining back toward previous levels from April 2023. By contrast, the average size of individual price changes moved very little as inflation rose, implying that the extensive margin — how many prices change — rather than the intensive margin — by how much each price changes — drove inflation. This evidence is consistent with state-dependent pricing models: when large shocks compress firms’ profit margins, the incentive to reprice is stronger, so more firms adjust simultaneously. As Cavallo et al. (2024) put it, “large shocks travel fast.”
The paper also provides time series and panel evidence on the time-variation in the slope of the Phillips curve in the euro area. In the panel approach, we exploit cross-country variation across the twenty euro-area countries between 2000 and 2025, which allows us to obtain precise sub-sample estimates of the slope of the Phillips curve.
Panel b in figure 2 shows the results of the panel estimation for the period before the Sovereign Debt Crisis (SDC; 2000-2012), the low-inflation period (2013-2019), the COVID-19 pandemic (2020-2021), the energy crisis (2022-2023), and the post-energy-crisis period (2024-2025). We also consider the full 2000-2025 sample.
The sub-sample estimates provide compelling evidence of time variation in the slope of the Phillips curve in the euro area. During the pre-SDC period, the slope is negative and statistically significant across specifications, suggesting a relatively stable Phillips curve in a stable macroeconomic environment. During the low-inflation period, the slope remains negative but becomes small in magnitude and, in some econometric specifications, not statistically significant, consistent with existing evidence for the euro area (Ciccarelli and Osbat, 2017 and Moretti et al., 2019).
During the pandemic, the slope steepens and becomes statistically significant, likely reflecting the strong disinflationary forces associated with the sharp collapse in aggregate demand and the rapid widening of the unemployment gap. During the 2021-22 energy crisis, the estimated slopes are large (in absolute value), suggesting the presence of non-linearities in inflation dynamics during a period of large cost-push shocks. The time-series approach yields comparable results.
After the energy crisis, the slope declines sharply. This result points to a partial reversion to a regime with a flat Phillips curve, like the one that prevailed before the GFC.
Figure 2. Frequency of price changes and the slope of the Phillips curve in the euro area
The panel estimation of the Phillips curve provides evidence of a state-dependent slope in the euro area. Inflation becomes more sensitive to the unemployment gap in periods characterised by large cost-push shocks, when firms adjust prices more frequently, consistent with recent studies linking inflation dynamics to the endogenous repricing behaviour (e.g. Blanco et al., 2024, and Cavallo et al., 2024).
Counterfactual simulations using a time series Phillips curve show that, had the repricing frequency remained at its pre-crisis average, ex-energy inflation would have been substantially lower during post-pandemic reopenings and the energy crisis. The frequency of price adjustment was a key driver of the “awakening” of the Phillips curve and “the rise of inflation”.
A New Keynesian model with endogenous repricing frequency (Gasteiger and Grimaud, 2023) can rationalise the empirical evidence. When a large positive cost-push shock hits, more firms find it optimal to adjust their prices, steepening the Phillips curve. A contractionary monetary policy shock achieves a larger disinflation when the repricing frequency is elevated, and the output cost per unit of disinflation — the sacrifice ratio — is lower during episodes of large inflationary cost-push shocks.
The mechanism originates in firms’ pricing incentives. The profit function of intermediate producers is asymmetric around the optimal reset price: setting a price above the optimum is less costly than setting it below by the same amount. Consequently, after a negative cost-push shock firms face weaker incentives to cut prices, so the share of firms adjusting prices decreases. Following a positive cost-push shock, the incentive to increase prices is stronger and many firms re-optimise, amplifying inflation dynamics.
We test the model implications for monetary policy using panel local projections for the twenty euro-area countries (Jordà, 2005; Jordà and Taylor, 2025) and the monetary policy shocks identified by Jarociński and Karadi (2020), and conditioning on short-term energy inflation as a proxy for cost-push shocks.
A contractionary monetary policy shock lowers inflation and increases the unemployment gap. The response of inflation is persistent, stabilising after 18 months, while the unemployment gap peaks after about one year before gradually reverting to zero (Figure 3, top panels). Crucially, the responses are strongly state-dependent (Figure 3, bottom panels). When energy inflation is elevated, such as in the late-2021 to early-2023 period, the disinflationary impact of monetary policy is significantly amplified, while the response of the unemployment gap is attenuated.
The findings align closely with the model’s predictions: a higher frequency of price adjustment strengthens the inflation response to monetary policy while dampening that of economic activity. As a result, during episodes of elevated cost-push pressures such as the 2021-22 energy crisis, the ECB temporarily faced a more favourable inflation-output trade-off than in normal times when implementing a tightening of its monetary policy.
Figure 3. Response of inflation and the unemployment gap to a monetary policy shock: one-sided HP filtered unemployment gap
(cumulated monthly changes; percentage points)
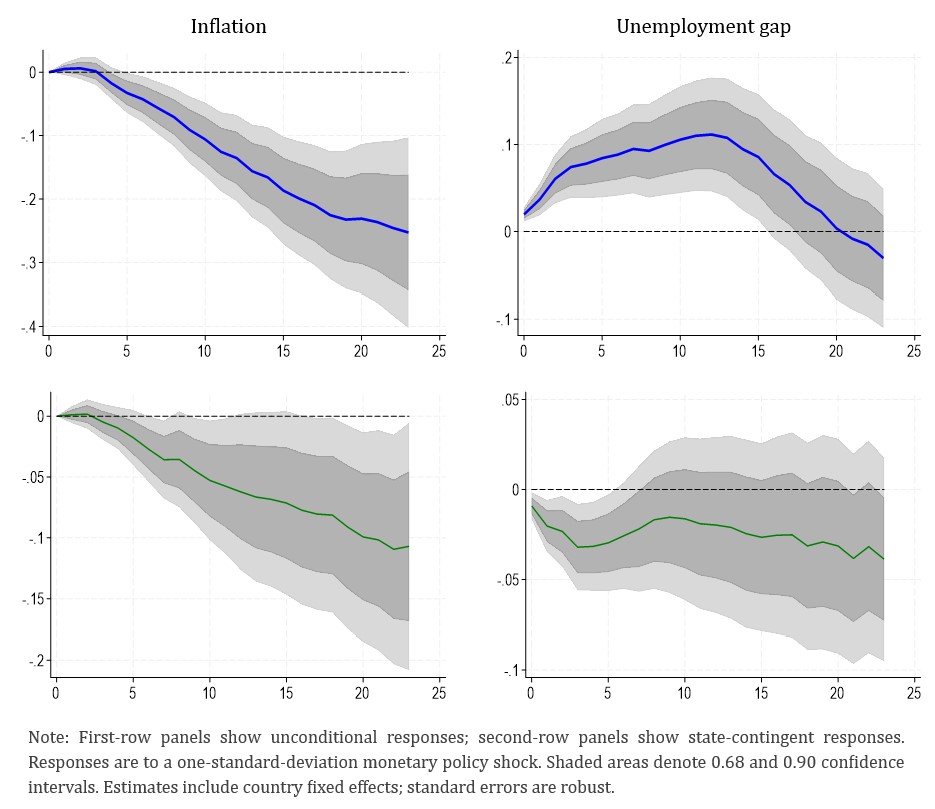
Overall, the panel local projections provide evidence that the effectiveness of monetary policy in the euro area is state-contingent. During periods of elevated cost-push pressures, a monetary policy tightening can achieve a larger disinflation at a smaller cost in terms of unemployment than during periods characterized by smaller shocks. Consistent with this evidence, the ECB’s restrictive monetary policy stance during the 2021-22 energy crisis has been particularly effective.
The results of the paper carry several important messages for central banks and for the assessment of inflation dynamics.
The slope of the inflation-unemployment relationship is state-dependent: it is steeper during episodes of large cost-push shocks, when firms adjust prices more frequently, and flatter during periods of subdued inflationary pressures. Models and policy frameworks that treat Calvo price-adjustment probabilities as fixed run the risk of mischaracterising inflation dynamics.
One of the key contributions of Neri et al. (2026) is to show that data on the frequency of price changes — derived from consumer price micro-data — contain valuable information for assessing the effectiveness of monetary policy. An increase in the repricing frequency signals a steepening of the Phillips curve: changes in economic slack translate into larger-than-usual inflation movements, and monetary policy faces a lower sacrifice ratio compared with a macroeconomic environment in which prices are reset less frequently.
The 2021-22 energy crisis triggered a marked increase in the frequency of firms’ price adjustments, which in turn steepened the Phillips curve and enhanced the effectiveness of the ECB’s monetary policy. The empirical evidence suggests that the ECB’s rapid tightening during the energy crisis was particularly effective precisely because it occurred during a period of more flexible prices.
Three lessons stand out for policymakers: (1) the Phillips curve’s slope is state-dependent and must be monitored in real time; (2) data on price-adjustment frequency provide valuable information for assessing the inflation-slack trade-off; (3) when inflation is driven by large cost-push shocks, prompt monetary policy tightening can achieve disinflation at a relatively modest output cost — but this window of opportunity closes as the frequency of price adjustment declines.
Bai, J. and P. Perron (2003). “Computation and analysis of multiple structural change models”, Journal of Applied Econometrics 18, 1-22.
Blanco, A., Boar, C., Jones, C. J., and V. Midrigan (2024). “The inflation accelerator”, National Bureau of Economic Research Working Paper 32531.
Cavallo, A., F. Lippi and K. Miyahara (2024). “Large shocks travel fast”, American Economic Review: Insights 6, 558-574.
Ciccarelli, M. and C. Osbat (2017). “Low inflation in the euro area: Causes and consequences”, European Central Bank Occasional Paper 181.
Gasteiger, E. and A. Grimaud (2023). “Price setting frequency and the Phillips curve”, European Economic Review 158, 104535.
Gautier, E. et al. (2026). “Consumer price stickiness in the euro area during an inflation surge”, ECB Working Paper No. 3181.
Jarociński, M. and P. Karadi (2020). “Deconstructing monetary policy surprises: The role of information shocks”, American Economic Journal: Macroeconomics 12, 1-43.
Jordà, Ò. (2005). “Estimation and inference of impulse responses by local projections”, American Economic Review 95, 161-182.
Jordà, Ò. and A.M. Taylor (2025). “Local projections”, Journal of Economic Literature 63, 59-110.
Moretti, L., L. Onorante and S. Zakipour Saber (2019). “Phillips curves in the euro area”, European Central Bank Working Paper 2295.
Neri, S., C. Conflitti and A. Lin (2026). “The awakening of inflation and the return of the Phillips curve in the euro area”, Banca d’Italia Working Paper 1525.