

The author thanks Dr Dionysios Lalountas for comments and constructive discussions on an earlier version. The views expressed are those of the author and do not necessarily reflect those of the affiliated institutions. There are no conflicts of interest or funding related to this brief.
Abstract
Tourism receipts are about 9% of Greek GDP and cover more than half of the goods-trade deficit, so instability next door is a macro-financial question for Greece. A monthly recursive structural VAR for 2010–2026, using the Caldara–Iacoviello country indices of geopolitical risk (GPR), shows that a one-standard-deviation rise in Turkey’s GPR lowers the annual growth of real tourism receipts by about 3.6 percentage points four to five months later. A shock to Egypt’s GPR has a similar effect; Israel’s does not last. Global industrial activity remains the largest external driver of receipts. A methodological result matters as much. Estimated without controls for the 2020–22 pandemic months, the same model more than triples the geopolitical effect and gives oil prices the wrong sign. Scaled to the July 2016 coup attempt in Turkey, the pandemic-robust model implies a trough of about −12% in receipts growth five months after the event.
Travel receipts have been about 9% of Greek GDP in each of the last three years, up from 5% before the sovereign debt crisis, and they now cover more than half of the deficit in goods trade. They are also VAT-bearing, so a bad season is a fiscal as well as an external event, and a question for the ministry of economy and finance and the central bank, not only for the industry.
Greece sits in one of the most geopolitically active corners of Europe. Its three largest eastern-Mediterranean neighbours, Turkey, Egypt and Israel, are in different ways competitors for the same European holidaymakers or sources of headline risk for the whole region. The literature finds that geopolitical risk depresses tourism in general (Hailemariam and Ivanovski, 2021; Papagianni et al., 2024), and recent SUERF contributions have examined how geopolitical shocks propagate to activity, inflation and oil prices (Brignone et al., 2024) and how structural geopolitical vulnerability can be measured ahead of events (Jiménez et al., 2026). What is missing is an estimate of the spillover from a neighbour’s instability to a destination country’s receipts.
This brief asks how much, and with what lag, a rise in geopolitical risk in Turkey, Egypt or Israel moves Greek tourism receipts, and how far the answer depends on the treatment of the 2020–22 pandemic months, a choice that monthly tourism models cannot avoid.
Figure 1. Response of real tourism receipts (12-month growth, percentage points) to a one-standard-deviation
shock to Turkey’s GPR, with and without pandemic controls; 90% bootstrap bands
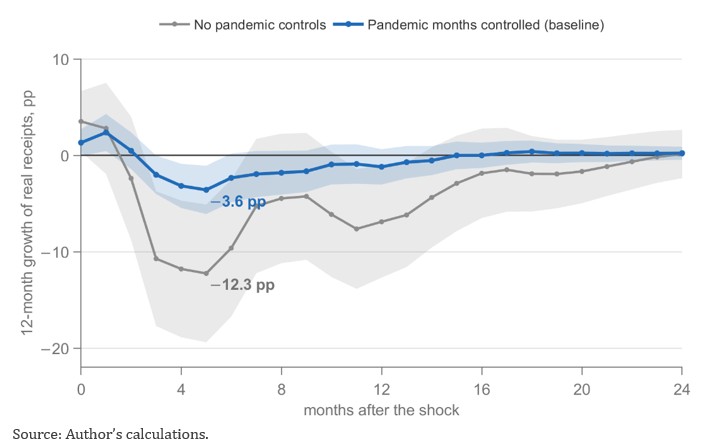
The baseline model controls for the 2020–22 pandemic months with monthly dummies; data and identification are set out at the end of the brief. A one-standard-deviation shock raises Turkey’s GPR index by about 40% within the month. The response of Greek receipts has two phases (Figure 1, blue). In the first month receipts growth rises by about 2.4 percentage points, consistent with some travellers redirecting bookings from Turkey to Greece. From the third month the sign turns, and the effect bottoms at −3.6 points in the fifth month, with a 90% band of −6.1 to −1.1, before fading within a year. The lag matches the booking cycle, since packages booked three to five months ahead are cancelled or not made and the shortfall arrives with the season.
Turkey is not alone. A shock of the same size to Egypt’s GPR lowers receipts growth by 3.2 points in month five (band −5.6 to −0.7; not shown), with a significant response from month four to month seven. Israel’s index produces no sustained response (not shown; the band excludes zero in month four alone, at −2 points, and the effect reverses the next month), consistent with a tourism profile (religious and cultural travel) that competes little with Greece.
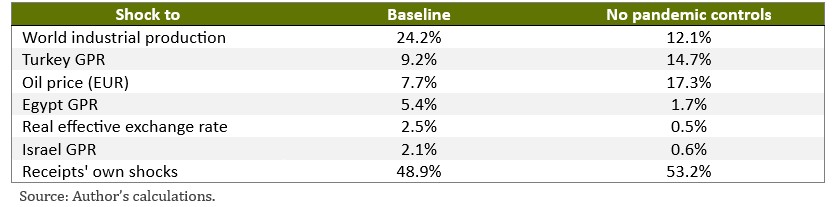
Global conditions still matter more than any single neighbour. A one-standard-deviation rise in world industrial production raises receipts growth by 7 points in month five (the positive response significant in months four to seven; not shown) and explains the largest share of forecast-error variance at two years of any shock other than receipts’ own (Table 1). Together, the two neighbours’ GPR shocks explain about 15% of that variance, more than oil.
Table 1. Share of the forecast-error variance of 12-month receipts growth at a 24-month horizon
The same model estimated without any treatment of 2020–22 tells a different and, on inspection, wrong story. The Turkey response more than triples, to −12.3 points at month five, and is still significantly negative a year later, in months eleven to thirteen (Figure 1, grey). Oil prices acquire a large positive effect, with a one-standard-deviation rise in the real euro oil price raising receipts growth by 17 points after two months (Figure 2, grey), a result one is tempted to rationalise as substitution away from long-haul destinations. With pandemic controls the sign reverses to the expected one, as dearer oil lowers receipts growth by 4 points in month five (band −6.4 to −1.5) and the effect is gone within eight months.
Figure 2. Response of real tourism receipts to a one-standard-deviation shock to the real euro oil price
(Brent, deflated by euro-area HICP), with and without pandemic controls. 90% bootstrap bands
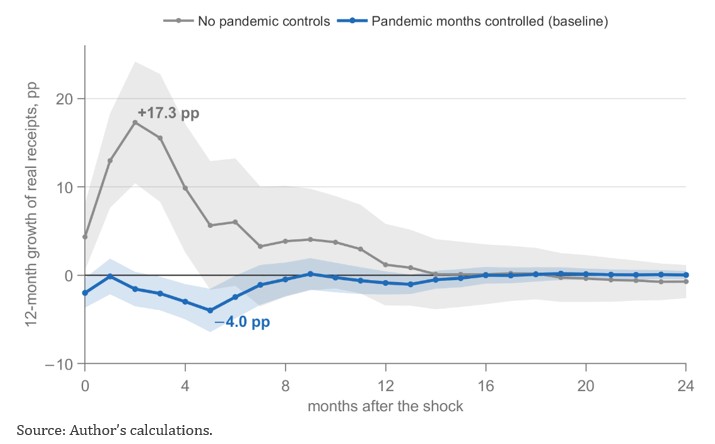
The mechanism is mechanical rather than economic. Turkey’s GPR index was well above its average in January and February 2020, amid the Idlib escalation and Turkey’s military deployment to Libya, and three to five months later Greek receipts fell by more than 90% under lockdown. Oil collapsed in the same weeks. A linear model reads this as a very large, lagged response of receipts to geopolitical risk and a positive co-movement with oil. In 2021 the pattern reverses through the twelve-month base, as receipts growth is enormous against the lockdown months while neighbourhood risk is low, again a spurious negative relationship. The residual standard deviation of the receipts equation falls from 0.26 to 0.12 with the dummies, and to 0.08 in a sample ending in February 2020, so the pandemic triples the noise in precisely the equation of interest.
The choice of window matters in one direction only. A narrower set of dummies ending in June 2021 gives a Turkey trough of −5.9 points and keeps the oil response negative at −3.7 points; a sample ending in February 2020 gives point estimates of the same sign (a Turkey trough of −3.1 points, in month six) but, with 104 observations, no significance. Across the specifications with pandemic controls (both dummy windows, lag lengths from four to nine, oil priced in dollars, and orderings with the global variables first or with Egypt and Israel before Turkey), the Turkey trough lies between −2.2 and −5.9 points, always in the fifth month; the oil response is negative in every case, between −2.5 and −4.8 points. The lesson, which echoes the broader post-2020 VAR literature (Lenza and Primiceri, 2022), is that in a monthly tourism model a handful of pandemic observations can dominate the estimated dynamics of every other shock.
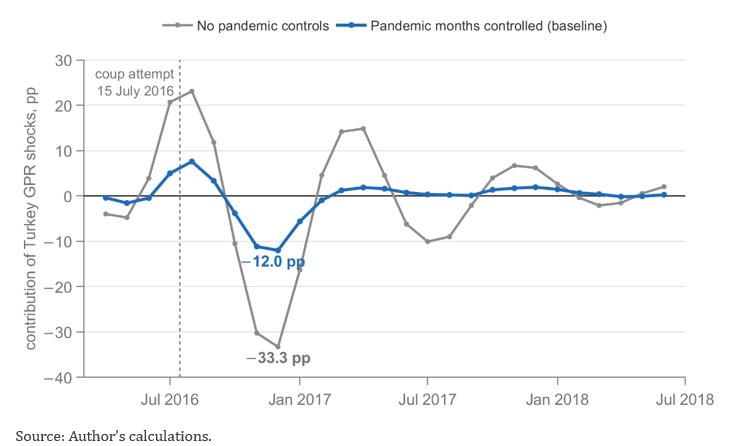
A standard-deviation shock is an abstract unit, so it helps to scale the result to an event readers remember. The failed coup of July 2016 is one of the spikes Caldara and Iacoviello (2022) label in their daily GPR index, and it was followed by two years of emergency rule. In the baseline model the identified GPR shock for July 2016 is 1.9 standard deviations, with further positive shocks in June, August and September and sharp de-escalation shocks in October and November.
Passing the whole sequence through the impulse responses gives the contribution of Turkish geopolitical risk to Greek receipts month by month (Figure 3). Receipts growth first gains about 5 to 8 points in July and August, the substitution window, and then loses ground from October, with a trough of −12 points in December 2016, five months after the coup. The model without pandemic controls puts the same trough at −33 points. On today’s receipts of roughly €24 billion a year, a 12% shortfall sustained over a season would be worth about €2.8 billion, an upper bound since the trough is a monthly peak rather than a seasonal average.
Figure 3. Contribution of the identified Turkey GPR shocks of April–November 2016 to receipts growth
(historical decomposition), with and without pandemic controls.
Neighbourhood GPR indices are a usable early-warning input for the tourism season. The three-to-five-month lag between a rise in Turkey’s or Egypt’s index and the shortfall in receipts is long enough to act on, since a spring escalation shows up in the summer receipts, which are the bulk of the year’s. The indices are public and monthly and can enter the forecasting round behind the budget and the external-balance projections at no data cost.
The unit of risk is the neighbourhood, not a single competitor. The Egypt effect is of the same size as Turkey’s; Israel’s is negligible. A framework built around Turkey alone, as the question is usually framed in Greece, would miss about a third of the identifiable effect. The practical implication is a composite of the two indices.
The magnitudes are modest and short-lived, and policy should be sized accordingly. A one-standard-deviation shock is worth roughly 2 to 4 points of receipts growth for a few months in the baseline estimates, and even a 2016-sized episode nets out to about −12 points at its trough. That is a material but not a crisis-level number for a sector that has grown by between 5% and 17% a year since 2023; it argues for targeted, short-horizon marketing in the substitution window and for reserves in the fiscal forecast, not for structural reorientation.
Do not read a positive oil effect into tourism models that include the pandemic. The naive model’s finding that dearer energy helps Greek tourism, attractive substitution story and all, does not survive pandemic controls. Models estimated on monthly tourism data through 2020–22 should treat those months explicitly, following Lenza and Primiceri (2022), before any coefficient on energy, exchange rates or global activity is interpreted.
The model uses monthly data from January 2010 to March 2026, giving 177 observations after lags and the seasonal transformation. Geopolitical risk is measured by the country-specific GPR indices of Caldara and Iacoviello (2022), which count newspaper coverage of wars, terrorism and inter-state tensions involving each country; there is no index for Greece itself, so neighbouring risk is the exogenous source of shocks. Real tourism receipts come from the Bank of Greece, deflated by Greek CPI; the real Brent price is converted to euros and deflated by euro-area HICP; world industrial production is from the CPB World Trade Monitor (CPB Netherlands Bureau for Economic Policy Analysis); the real effective exchange rate (REER) is from the Bank of Greece. Receipts enter as the 12-month log difference, which removes the seasonal cycle more cleanly than monthly dummies.
Identification is recursive. The three GPR indices are ordered first, on the standard assumption that geopolitical events are not driven within the month by Greek tourism or by oil and activity; oil, world activity and the REER follow; receipts come last and react to everything. The baseline uses six lags, long enough to span the booking cycle; the information criteria disagree (AIC twelve, Schwarz one), the results are unchanged for any lag length from four to nine, and three lags, too few for a response that peaks in month five, flatten the Turkey effect without changing its sign. LM tests leave some autocorrelation that more lags do not remove, most persistently at the third lag. Bands are bootstrapped (500 replications) at the 90% level.
The pandemic is handled explicitly. The baseline includes a dummy for each month from March 2020 to February 2022. The window runs twelve months past the acute phase on purpose, because with receipts measured against the same month a year earlier the 2021 rebound is as much a pandemic observation as the 2020 collapse. Two alternatives frame the result. The first has no pandemic controls, which is what a naive estimation delivers; the second uses a narrower window ending in June 2021. With air arrivals in place of receipts the Turkey trough is −2.2 points in the same month, smaller than for receipts, which suggests that neighbourhood risk weighs more on spending per trip than on the number of trips; the oil response stays negative (−3.1).
The recursive identification treats neighbourhood GPR as exogenous within the month, standard for news-based indices but excluding same-month feedback from Greek tourism to regional risk. And the pandemic dummies remove the 2020–22 observations from the dynamics rather than modelling them; alternatives such as volatility scaling may give somewhat different magnitudes, though sign and timing hold in every specification tried.
Brignone, D., Gambetti, L. and Ricci, M. (2024), “Geopolitical risk shocks: when size matters”, SUERF Policy Brief No. 994, October.
Caldara, D. and Iacoviello, M. (2022), “Measuring geopolitical risk”, American Economic Review, 112(4), 1194–1225.
Hailemariam, A. and Ivanovski, K. (2021), “The impact of geopolitical risk on tourism”, Current Issues in Tourism, 24(22), 3134–3140.
Jiménez, M., Sarasa-Flores, D. and Ugarte-Ruiz, A. (2026), “Assessing structural geopolitical risk”, SUERF Policy Brief No. 1522, July.
Lenza, M. and Primiceri, G. E. (2022), “How to estimate a vector autoregression after March 2020”, Journal of Applied Econometrics, 37(4), 688–699.
Papagianni, E., Evgenidis, A., Tsagkanos, A. and Megalooikonomou, V. (2024), “Tourism demand in the face of geopolitical risk: insights from a cross-country analysis”, Journal of Travel Research, 63(8), 2094–2119.