

The views expressed here are those of the authors and do not necessarily represent the views of De Nederlandsche Bank. The authors would like to thank Marcel Warnaar, Jasja Bos and Guus Wieman of the National Institute for Family Finance Information (Nibud) for their work on household budgets, and other colleagues from De Nederlandsche Bank for their valuable feedback.
Abstract
We construct a new price index for necessary expenses at a social subsistence level — the Primary Livelihood Index (PLI) — using detailed household reference budgets from the Dutch National Institute for Family Finance Information (Nibud). The PLI enables a direct comparison of inflation of basic necessities with the Harmonised Index of Consumer Prices (HICP). Between 2014 and 2021, PLI inflation exceeded HICP inflation, primarily due to the larger share of housing costs in the PLI. Following the demand shocks of 2021 and the subsequent energy crisis, HICP inflation outpaced PLI inflation, driven by differences in the composition and weighting of services inflation. From August 2024 onward, PLI inflation again surpassed HICP inflation, largely reflecting the share of housing expenditures.
Commonly used inflation indicators, such as the Harmonised Index of Consumer Prices (HICP), provide insight into price changes for a representative basket of goods and services. However, these indicators obscure consumption differences between income groups: households with different income levels spend their money differently, meaning that actual inflation can vary across households. Lower income households spend a larger share of their income on basic necessities. Recent periods of increased levels of inflation raise the question whether prices of basic necessities have increased at a different pace than average price increases, signalling a higher level of inflation for lower income households. In order to assess this, we construct a Primary Livelihood Index (PLI), in order to compare inflation of basic necessities to the HICP.
There is no clear consensus in the literature on differences in inflation between different types of households. The differences in inflation depend on the research period, the source of inflation and the constructed price index. The Central Bank of Malta shows that, for the period 2010-2020, energy and food inflation led to relatively higher inflation for low income households (Darmanin; 2021), while Morrow (1986) demonstrates that, depending on the aggregation of indices, the measure of housing costs, and the choice of base year, inflation for low income households can turn out either higher or lower than average inflation.
The Dutch National Institute for Family Finance Information (Nibud) constructs household reference budgets for different types of model households at a ‘social subsistence level’. These reference budgets are based on research into expenditures and prices, participant groups of relevant households and prior expertise of the Nibud (CBS, Nibud & SCP; 2023). These reference budgets give a representation of the basic necessities at the social subsistence level. Apart from necessary expenses, they include a small budget to participate in society, such as an internet- and television subscription, a sports club and personal hygiene products. However, they are not a representative consumption basket for low income households per se, as consumption goods such as pets and tobacco are excluded. Table 1 presents these budgets for a selection of household types.
Table 1. Reference budgets for households at a social subsistence level
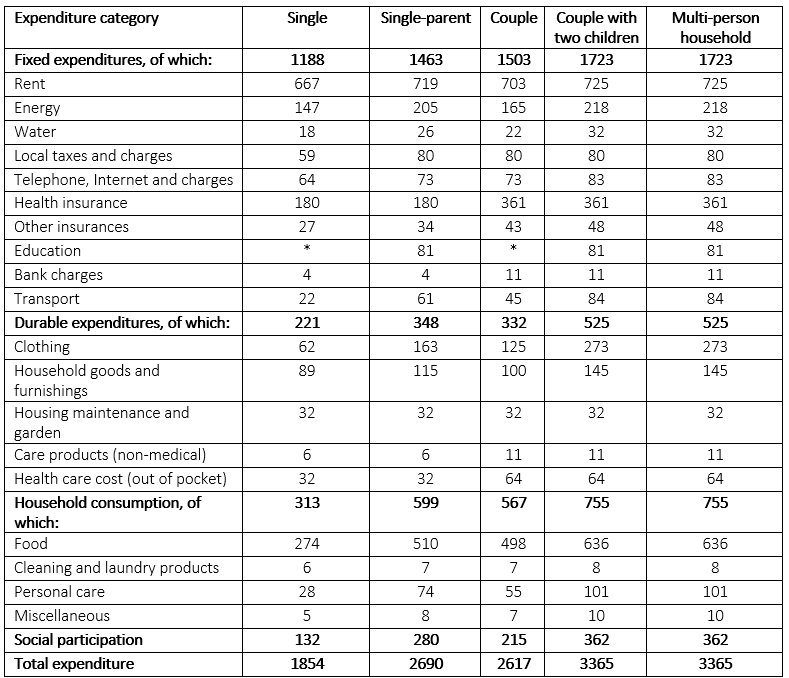
Note: all numbers are in 2026 euros.
We allocate the expenditure categories in these budgets to COICOP categories. Where necessary, the Nibud has categorised the expenditures based on prior knowledge of expenditure of low income households. For example, instead of the category ‘purchase of new cars’, the travel expenses consist of the categories ‘second hand cars’, ‘public transport’ and ‘bicycle’. Allocating these expenditures to COICOP allows us to use the Narrow Inflation Projection Exercise (NIPE) to calculate inflation rates for the PLI.
The PLI inflation is based on a weighted average of the household types living on social subsistence budgets. In 2024 roughly 6% of Dutch households were on or below this budget. The population at social subsistence level consists of 70% of single person households, 10% single parent households, 12% couples with children, 6% couples without children and 1% other households. For single parent and couples with children we assume two children in the age of 13 and 8 years old as this best reflects household sizes in the Netherlands. Using this composition of the households at the social subsistence level, we create one basket of basic necessities on which the PLI is based.
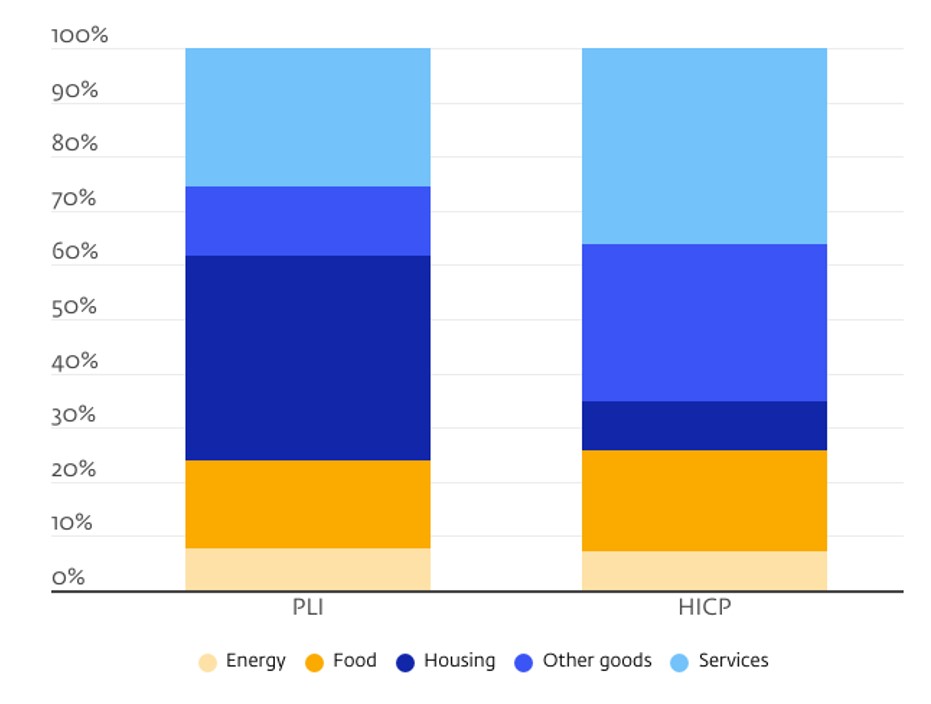
Figure 1 shows that the largest differences between the consumption baskets of the HICP and the PLI are in housing costs and other goods. 40.9% of the PLI basket consists of housing related expenses (including rent), while for the HICP this is 8.9%. In addition, the share of services is 12.9% in the PLI versus 38.1% in the HICP. For the category other goods, this is 19.2% for the PLI, while in the HICP other goods have a weighting of 29%.
Figure 1. Consumption baskets for PLI and HICP
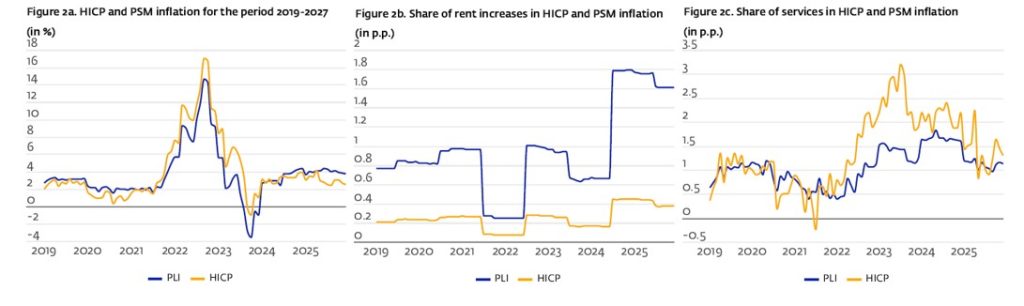
Before the demand shocks of Covid and the energy crisis following the Russian invasion of Ukraine, the PLI inflation was somewhat higher than the HICP inflation. Between 2014 and the summer of 2021, the PLI inflation was 1.7% on average, while for the HICP this was 1.1%. However, during the inflation peak of 2021-2023 the HICP inflation was higher than the PLI inflation. The average PLI inflation between August 2021 and August 2023 was 6.3% while the HICP inflation was 8.4% on average for that period. This points towards the fact that higher inflation does not by definition mean disproportionally higher inflation at a social subsistence level. This is however not to say that the impact of inflation on lower income households is not larger. Households at the social subsistence level typically have less financial buffers and their ability to substitute to cheaper goods and services is most likely smaller.
The differences in inflation between 2014 and 2021 are predominantly due to the share spent on housing. This share is substantially higher for the PLI than it is for the HICP. This explains the largest share of the difference between the PLI and HICP inflation between 2014-2021 (see figure 2). In the Netherlands, the rent increase of the social housing sector (roughly 30% of the housing stock) is set on July 1st, explaining the shocks in figure 2b. In July 2021 the rents were temporarily frozen, while in July 2024 the rents were increased with 5.8%.
In the summer of 2021 inflation rapidly increased, due to supply shocks in the context of the Covid pandemic, and subsequently the increasing energy prices after the Russian invasion of Ukraine. This led to a larger increase in the HICP inflation than in the PLI inflation, due to the composition of the services inflation, as can be seen in figure 2c. Throughout the period between August 2021 and the end of 2024 the HICP was higher than the PLI inflation. From mid 2024 onwards, the PLI inflation overtakes the HICP inflation, again because of the increase in rents.
Figure 2. Inflation figures for the HICP and PLI, for total expenditures (2a), housing (2b) and services (2c)
The impact of inflation may be felt more strongly by lower income households due the lack of financial buffers and less possibilities to substitute consumption to cheaper alternatives. However, as we show in this analysis, periods of high inflation may in fact lead HICP inflation to be higher than the inflation of basic necessities. This result largely depends on the source of the inflation and weighting of products within the consumption basket.
CBS, Nibud, SCP (2024) De nieuwe methode om armoede in Nederland te meten. Centraal Bureau voor de Statistiek, Nibud & Sociaal en Cultureel Planbureau
CPB (2026) De economische impact van hogere energieprijzen door de Iranoorlog. Centraal Planbureau.
Darmanin, J. (2021) The inflation experience of low income households (No. PP/01/2021). Central Bank of Malta.
Morrow, A. M. (1986) The Measurement of Inflation Experienced by the Poor, 1970-80. Canadian Public Policy/Analyse de Politiques, 245-252.