

This note is based on ESRB Working Paper No. 155 (Aliman et al., 2026). The views expressed are those of the authors.
Abstract
The commercial real estate (CRE) sector poses risks to financial stability, yet its financing structures remain poorly understood due to complex corporate group structures and data limitations. This note examines the financing networks of the 100 largest CRE groups in the euro area, constructing two networks: one for bank loans and one for corporate bonds. The loan network exhibits strong regional clustering and a pronounced home bias. Regional differences in loan financing patterns create geographically concentrated communities of CRE entities with similar characteristics. In contrast, the bond network exhibits greater interconnectedness, minimal home bias, and access to a more diversified investor base. We assess the financial stability implications by analysing the structural properties of the network and identifying important participants.
The commercial real estate (CRE) sector is important for financial stability in the euro area, mainly due to its size and high degree of interconnectedness with the financial system. Historically, the accumulation of risks in the CRE sector has been a notable driver of several financial crises (ESRB, 2015).
When interest rates surged in late 2022, vulnerabilities in the sector reemerged. These were compounded by weaker economic growth and structural challenges such as the shift to remote work. Taken altogether, this prompted the need for policy responses. In January 2023, the ESRB released a report on CRE vulnerabilities (ESRB, 2023) and a Recommendation urging EU and national authorities to enhance systemic risk monitoring, promote sound financing, strengthen institutional resilience, and develop a consistent macroprudential framework.1
Several studies have assessed the overall structure of the CRE sector, including its owners and lenders. Daly et al. (2024) provide a comprehensive macro-network analysis of the sector, examining ownership of physical CRE assets in the euro area and the institutions financing these owners. Their findings indicate that CRE companies are the largest asset owners in the euro area, followed by real estate investment funds and trusts, with euro area banks providing the majority of financing. Additionally, EBA (2024) and ESMA (2024) have published country-level data on CRE exposures, showing how much banks lend to the sector in each country. However, these studies do not reveal which borrower groups are funded or which lenders share exposures to the same borrowers.
Given the sector’s complex financing structures, a bottom-up approach could help identify which lenders are exposed to specific companies and through which instruments, thereby allowing for the identification of risks and potential contagion channels. The need for such an approach is underscored by the insolvency of Signa. This case highlighted the challenges that complex group structures can pose for tracing lenders and their exposures, emphasising the importance of more granular analysis.
In this note we use microdata on loans and bonds, and apply network theory when studying the CRE sector in the euro area. Network analysis has emerged as a prominent framework for studying interconnectedness in financial markets since the Global Financial Crisis (GFC), when institutional interlinkages were central to crisis propagation and contagion. In recent years the literature linking network structure to systemic risk and stability has expanded significantly, as surveyed by Iori and Mantegna (2018), Neveu (2018) and Jackson and Pernoud (2021), with a specific focus on resilience to shocks within financial networks.
Several studies construct financial networks to analyse interconnections across the euro area. Andersen and Sánchez-Serrano (2024) develop a macro-network of the euro area financial system, highlighting its predominantly bank-centric structure prior to the GFC and the increasing role of investment funds, government debt and central banks thereafter. Sánchez-Serrano (2025) extends this framework with more granular data also to incorporate international investment positions and to capture cross-border relationships. Castrén and Rancan (2015) show that a more central position of the banking sector heightens the likelihood of banking crises.
The main contributions of this note are: i) using a pan-euro area dataset to reflect the cross-border nature of financial systems, ii) focusing on the CRE sector to capture sector-specific features, iii) analysing loan and bond networks, highlighting key differences, and iv) combining a 2023 network snapshot with a three-year analysis during a period of significant shocks impacting the sector. Each financing channel carries distinct implications for how stress may propagate through the financial system. The network perspective allows us to identify areas where risk concentrations emerge that are not visible in aggregate exposure data.
To gain a granular understanding of how CRE firms are financed we focus on a subset of 100 of the largest CRE groups in the euro area, including both listed and non-listed firms. The size of a CRE group is measured by total assets, encompassing investment properties, joint ventures, and equity stakes in listed companies. This micro-data approach ensures that important differences and variations within the sector are captured, rather than being obscured by aggregated sector-level data. The selection process combines multiple data sources. The 100 largest euro area CRE groups are identified using the S&P Capital IQ database. This list is then cross-checked against the European Public Real Estate Association (EPRA) database for listed real estate firms and Moody’s database of rated real estate companies. For data confidentiality reasons we do not disclose specific company names.
The 100 groups comprise around 2,000 legal entities, whose structures must be reconstructed before any financing relationship can be traced at group level. We do this using GLEIF and Orbis shareholding data, verified against the ECB’s Register of Institutions and Affiliates, and match the resulting entity identifiers to AnaCredit for bank loans and to the Centralised Securities Database (CSDB) and Securities Holdings Statistics (SHSS) for bonds. Size, ownership structure and business purpose are key indicators of a CRE group’s risk to the financial system. Groups owned by municipalities or other public entities tend to operate more conservatively, backed by stronger financial support to manage refinancing or raising equity. Similarly, groups focusing on providing social housing are considered lower risk, as they prioritise capped rents over profit maximisation.
This note focuses on CRE groups that are privately owned, profit-maximising, and independently operating within the euro area, as these firms typically engage in letting, buying, or developing properties with higher leverage.2 From a financial stability perspective, these groups are likely to have the largest impact, as they represent a significant share of euro area CRE companies, covering approximately a quarter of investable CRE in the region. Germany accounts for the most significant share of total CRE assets, followed by France (Figure 1a).
Figure 1. Sample size and credit risk developments
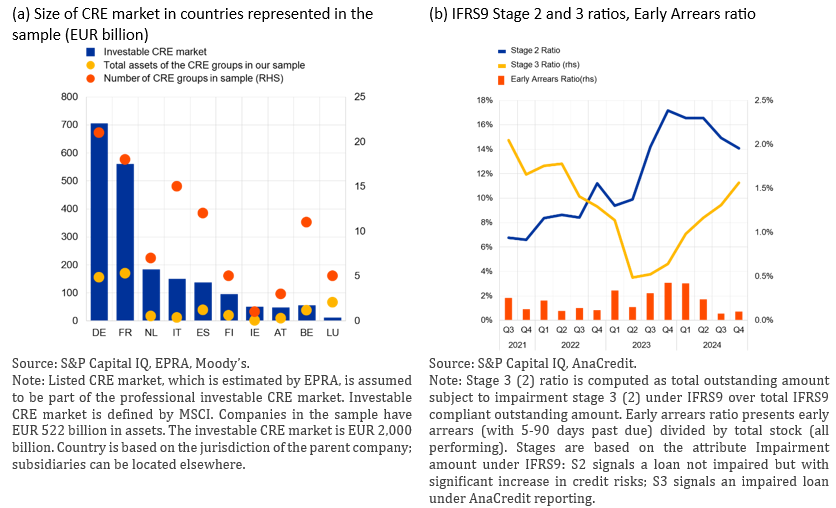
The 2023 downturn in the euro area CRE market, driven by the sharp decline in property prices and a steep rise in interest rates eroded collateral values and tightened financing conditions, placing CRE companies under financial strain. The largest listed CRE groups experienced declining earnings and rising leverage ratios, partly due to falling property values. While these changes remain moderate, the upward trend in leverage ratios highlights increased vulnerability to adverse economic conditions, particularly during the period of monetary policy tightening. Overall, this environment drew attention to risks associated with declining property values, higher borrowing costs, and weaker debt servicing capacity.
During this episode, market rates and credit spreads rose sharply, leading to significantly higher bond yields for many CRE groups. This led to reduced issuance, underscoring the corporate bond market’s sensitivity to changing financial conditions. In bank lending firms increasingly prioritised financing operational needs over investing in new properties. Consequently, real estate and construction lending experienced volatile growth between 2021 and 2023, before declining in 2024. Credit risk among CRE companies changed markedly over the period. The ratio of stage 2 loans steeply increased in the third and fourth quarters of 2023 before easing slightly thereafter, while the ratio of stage 3 loans began to rise from historically low levels in the third quarter of 2023. Early arrears, despite some volatility, broadly followed these trends (Figure 1b).
This note maps who finances the 100 largest CRE groups in the euro area, distinguishing between bank loans and bonds. Financing relationships are represented as networks with two types of participants: lenders or investors on one side and CRE groups on the other. Each participant is shown as a symbol, and a line connects a lender or investor to a CRE group whenever there is an active financing relationship at the end of 2023.3
Figure 2 shows the network of bank loans, based on the euro area credit register AnaCredit. Banks are grouped by size and shown as circles (large), squares (medium-sized) or hexagons (small), while CRE groups are shown as diamonds. Symbols are coloured according to the country of the top shareholder, and their size is proportional to the total volume of loans extended or received. Participants that are strongly connected through loans are placed close to each other.
The network is visibly dominated by German entities, with German CRE groups and large German banks occupying central positions and maintaining the strongest lending connections. Banks from France, Italy, Spain, the Netherlands and Belgium also occupy central positions and lend to many euro area CRE groups.
Lending relationships tend to be grouped by region, indicating that banks are more likely to lend to CRE groups headquartered in their own country. This “home bias” likely reflects local banking relationships, the use of properties as collateral and lower transaction costs when lenders and properties are geographically close. Nevertheless, with one exception, all banks and CRE groups are linked, directly or indirectly, showing that cross-border lending relationships also matter.
Figure 2. Network representation of bank loans to the largest euro area CRE groups, end-2023
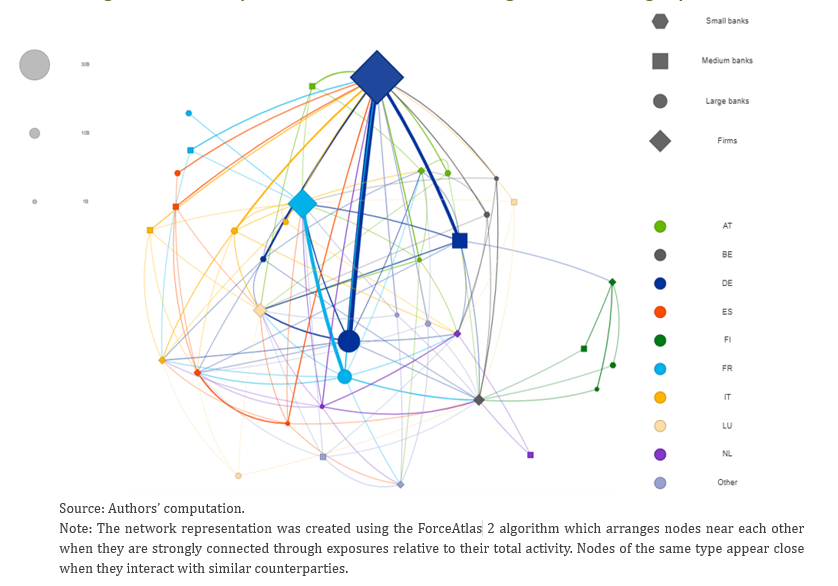
The network also reveals a core and a periphery: large and medium-sized banks cluster near the centre, while small banks sit at the edges with fewer and thinner connections. Counting all subsidiaries of a group together, the average CRE group borrows from about 16 banks, while the average bank lends to 3 of the 100 groups. This may reflect both how CRE groups grow, acquiring property companies that keep their existing lenders, and the fact that banks typically finance specific projects. Once loan amounts are taken into account, however, most of the lending is concentrated among a small number of larger banks.
In Germany, Austria and Luxembourg, CRE groups tend to borrow smaller amounts from a broader set of banks, while in other countries they rely on larger loans from fewer lenders. Groups based in Luxembourg are more likely to borrow from foreign banks. A few CRE groups, notably three large German ones, borrow from a very large number of banks and so act as hubs linking different parts of the network. Stress affecting these highly connected and potentially systemic groups could disrupt connections across different parts of the network. Such a structure is typically robust to the failure of small participants but vulnerable to problems affecting central hubs.
Regional differences become clearer when CRE groups are sorted into “communities” according to the lenders they share. Five communities emerge with pronounced regional patterns. The largest and most connected consists mainly of German, Austrian and Luxembourg groups, the second of groups from Belgium, France, Italy and the Netherlands, and a third, more sparsely connected, of Spanish and French groups. The remaining two are each concentrated in a single country, one being entirely Finnish and the other almost entirely Italian.
Communities mostly bring together neighbouring countries, since CRE involves physical operations, such as construction and maintenance, for which cross-border financing is costly. The boundaries between communities are not strong, however several banks lend across communities, and some groups secure financing in multiple markets likely reflecting the location of their property portfolios.
In France, the Netherlands and Belgium, the typical bank lends to more than five of the CRE groups, whereas in Germany, Italy, Luxembourg, Spain and Austria it lends to fewer, although these countries also have a few specialised CRE lenders that finance a wider range of CRE groups. The most influential lenders are also the biggest, they finance several CRE groups and act as bridges between different parts of the network. At the other end, many banks with small CRE portfolios finance only a few CRE groups, often just one. Some banks are important not because they lend to many borrowers, but because they lend to a few very influential ones.
To see how banks are linked to each other through the CRE groups they finance, we connect two banks whenever they lend to the same CRE group and reduce this network to its “backbone”: a simplified map that keeps only the strongest links needed to connect all banks. When links reflect the size of loans to common borrowers (Figure 3a), banks with the largest CRE portfolios become central. Most banks connect to a single German bank forming a large central hub, alongside three smaller German hubs and two Austrian ones. When links instead reflect how similar two banks’ sets of borrowers are (Figure 3b), the map is much more dispersed, with nine smaller hubs, showing that few banks have similar CRE portfolios.
Figure 3. Backbone of the bank network
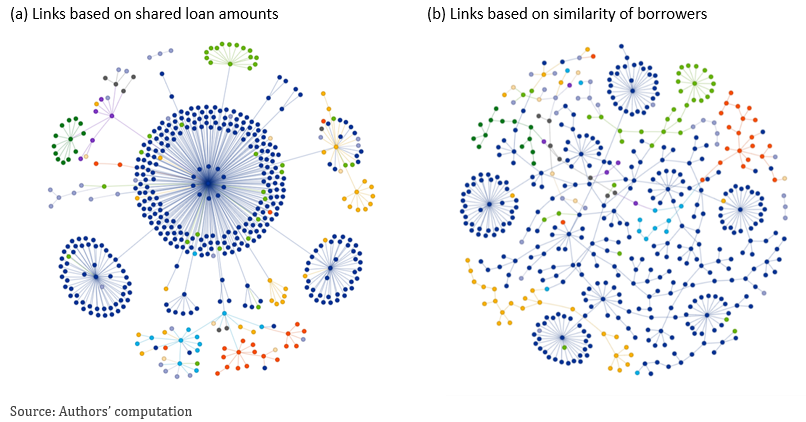
The two maps highlight different banks. Banks at the centre of the first map provide the largest loans, so their failure could leave financing gaps that other lenders may not easily fill. Banks at the centre of the second map hold similar portfolios and could be hit if their shared borrowers default. No single set of banks is therefore central under all criteria. In both maps, banks cluster by country: German, Italian, Spanish, Austrian and Finnish banks form their own hubs, while French and Dutch banks tend to join existing ones.
We also analyse the changes in the network between 2021 and 2023. In a period of falling commercial property prices and transaction volumes, the loan network expanded. The number of lending relationships increased markedly and, after a slight decline in 2022, the average loan amount rose by 6.7% in 2023. New relationships were more geographically diverse, although cross-border volumes did not necessarily increase, and the overlap between banks’ portfolios declined. Smaller CRE groups gained importance in the network. Tighter credit conditions may have shown up in loan terms, such as pricing and collateral, rather than in volumes.
We map the holders of bonds issued by the CRE groups at end-2023, using the matched CSDB-SHSS data set. Only around half of the 100 groups had bonds outstanding at end 2023, suggesting that the bond market is mainly accessible to the largest players and that the two networks describe partly different populations. Unlike the loan data, which cover only euro area banks, bond holders are covered worldwide. The data identifies only the sector and country of the holders, such as French insurance companies and pension funds, rather than individual institutions. Holders are therefore represented as 210 sector–country combinations, which makes the two networks not entirely comparable.
Figure 4 presents the bond network, with CRE groups shown as diamonds and holder sectors, such as investment funds, insurers and pension funds, banks or households, as other symbols. As in Figure 2, symbol size reflects volumes, colours indicate the country, and strongly connected participants are placed close together.
Figure 4. Network representation of holders of bonds issued by the largest euro area CRE groups, end-2023
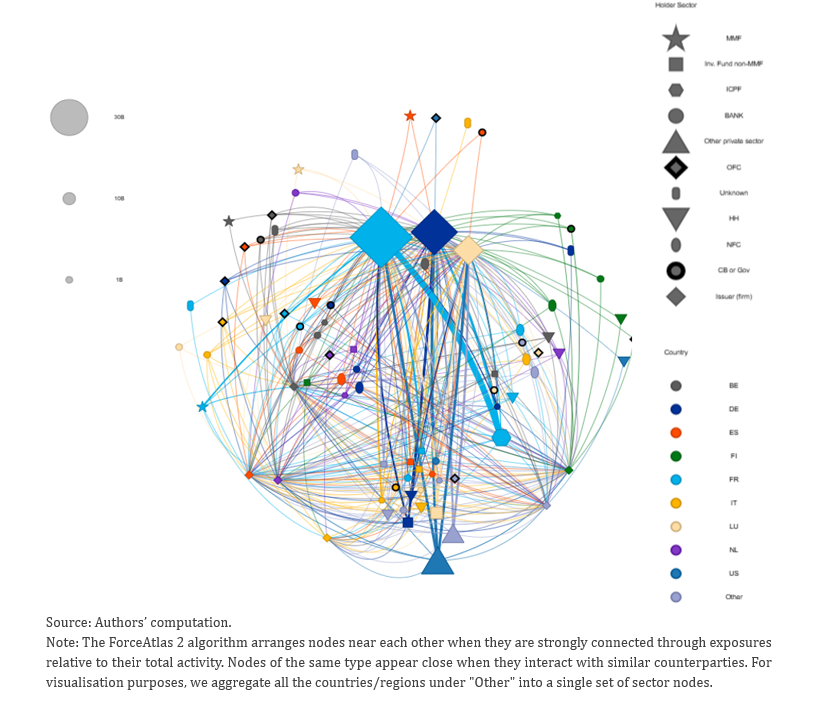
In contrast to the loan network, the bond network shows a high degree of cross-border and cross-sector connections. The regional clustering seen in bank lending is largely absent, with participants from different countries spread throughout the chart. At the centre, the largest CRE groups from Germany, France and Luxembourg sit close together, indicating that their bonds are held by similar investors. At the bottom of the chart, a distinct cluster of non-European holders, mainly investment funds, insurers, households and banks, invests in bonds issued by companies in similar countries. Unlike banks, there is little evidence of home bias among bond holders in the data: institutional investors hold diversified portfolios regardless of where the issuer is based which could be explained by bonds often being unsecured and thus not associated with a specific property or geography. Part of this cross-border pattern may however reflect where securities are held rather than who ultimately owns them.
The largest issuers, mainly from Luxembourg and France plus one German group, attract the widest range of investors, and three of them clearly stand out. Beyond these, investors do not systematically prefer large issuers: the debt of smaller companies is also held in many countries by various types of investors. The largest holdings, above EUR 10 billion each, belong to French insurers and pension funds, Luxembourg investment funds and other private-sector holders in the United States.
The bond network contracted from 2021 to 2023. Average bond issuance declined by 16.6%, the number of issuer-holder relationships fell after peaking in 2022, and one CRE group exited the bond market. This retrenchment is consistent with tighter financial conditions, reduced issuance and portfolio rebalancing. In contrast, the loan network expanded over the same period, suggesting that loans and bonds may have acted as substitutes for some groups.
Overall, bank financing of large CRE groups is regionally clustered and organised around a core of large banks, with limited overlap between lenders’ portfolios, while bond financing reaches only half of the groups but draws on a broad, cross-border investor base.
The financial stability implications of the financing networks can be viewed from two angles: their network structure and the importance of individual participants. The resilience of a network depends largely on how connected it is and the extent to which these connections form clusters. The loan network is characterised by regional clustering, as it contains areas with many local connections, while links across regions are weaker.
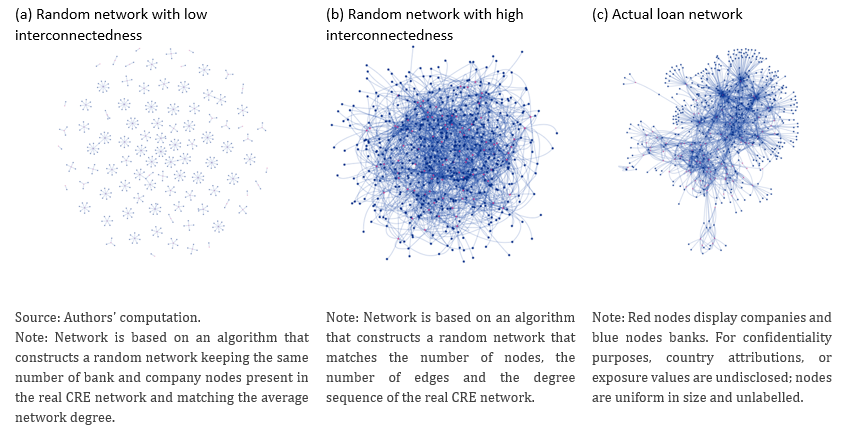
To illustrate what this means for risk, we compare the actual loan network (Figure 5c) with two networks built at random. The first keeps the same number of banks and CRE groups (Figure 5a), resulting in a structure in which each CRE group is financed by different banks, with no lenders in common. The second also gives each bank and CRE group exactly as many connections as in reality (Figure 5b), producing a much more interconnected network, which nevertheless lacks the clusters of the actual one.
In Figure 5a, risks are largely local. The failure of a single CRE group would affect only a few banks, with little scope for risks to spread to other lenders. Figure 5b is the opposite case. High interconnectedness allows shocks to spread more easily, but risks are also more widely dispersed, potentially allowing losses to be absorbed by a broader set of participants. The actual network lies between these two extremes of a fully fragmented and a fully integrated, cross-border CRE credit market. Because of its regional clusters and areas of high connectivity, risk is neither purely local nor dispersed enough to be absorbed. Smaller shocks may spread within a regional cluster, while larger shocks may travel beyond it through the participants that bridge different parts of the network.
The insolvency of Signa serves as a cautionary tale of these vulnerabilities. While we do not formally establish a causal link, it can be observed that the share of CRE non-performing loans rose by the end of 2024 in Germany (+1.1 percentage points), Austria (+0.5 points) and Luxembourg (+3.2 points), while developments in other countries were muted.4 This divergence is consistent with shocks having been transmitted more strongly within closely connected parts of the network and absorbed largely within the region, although the failure of a larger or more interconnected group could have had more widespread repercussions.
Figure 5. Comparison of different structures of the loan network
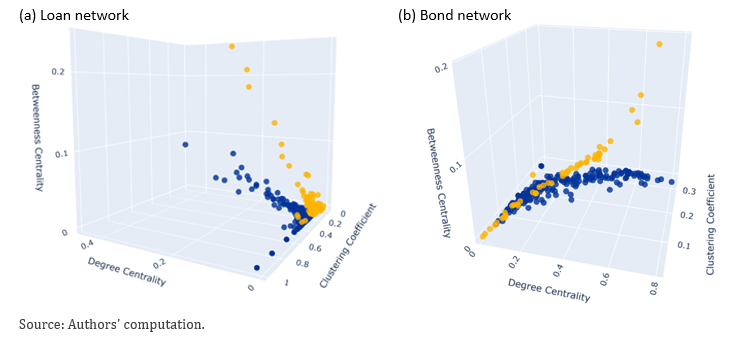
Financial stability also depends on the participants whose failure could destabilise the system. Rather than formal simulations of how losses spread, we rely on simpler indicators. Figure 6 describes each bank and CRE group with three measures: its number of connections (“degree centrality”), how often it lies on the shortest routes linking other participants (“betweenness”), and how far its counterparts share the same partners, forming a close-knit neighbourhood (“clustering”).
In the loan network (Figure 6a), the more connections a participant has, the less close-knit its neighbourhood tends to be. Several CRE groups, notably the largest German ones, which borrow from a multitude of specialised banks, combine many connections and a strong bridging role with a loose neighbourhood, they connect different clusters of banks without belonging to any of them. Their financial difficulties could affect a large number of banks across several regions. At the other end, banks with few connections but a close-knit neighbourhood are specialised lenders financing a small number of similar CRE groups in the same countries, which exposes them to concentration risk.
Figure 6. Identification of important participants
Even if the default of an important CRE group could disrupt the network, spillovers to broader financial stability may remain limited. Loans to the 100 groups analysed in this study account for no more than 8% of any bank’s total loans, although this measure does not cover banks’ loans to other CRE borrowers. Even so, specialised CRE lenders often have a higher share of their loans exposed, and some lend to fewer than five of the groups, which makes them vulnerable to concentration risk. By contrast, the largest lenders are diversified banks, for which CRE loans make up a relatively small part of the balance sheet. Still, research simulating how risk propagates shows that banks’ joint exposure to failing firms can be an important channel of contagion (Lux, 2016).
Although the two are not directly comparable, the bond network differs markedly from the loan network. It is more interconnected and more international, with little evidence of home bias. In this respect it is closer to the integrated case of Figure 5b: risk is spread more evenly across different types of investors and countries, which may facilitate risk sharing and typically make the network more resilient to shocks. At the same time, stronger cross-border links create additional channels through which shocks can propagate internationally.
Nevertheless, a few participants stand out in the bond network (Figure 6b). Among issuers, three CRE groups combine large issuance with a central position, their debt being held by many sectors and countries. Among investors, five sector–country groups hold large amounts across many issuers: French insurers and pension funds, Luxembourg and German investment funds, and other private-sector holders in the United States and the United Kingdom. As the data do not show how many institutions lie behind each of these groups, the risk for individual investors cannot be fully assessed.
Declining CRE markets can trigger defaults, increase non-performing loans, and weaken banks’ asset quality by devaluing collateral, causing liquidity issues and contagion. These risks are more pronounced in the loan network given geographical concentration where regional clustering can amplify local shocks and allow them to spread through bridging participants. In bond markets, risks are more widely distributed across investors, but stronger cross-border links may amplify international spillovers. While the loan network may be more vulnerable to shocks, this risk is partly offset by collateral and the closer relationship between banks and borrowers. By contrast, bond financing is typically unsecured, and because bonds are traded, investors may sell them at early signs of distress, even at a discount, potentially triggering destabilising dynamics.
The network analysis helps identify areas where closer monitoring is warranted. First, large and highly connected CRE groups act as critical connectors in the network, and their failure could affect multiple banks and regions. Second, the two most interconnected regional communities, centred on Germany, Austria and Luxembourg, and on Belgium, France, Italy and the Netherlands, may amplify financial stability risks and merit closer surveillance. Third, specialised banks with concentrated exposures to a small number of CRE groups are particularly vulnerable to concentration risk. More generally, in CRE downturns bond refinancing may become more expensive, and bond investors may know less about firms’ finances than banks with lending relationships.
In this note we map the financing networks of the major CRE groups in the euro area, connecting them to the banks from which they borrow and the investors holding their bonds. The loan network is characterised by a core-periphery structure, with large banks and CRE groups at the centre and many small banks with few connections at the periphery. Our findings also point to a pronounced home bias and regional disparities in financing patterns, leading to the formation of clusters. Specifically, CRE groups located in Germany, Austria and Luxembourg tend to secure smaller loans from a broader range of banks, whereas groups in other regions establish larger credit relationships with fewer lenders. These financing patterns foster the emergence of communities of CRE groups sharing similar regional characteristics in their credit relationships. Notwithstanding these network characteristics, we observe limited overlap among key lenders in terms of the number of large CRE borrowers they serve and the size and composition of their portfolios.
Additionally, we analyse the characteristics of financing through the issuance of bonds, by investigating the sectors and countries that hold bonds issued by the largest CRE groups. While not directly comparable to the loan network due to differences in the level of detail and coverage of the bond-holder data, the bond network exhibits a higher degree of interconnectedness and minimal evidence of home bias or regional clustering. The three largest issuers emerge as clear outliers in terms of connectivity, their bonds being held by a particularly wide range of investors. Nevertheless, smaller issuers also attract investors from a diverse range of sectors. Between 2021 and 2023, the bond network contracted, whereas the loan network expanded.
Regional clustering in the loan network may concentrate shocks within particular regions and limit risk sharing across them. The higher interconnectedness of the bond network may instead facilitate greater diversification while also creating channels for shocks to spread across countries and investor sectors. At the same time, both networks contain a small number of highly central participants, with many connections and a strong bridging role, whose distress could affect a large share of the CRE debt market. Their importance therefore reflects not only the size of their exposures, but also their position within the network.
The scope of the analysis is constrained by current data availability and could be extended in several directions, including a larger sample of CRE groups, loan data covering lending from outside the euro area and bond holdings observed at the level of individual investors rather than sectors. Bridging the analysis of the loan and bond markets would allow for a more comprehensive system-wide perspective on contagion risks, and further research could simulate how shocks spread through the networks and identify critical participants with greater precision. Despite these limitations, our findings offer valuable insights into the financial stability implications of CRE financing, providing a basis for analysing the impact of shocks on specific entities. In particular, they show how granular network analysis can complement aggregate exposure data by identifying where risks are concentrated, how financing relationships connect banks and investors to CRE groups, and where closer monitoring may be warranted.
Aliman, M., Regnér, M., Sarchi, C., Skudelny, F., & Valetto, M. (2026). Commercial real estate debt financing in Europe: Evidence from a network analysis. ESRB Working Paper Series, No. 155.
Andersen, I., & Sánchez Serrano, A. (2024). A map of the euro area financial system. ESRB Occasional Paper, No. 26.
Castren, O., & Rancan, M. (2015). Interconnectedness of the banking sector as a vulnerability to crisis. ECB Working Paper Series, No. 1866.
Daly, P., Ryan, E., & Schwartz Blicke, O. (2024). Mapping the maze: A system-wide analysis of commercial real estate exposures and risks. Macroprudential Bulletin, 25 (November).
European Banking Authority. (2024). Risk assessment report – Special topic: CRE related risks.
European Securities and Markets Authority. (2024). Real estate markets – Risk exposures in EU securities markets and investment funds.
European Systemic Risk Board. (2015). Report on commercial real estate and financial stability in the EU.
European Systemic Risk Board. (2023). Vulnerabilities in the EEA commercial real estate sector.
Iori, G., & Mantegna, R. N. (2018). Empirical analyses of networks in finance. In Handbook of computational economics (pp. 637–685).
Jackson, M. O., & Pernoud, A. (2021). Systemic risk in financial networks: A survey. Annual Review of Economics, 13(1), 171–202.
Lux, T. (2016). A model of the topology of the bank–firm credit network and its role as channel of contagion. Journal of Economic Dynamics and Control, 66, 36–53.
Neveu, A. R. (2018). A survey of network-based analysis and systemic risk measurement. Journal of Economic Interaction and Coordination, 13(2), 241–281.
Sánchez Serrano, A. (2025). Three extensions of the map of the euro area financial system. ESRB Occasional Paper Series, No. 27.
Recommendation of the European Systemic Risk Board of 1 December 2022 on vulnerabilities in the commercial real estate sector in the European Economic Area (ESRB/2022/9)
Privately owned refers to listed and non-listed firms. Firms owning properties for their own use, such as manufacturing companies with warehouses, are excluded. Real estate investment trusts (REIT) are also included in the sample.
We group banks according to their size for visualisation and confidentiality purposes. Figure 2 provides a summary, while the detailed micro-level dynamics discussed in the text are derived from individual-node analyses tailored to the granular dataset. These analyses capture individual bank and CRE-group behaviours, as well as specific statistical indicators representing micro-level patterns.
Increases at end of 2024 compared with end of 2023. Source for the NPL rate is the EBA Risk Dashboard.