

The views expressed are those of the authors and not necessarily those of the institutions the authors are affiliated with.
Abstract
The escalation of tensions in the Middle East and the subsequent closure of the Strait of Hormuz raise concerns about renewed inflationary pressures in the euro area. This policy brief assesses the implications for core inflation risks using a Quantile Regression Forest (QRF), a non-linear machine-learning model. We find that upside risks to core inflation increased sharply following the outbreak of the war, reaching their highest levels in April and May 2026. The increase was driven mainly by firms’ short-term selling-price expectations, while wages and other indicators of more persistent inflation pressures remained comparatively muted. Yet broader underlying pressures may take longer to feed through, particularly via slower-moving channels such as wage-setting, firms’ pricing decisions and cost pass-through.
The closure of the Strait of Hormuz following the outbreak of the war in the Middle East continues to expose the global economy to the risk of severe energy supply disruptions and renewed inflationary pressures. Such a shock can affect consumer prices through several transmission channels, including an immediate rise in energy prices, the pass-through of higher production costs from upstream to downstream sectors, wage adjustments, and shifts in firms’ and households’ inflation expectations.
Headline inflation is likely to respond quickly, primarily through its energy component. Risks to core inflation, which excludes the more volatile food and energy components, may also rise, although the extent and persistence of the resulting effects depend on how the shock propagates through the economy. A sharp increase in short-term inflation expectations may indicate that firms anticipate higher future costs and plan to raise prices accordingly, providing an early signal of indirect inflationary effects. Meanwhile, stronger wage pressures or broader cost pass-throughs would increase the likelihood of more persistent inflation and the emergence of second-round effects. Identifying the dominant transmission channels is therefore crucial for distinguishing a temporary inflationary scare from a more entrenched rise in underlying inflation.
This policy brief examines how these transmission channels could shape the current outlook for core inflation and the risks surrounding it. Our results suggest that the possibility of core inflation risks turning out higher than expected increased markedly following the closure of the Strait of Hormuz, before receding somewhat during the summer months. This increase was driven primarily by a rise in firms’ short-term selling-price expectations, while wage pressures and broader cost channels remained relatively subdued. While the assessment reflects information available up to August 2026, the framework provides a general tool for tracking inflation risks in a rapidly evolving geopolitical and economic environment.
A Quantile Regression Forest (QRF) provides a flexible, real-time assessment of the outlook for euro area core inflation, including both the central forecast and the risks around it. We employ the QRF, a non-linear machine-learning model that estimates the entire distribution of possible inflation outcomes. The model is estimated using euro area aggregate data at monthly frequency and draws on a broad set of macroeconomic and financial indicators. Unlike conventional forecasting models, which typically assume that risks are symmetrically distributed around a central projection, the QRF allows us to quantify both upside and downside risks to inflation (Lenza, Moutachaker and Paredes, 2025; Arce, Klieber, Lenza and Paredes, 2026). This feature is particularly useful when analysing rare events and large shocks, whose effects may be concentrated in the tails of the distribution rather than around the median forecast.
The model incorporates the main transmission channels through which an energy shock can affect inflation. Cost pressures are captured by producer and commodity prices, while indicators of real activity and economic sentiment provide reduced-form measures of broader supply and demand conditions. Past inflation accounts for inflation persistence, and wage developments capture the risk that the shock feeds into labour compensation and generates more persistent price pressures. Interest-rate expectations and broader financial conditions reflect the role of financial markets. Finally, short-term selling price expectations provide a timely indicator of how firms perceive the inflation outlook and whether they anticipate passing higher costs on to consumers.1
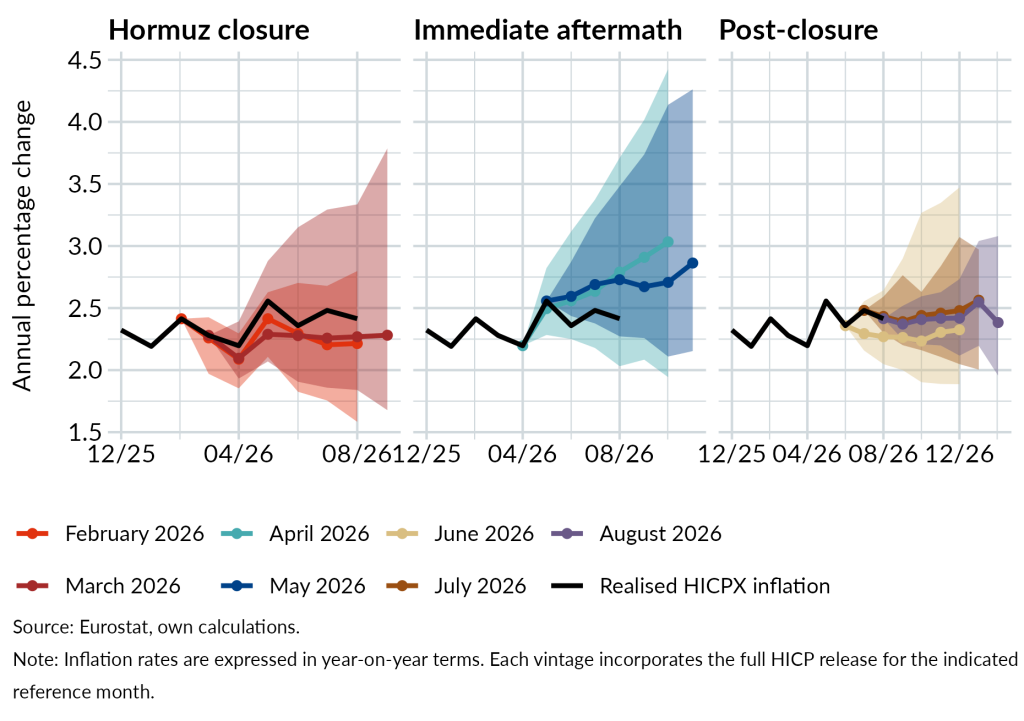
Core inflation risks, reflecting the possibility that core inflation may turn out higher or lower than expected, rose markedly in the immediate aftermath of the outbreak of the war in the Middle East, have moderated in June and July and increased again slightly in August. Following the initial shock, the forecasts based on the March 2026 HICP full release2 already showed a marked widening of the upper tail of the forecast distribution, indicating rising upside risks, while the median outlook remained broadly stable (chart 1, first panel).
By April, however, the median QRF projection had shifted higher and the distribution remained wide, suggesting that the shock had begun to affect not only the balance of risks, but also the central inflation outlook through the lens of this model. The perceived increase in inflationary pressures was therefore no longer confined to unfavourable scenarios but had become reflected in the median QRF projection.
The QRF forecast stayed high in May (chart 1, second panel). In June, more favourable incoming data and a partial easing of geopolitical tensions lowered both the central projection and the upper tail of the distribution, although upside risks remained above pre-shock levels. The normalisation continued in July, resulting in a more balanced forecast distribution and an easing of the elevated upside risks seen immediately after the shock, while in August the median QRF forecast had increased again compared to June (chart 1, third panel). The increase in inflation risks following the outbreak of the war in the Middle East was thus sizeable, indicating a notable shift in the balance of risks of inflation.
Chart 1. Core inflation prediction across vintages
(Median forecast and 5th/95th quantiles)
Decomposing the forecast distribution helps identify the sources and likely persistence of inflation risks. While chart 1 presents the QRF forecasts for the year-on-year core inflation rate commonly used in policy discussions, charts 2 and 3 focus on annualised month-on-month inflation dynamics.3 This perspective allows us to detect changes in inflation risks before their full effects become visible in the year-on-year rate.
Building on the framework proposed by Schröder (2026), we decompose the model’s predictions into contributions from economically relevant groups of variables.4 Chart 2 shows how these contributions generate deviations of the 6 months ahead forecast density compared to historical regularities, while chart 3 summarises how they affect the net balance of upside and downside risks across forecast vintages. Together, the two exercises highlight the role of the individual variables in shaping the inflation outlook.
Firms’ selling price expectations account for most of the increase in upside risks in the March to June projection vintages. Chart 2 decomposes the difference between selected vintages’ predictive densities and the model’s reference distribution into contributions from the main group of variables. Positive contributions in a given bin indicate which groups are associated with a higher probability of inflation in that part of the distribution.
The decomposition suggests that, over the period analysed, economic sentiment, real activity and firms’ selling price expectations primarily influence the centre of the distribution, reflecting the pre-shock environment characterised by a resilient economy and a gradual recovery in activity (European Central Bank, 2026). Economic sentiment and real activity therefore help explain the QRF’s baseline outlook for core inflation but contribute relatively little to the increase in upside risks following the Strait of Hormuz closure. By contrast, firms’ selling price expectations emerge as the dominant source of both the notable increase in inflation risks in the immediate aftermath of the shock and their subsequent moderation as geopolitical tensions eased somewhat. Their contribution is concentrated in the upper tail of the distribution.
Commodity prices, meanwhile, play only a limited direct role in explaining developments in core inflation. By construction, core inflation excludes the direct effects of energy and food prices. Any impact of higher commodity prices operates through indirect pass-through and second-round effects, which are captured mainly by firms’ selling-price expectations and wage developments. The latter in particular, however, might only reflect these pressures with a delay, as wages tend to adjust only gradually.
The balance-of-risk decomposition confirms that the increase in upside risks to core inflation was pronounced. Following Kilian and Manganelli (2007, 2008), chart 3 summarises the net risk of inflation exceeding rather than falling short of the ECB’s 2% target, scaled by its historical standard deviation. A value of zero corresponds to the historical average, with positive and negative values indicating a stronger-than-usual tilt above or below 2%. Because this measure is derived from the same predictive distribution as chart 2, its drivers can be decomposed into contributions from the same groups of variables used to produce the QRF forecasts, following Schröder (2026). Its added value is to provide a compact comparison across forecast vintages. After declining as disinflation progressed, the balance of risks rose sharply following the closure of the Strait of Hormuz, remained elevated in April and May 2026, and then gradually receded in June and July. Afterwards, it increased again slightly in August. These developments are explained predominantly by firms’ short-term selling price expectations, whereas the contributions from wages and producer prices changed comparatively little.
Chart 2. Decomposition of the predictive density for core inflation
(6-months ahead prediction for selected vintages)
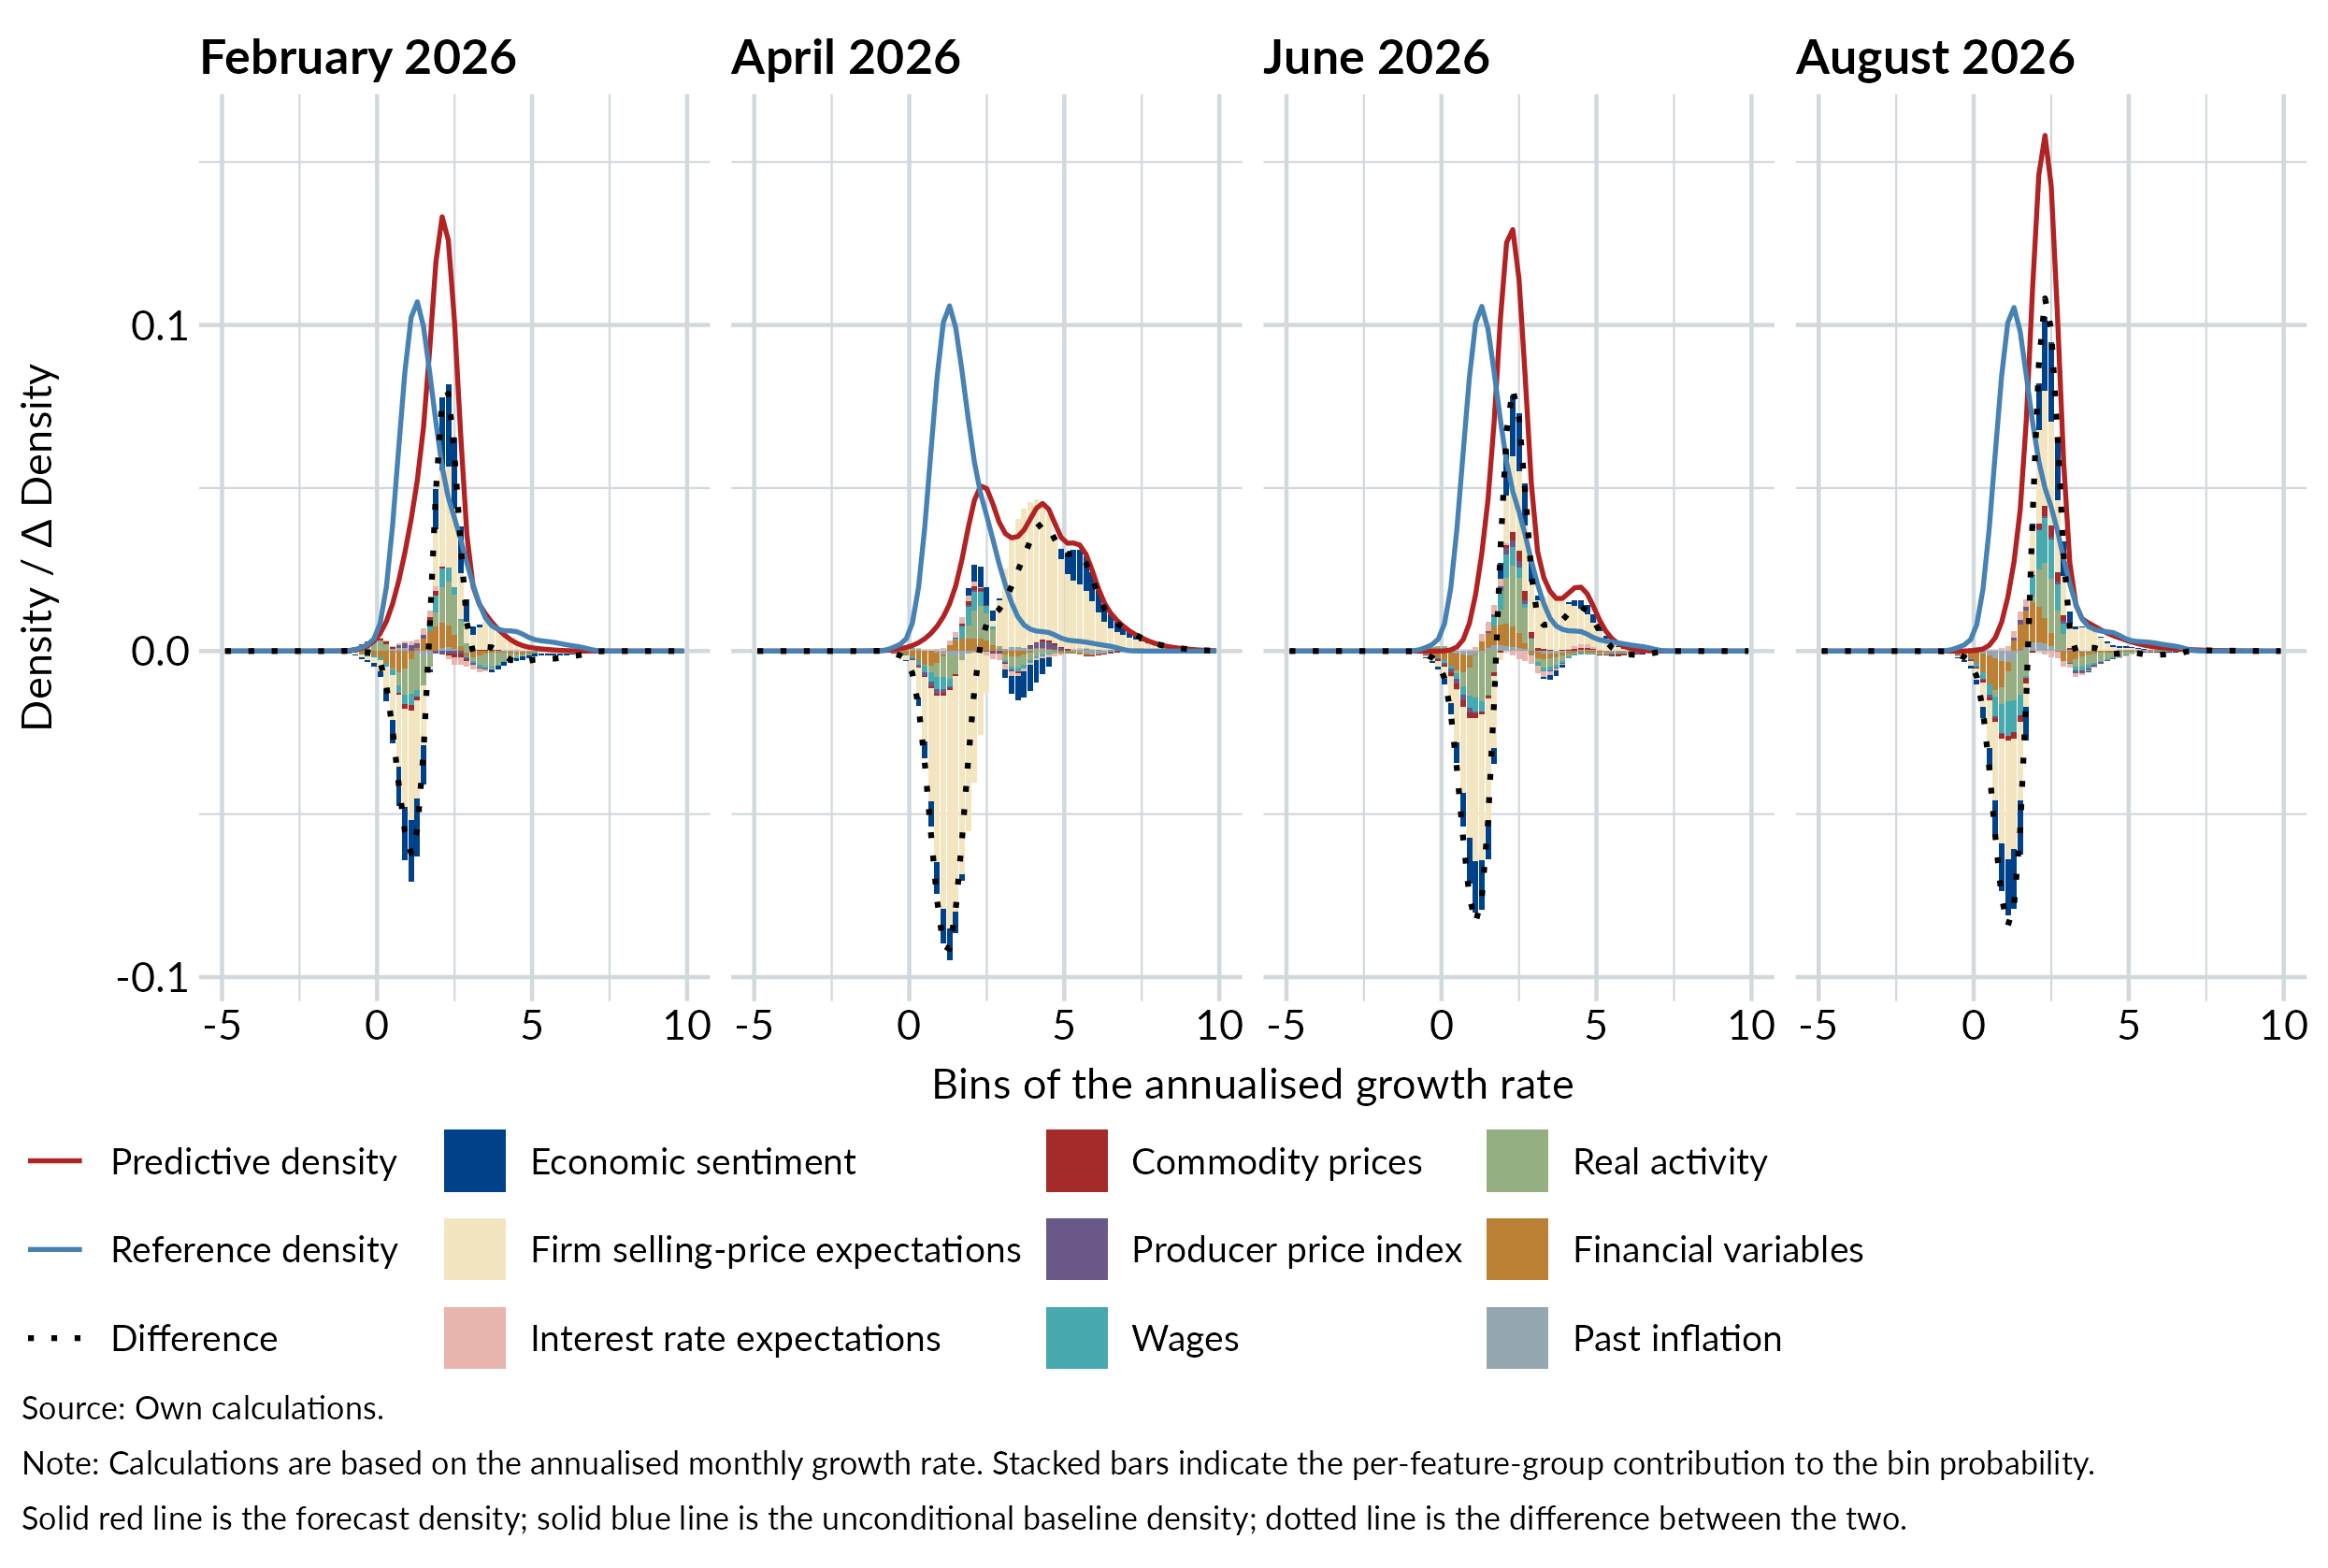
Chart 3. Decomposition of the balance-of-risk measure for core inflation
(6-months ahead prediction across vintages)
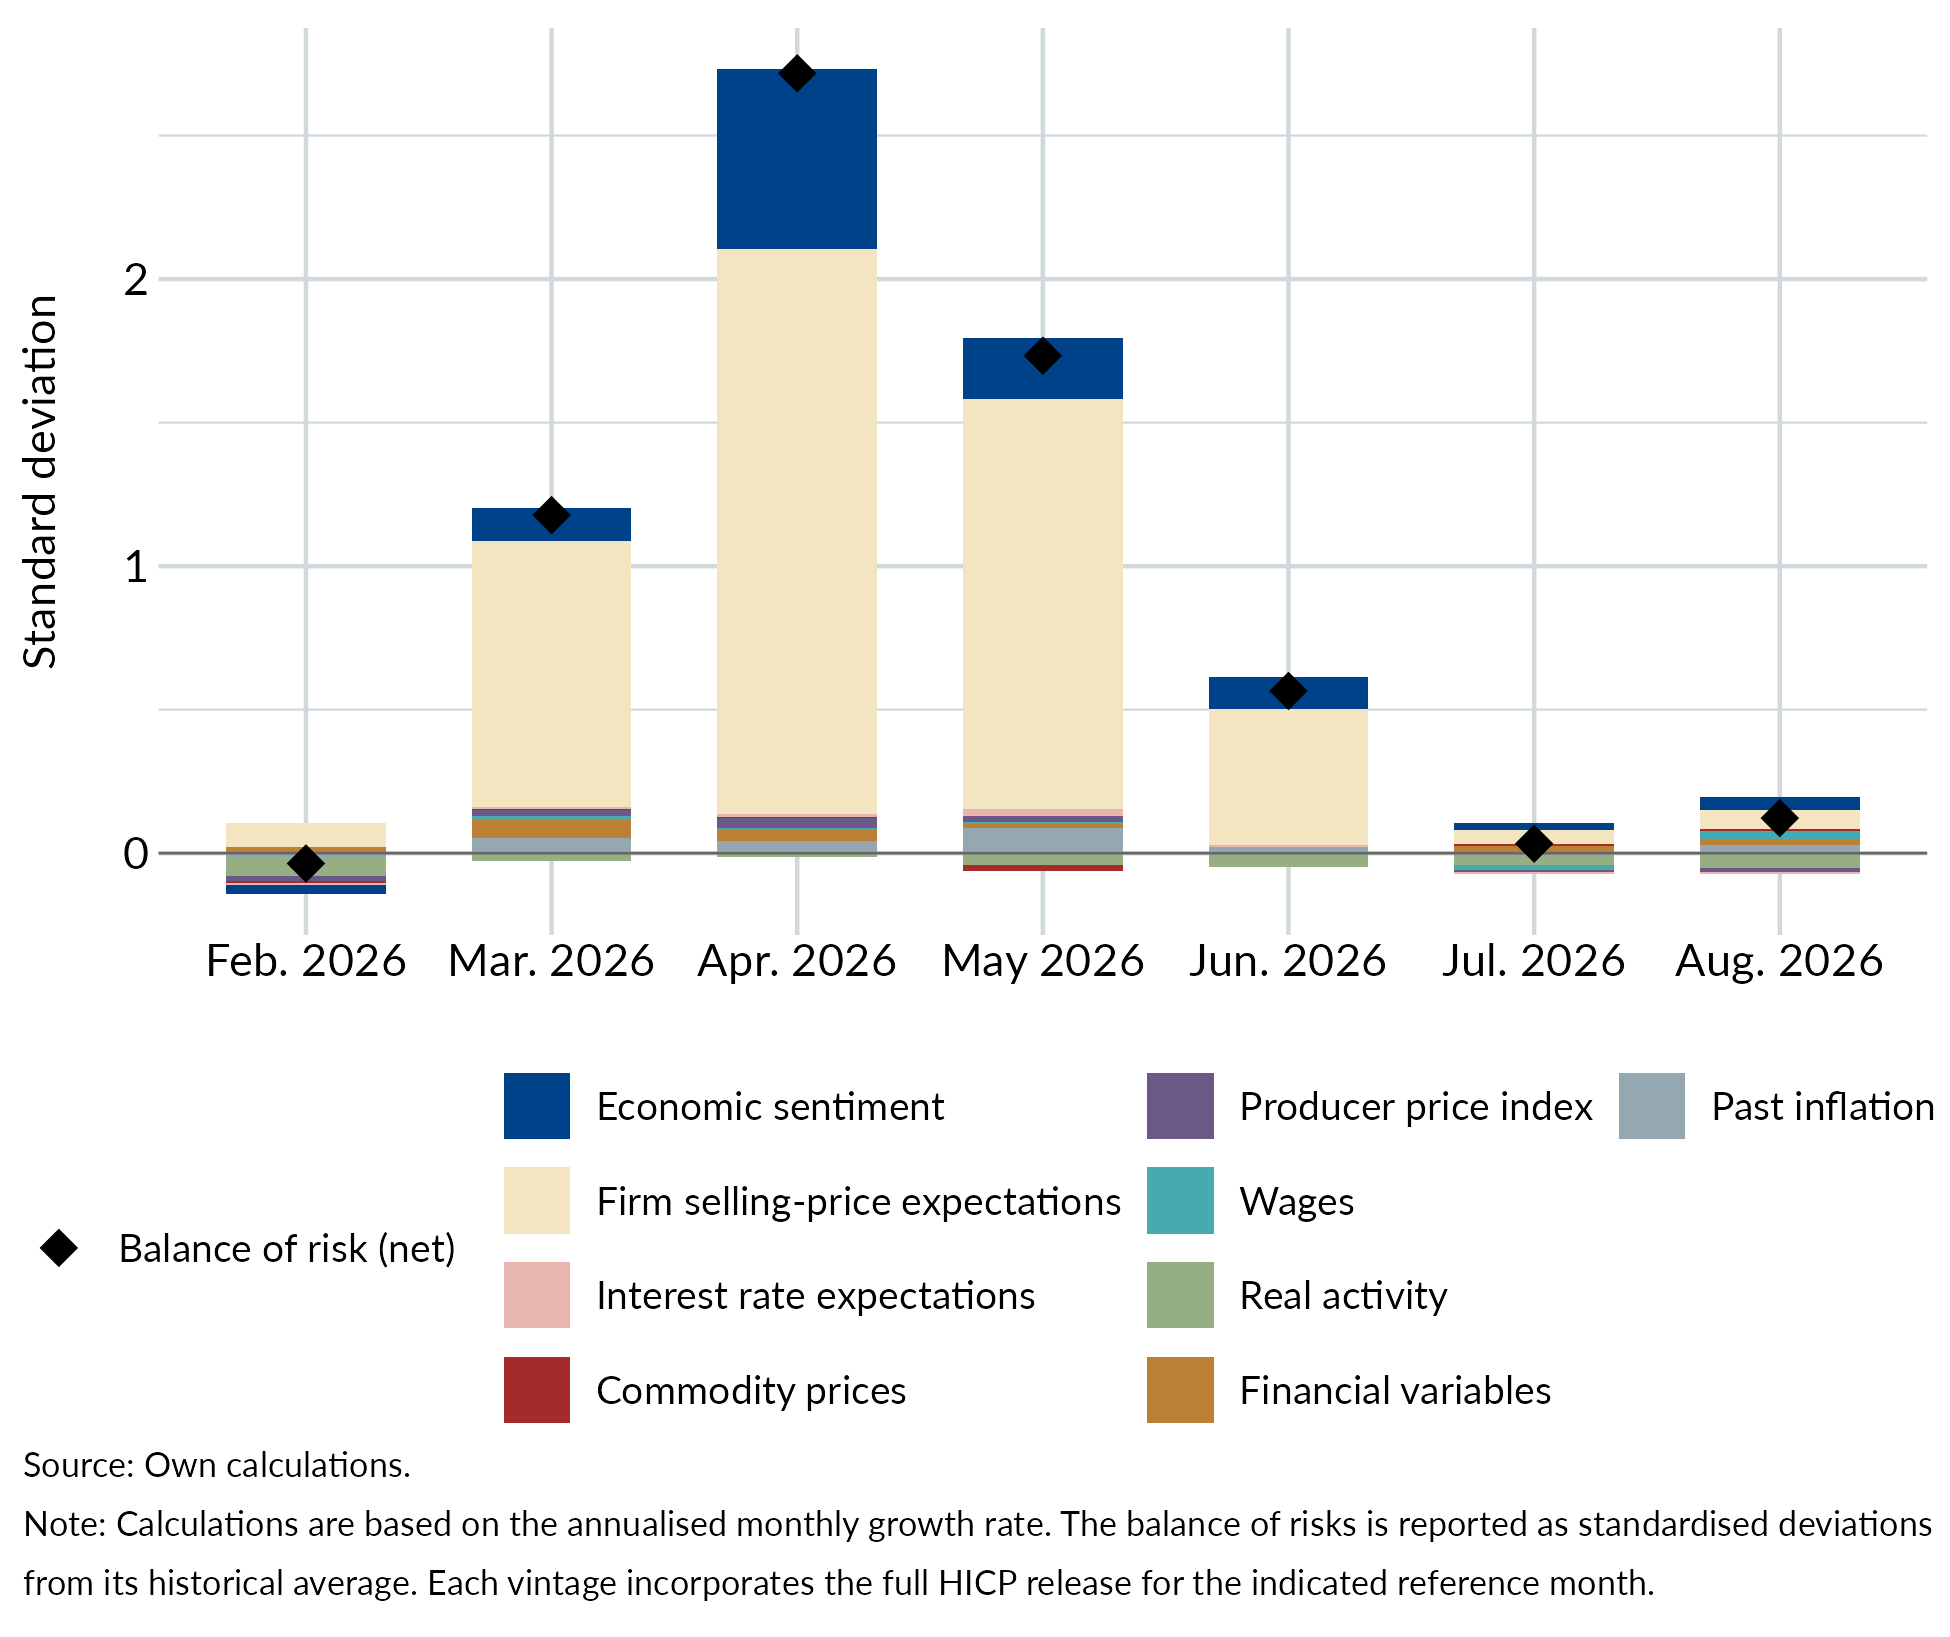
Overall, the evidence up to August 2026 suggests that a balance-of-risk measure for euro area core inflation rose sharply following the closure of the Street of Hormuz, gradually receded in June and July and increased again slightly in August. Our decomposition suggests that the increase in the balance-of-risks measure is explained predominantly by firms’ selling price inflation expectations, whereas the contributions from wages and broader cost indicators changed comparatively little. This is consistent with the transmission of an energy shock. The associated rapid rise and subsequent easing of firms’ selling-price expectations contrast with the more muted response of wage developments and other indicators typically associated with inflation persistence. At the same time, the full effects of the shock may take time to unfold, as some second-round effects could emerge only with a delay. Looking ahead, renewed increases in energy prices could again raise inflation risks . In this context, the framework presented in this policy brief provides a useful real-time gauge of inflation risks and their underlying drivers, allowing policymakers to reassess the outlook as economic and geopolitical conditions evolve.
Arce, O., K. Klieber, M. Lenza and J. Paredes. 2026. Navigating uncertain times with the help of artificial intelligence. The ECB Blog. 21 April 2026.
European Central Bank. 2026. Economic Bulletin. Issue 1/2026.
Goulet Coulombe, P., M. Göbel and K. Klieber. 2024. Dual interpretation of machine learning forecasts. OeNB Working Paper 265.
Kilian, L. and S. Manganelli. 2007. Quantifying the Risk of Deflation. In: Journal of Money, Credit and Banking 39(2-3). 561–590.
Kilian, L. and S. Manganelli. 2008. The Central Banker as a Risk Manager: Estimating the Federal Reserve’s Preferences under Greenspan. In: Journal of Money, Credit and Banking 40(6). 1103–1129.
Lenza, M., I. Moutachaker and J. Paredes. 2025. Density forecasts of inflation: A quantile regression forest approach. In: European Economic Review 178. 105079.
Schröder, M. 2026. Mixing it up: Inflation at risk. In: Journal of Money, Credit and Banking.
Short-term inflation expectations are measured by firms’ selling-price expectations over the next three months from the European Commission’s Business and Consumer Survey.
Throughout this brief, vintages are labelled by the reference month of the full HICP release they incorporate. For example, the April vintage refers to the forecast update based on the full HICP release for April.
The QRF is estimated using annualised accumulated month-on-month inflation rates. Year-on-year rates are not used for estimation because their high persistence and sensitivity to base effects can obscure changes in recent inflation dynamics.
For a complementary view that attributes forecasts to historically similar episodes, see Goulet Coulombe, Göbel and Klieber (2024).