

The views expressed are those of the authors and do not necessarily reflect those of the Bank of Finland or the Eurosystem. We thank John H. Cochrane for useful comments.
Abstract
A simple question can be posed: do European price levels converge differently when countries share the euro? To answer this question, we study all 351 bilateral links among the EU27 countries from 2003 to 2024 and estimate the extent to which an initial household-consumption price-level gap closes. We begin with the unadjusted price-level-index gap and then repeat the analysis using a leave-country-out, productivity-conditioned price-level benchmark. An accounting decomposition assigns the largest contribution to nominal exchange-rate movements. The ordering survives common-support restrictions, alternative weighting and every single-country deletion, but the broad contrast largely disappears when Central and Eastern Europe is excluded. The evidence is therefore descriptive and specific to the realised EU27 network, where initial price gaps in the euro area are smaller. That also explains the smaller numerical closure of relative-price gaps.
An obvious answer is that a common currency removes conversion costs, makes prices easier to compare and may intensify competition. It is therefore natural to expect prices to converge more closely when countries share the euro. But “stronger” has two meanings. Countries may ordinarily have smaller price-level differences, as is the case in the euro area, or an existing difference may close more quickly. The first meaning concerns proximity and integration. The second concerns adjustment: how much of that initial gap subsequently disappears?
The two answers need not coincide. Monetary union can be associated with small ordinary gaps while removing the bilateral nominal exchange rate, which can move rapidly when national consumer prices are sticky. Two euro members may start closer together but possess fewer short-run ways of correcting a newly enlarged gap. Countries with separate currencies may have larger and more volatile raw differences yet close a larger share through exchange-rate movements. These differences create an obvious sample-selection problem for which there is no straightforward solution.
We study the price-parity problem using all 27 EU countries and all 351 bilateral links between them. The results provide two answers. Euro members are much closer in raw price levels. But both before and after conditioning for productivity, pairs exposed to a float/other currency arrangement close a larger share of an initial gap over the next one to three years. The difference appears mainly through nominal exchange-rate movements. Because countries and regimes were not randomly assigned, this is a description of the realised European system — not a causal estimate of what euro adoption would do to an otherwise identical country.
Purchasing power parity is one of international economics’ most durable propositions and one of its best-known empirical puzzles. Arbitrage should limit persistent differences in comparable prices, yet aggregate real exchange rates often adjust slowly. Rogoff (1996) framed the combination of short-run volatility and sluggish long-run convergence as the purchasing-power-parity puzzle. Transport costs, non-traded inputs, sticky prices, taxes, regulation, market segmentation and measurement differences all create room for deviations to persist.
A common currency can narrow several of those frictions without eliminating them. It removes bilateral nominal exchange-rate variation, reduces conversion costs and makes prices more transparent. Engel and Rogers (2004), however, find that the fall in European consumer-price dispersion largely preceded the euro and does not identify an additional post-euro acceleration. Faber and Stokman (2009) document a longer European convergence process in which substantial price-level convergence preceded or accompanied monetary integration. Andersson, Masuch and Schiffbauer (2009) show that euro-area price-level and inflation differentials are related to structural and cyclical country characteristics. By contrast, Macedoni (2021), using monthly disaggregated price indices around four countries’ euro adoption, finds that monetary union narrowed the estimated band within which relative prices do not adjust. The results are complementary rather than mechanically contradictory: price concept, country comparison and analytical setting all matter.
A second strand explains why equal price levels are not the correct benchmark for countries at different stages of development. Balassa (1964) and Samuelson (1964) link higher traded-sector productivity to higher wages and, through non-traded services, higher aggregate consumer-price levels. Berka, Devereux and Engel (2018) show that euro-area real exchange rates covary with sectoral productivity in a way consistent with a modified Balassa–Samuelson mechanism. Deaton and Heston (2010) also emphasise how the construction and interpretation of purchasing-power-parity measures depend on baskets, weights and aggregation. The Eurostat–OECD methodology is designed to make price-level comparisons as consistent as possible, but a comparative PLI is not an equilibrium exchange-rate model.
These literatures leave a narrower empirical question open. Do currency-regime differences in the subsequent closure of an observed gap already appear in the most direct, unadjusted price-level measure? How much do they change when the same exercise is repeated against a common productivity benchmark? And through which measured component — national inflation, the nominal exchange rate or the moving productivity benchmark — does the difference appear?
Our contribution is to answer those questions in a fixed EU27 bilateral design. We begin with the raw price-level (PLI) gap, proceed to its productivity-conditioned counterpart and then reconcile the change in each gap with an exact accounting decomposition. This ordering prevents the central result from resting on an opaque productivity correction while allowing productivity to play the role that economic theory and the cross-country data assign to it.
The price-level measure is the Eurostat–OECD household final consumption expenditure aggregate E011, expressed as a comparative price-level index. Annual price-level (PLI) observations provide cross-country anchors. Monthly harmonised consumer-price indices and bilateral exchange rates trace subsequent movements from January 2003 through December 2024. We examine three horizons for every available origin month: 252 monthly origins and 88,452 pair-month observations at 12 months, 240 origins and 84,240 observations at 24 months, and 228 origins and 80,028 observations at 36 months. All 351 unordered country pairs are represented.
The first object is the raw price-level gap: the log difference between the two countries’ directly comparable household-consumption price levels. Currency status is allowed to vary over time and is assigned at the origin month. A euro link joins pairs of euro members. A peg/ERM II link contains a euro-linked currency but no float/other currency. The residual float/other category contains at least one non-euro, non-peg currency. It is a heterogeneous category, not a homogeneous population of freely floating currencies. Denmark’s tightly managed krone, Sweden’s floating krona, currency-board arrangements and the transition paths of later euro adopters must not be collapsed into a causal three-treatment experiment.
Figure 1 shows why the order “raw first, conditioned second” is informative. At the 12-month origins, the median absolute raw gap is about 17.7 log points for euro links, 37.6 for float/other links and 44.5 for peg links. On the first meaning of stronger PPP — ordinary price-level proximity — the euro area looks strong.
Part of this ranking reflects countries rather than currencies. We therefore construct the productivity-conditioned PLI gap. A cross-country first stage relates the price level mainly to total-economy productivity, with a smaller manufacturing-relative-productivity term motivated by Balassa–Samuelson. The total-productivity coefficient is 0.391, whereas the manufacturing-relative term is 0.057. The benchmark is therefore Balassa–Samuelson-type conditioning, not a structural model of every determinant of equilibrium prices.
A country’s own observations are excluded when constructing its reference level. This leave-country-out procedure prevents the country being evaluated from mechanically determining its own yardstick. It compresses median absolute gaps in all three groups to roughly 9.3–9.6 log points. Taxes, rents, regulation, mark-ups, service quality and consumption-pattern differences remain outside the benchmark. The residual should therefore be called a productivity-conditioned PLI gap, not a measure of fundamental misalignment.
BOX 1. Technical Appendix
Raw starting gap = rolling difference of average price level of other member countries.Productivity-conditioned starting gap = raw price gap – bilateral productivity difference of other member countries
Reported closure equals −100 × coefficient of the gap for each of the 3 regimes; positive values mean reversion. The float/other advantage equals 100 × difference between the coefficients of the euro and float effect.
Weights. The benchmark gives each country-year equal weight.
Controls and uncertainty. Models contain regime-specific country-pair and calendar-origin-month fixed effects. Two-stage 27-country-delete uncertainty rebuilds the relevant first- and second-stage objects after every deletion.
Sample-status note. Bulgaria is coded as a peg during the 2003–2024 sample. Its euro adoption on 1 January 2026 changes the current institutional count, not the historical coding.
Figure 1. Raw and productivity-conditioned starting gaps by currency regime
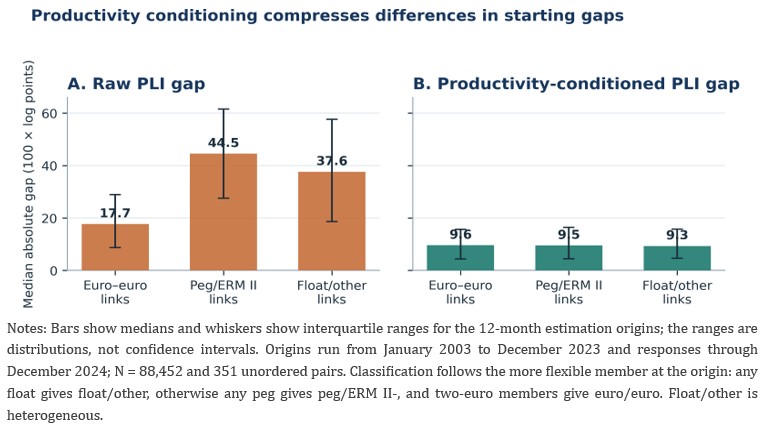
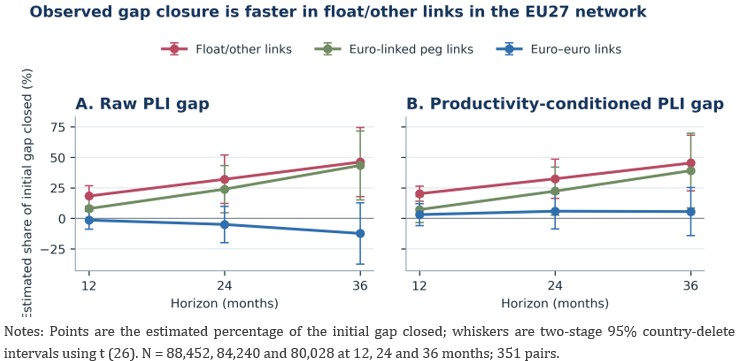
Figure 2 reports the share of an initial gap that has closed after different time horizons. Srart Start with the raw-gap panel. The negative point estimates imply fitted widening rather than closure, but the individual euro estimates are uncertain and should not be interpreted as a structural law that raw price gaps inside monetary union must expand. The more relevant comparison is the float/other advantage over euro links. Thus, the regime ordering is already present in the most direct measure. It is not created by the productivity benchmark.
This result also clarifies why smaller initial dispersion and faster adjustment cannot be treated as synonyms. Euro pairs begin much closer together in raw price levels, but when an unusual raw difference is present, the subsequent fitted path does not show rapid reversal. Float/other links begin with larger differences and close a larger share. Raw gaps are nevertheless not sufficient for interpretation. If a lower-productivity country is undergoing a persistent rise in its relative price level, a raw-gap regression may classify structural convergence towards the productivity–price relationship as either correction or divergence. The next step therefore repeats exactly the same dynamic comparison after removing the common productivity benchmark.
For the productivity-conditioned gap, estimated closure among float/other links shows up in the right-hand side of Figure 2. The economically relevant conclusion is not that productivity is unimportant. Its contribution becomes larger with the horizon, and it explains much of the raw difference between original and later euro members. In country-node summaries, later euro members close up to 4.7 percentage points less of the raw gap than the EA11 founders. After conditioning, those cohort differences become much smaller. Development and integration history plainly shape the raw data. The important result is instead that conditioning does not reverse the broad currency-regime ordering. Raw and productivity-conditioned gaps answer different questions, but both show faster closure in the realised float/other part of the EU27 network.
Figure 2. Gap closure after 12, 24 and 36 months under both gap definitions
Why does closure differ? Any change in the measured bilateral gap can be divided exactly into observed components. For the raw gap these are relative HICP inflation and the nominal exchange rate. For the productivity-conditioned gap, the change in productivity is added. The components sum exactly to the total fitted contrast. Figure 3 gives a consistent answer. In the raw comparison, nominal exchange-rate movements contribute up to 47.1 percentage points to the float/other advantage after 36 months. Relative HICP inflation contributes much less. The exchange rate therefore supplies most of the totals. In the productivity-conditioned comparison, the FX contributions are a bit less. Relative HICP inflation contributes even much less and thus, again, the nominal exchange rate is the dominant measured component.
Figure 3. Accounting decomposition of the float/other advantage over euro links
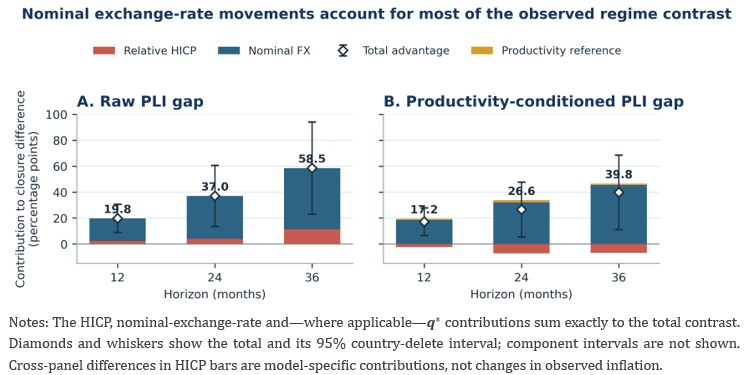
Inside the euro area, the bilateral nominal exchange-rate contribution is zero by construction. Relative-price adjustment must instead occur through different national inflation rates, wages, costs, productivity, margins, quantities, labour or capital movement, fiscal risk-sharing, or slower changes in economic structure. In these data, relative HICP inflation does not replace the absent exchange-rate margin within the first three years.
This is an accounting finding, not a causal mediation result. Saying that exchange rates “account for” most of the fitted contrast does not mean that currency depreciation efficiently causes convergence, or that faster closure is necessarily welfare-improving. The defensible statement is narrower: outside monetary union, the measured price gap contains an adjustment component that does not exist between two euro members, and this component makes the largest accounting contribution to the observed difference in closure.
Figure 4. Country-node convergence is only weakly related to initial productivity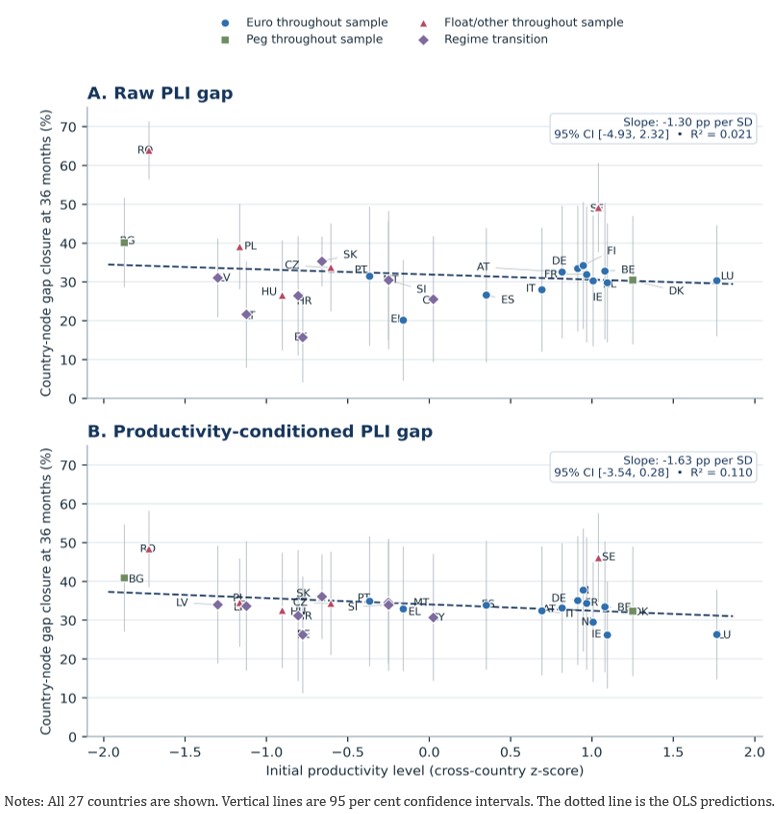
The broad result is not driven by a single small country or by the extreme tails of the starting-gap distribution. But it is not invariant to the regional composition of the comparison. Both facts are essential. Figure 4 addresses the selection issue from another direction. Each country receives a country-node effect: the equal-partner average of its implied slopes across all 26 bilateral relationships. This is a property of a country’s position in the network, not a unilateral national convergence speed.
All 27 countries are displayed with their uncertainty intervals. With the raw PLI gap, there is clearly no simple monotonic relationship between initial productivity and subsequent closure. Country rankings remain fairly similar after productivity conditioning, but the gap-productivity relationship becomes stronger.
Sweden and Denmark remain useful mechanism cases but should not carry the main story. Nor does Romania make a significant difference, even though its value is slightly larger than that of Sweden at every horizon. The EA11–Denmark–Sweden comparison deserves its own interpretation: two individual non-euro countries cannot identify a general peg-versus-float effect.
If stronger purchasing power parity means closer observed price levels, the euro area looks strong. Raw household-consumption price-level differences are markedly smaller between among euro members. Decades of integration, institutional similarity and the common currency are all plausible contributors, although the present comparison cannot isolate them. If, however, stronger purchasing power parity means faster closure after a gap has emerged, the answer changes. In the realised EU27 network, float/other links close up to 58.5 percentage points more of the raw gap than euro links after three years. Using a leave-country-out productivity benchmark reduces those differences somewhat but does not reverse their ordering. The largest accounting contribution comes from nominal exchange-rate movements.
This is not evidence that the euro causes slow convergence, that every floating country adjusts faster, or that exchange-rate volatility is desirable. Currency regimes, productivity, geography and integration history are jointly selected. The broad result largely disappears when Central and Eastern Europe is removed, even though it survives all individual-country deletions and the pure float–float comparison retains the same ordering. That qualified result still matters. Europe is likely to contain both euro and non-euro members for decades, particularly if the Union enlarges. The most relevant policy question is then how remaining and newly emerging gaps adjust when the bilateral exchange rate can no longer do any of the work.
Andersson, M., Masuch, K. and Schiffbauer, M. (2009), “Determinants of inflation and price level differentials across the euro area countries”, ECB Working Paper Series No. 1129. https://www.ecb.europa.eu/pub/pdf/scpwps/ecbwp1129.pdf
Balassa, B. (1964), “The purchasing-power parity doctrine: A reappraisal”, Journal of Political Economy, 72(6), 584–596. doi:10.1086/258965.
Berka, M., Devereux, M. B. and Engel, C. (2018), “Real exchange rates and sectoral productivity in the eurozone”, American Economic Review, 108(6), 1543–1581. doi:10.1257/aer.20151045.
Deaton, A. and Heston, A. (2010), “Understanding PPPs and PPP-based national accounts”, American Economic Journal: Macroeconomics, 2(4), 1–35. doi:10.1257/mac.2.4.1.
Engel, C. and Rogers, J. H. (2004), “European product market integration after the euro”, Economic Policy, 19(39), 348–384. doi:10.1111/j.1468-0327.2004.00126.x.
European Central Bank (2026), “Bulgaria joins euro area”, press release, 1 January. https://www.ecb.europa.eu/press/pr/date/2026/html/ecb.pr260101~c830245e42.en.html
European Commission (2026), “Convergence criteria for joining”, accessed 26 August 2026. European Commission.
European Union (2026), “Countries using the euro”, accessed 26 August 2026. European Union.
Eurostat and OECD (2024), Eurostat–OECD Methodological Manual on Purchasing Power Parities: 2023 edition, Luxembourg: Publications Office of the European Union. doi:10.2785/384854.
Faber, R. P. and Stokman, A. C. J. (2009), “A short history of price level convergence in Europe”, Journal of Money, Credit and Banking, 41(2–3), 461–477. doi:10.1111/j.1538-4616.2009.00215.x.
Macedoni, L. (2021), “Has the euro shrunk the band? Relative purchasing power parity convergence in a currency union”, Scandinavian Journal of Economics, 123(2), 593–620. doi:10.1111/sjoe.12417.
Rogoff, K. (1996), “The purchasing power parity puzzle”, Journal of Economic Literature, 34(2), 647–668. JSTOR.
Samuelson, P. A. (1964), “Theoretical notes on trade problems”, Review of Economics and Statistics, 46(2), 145–154. doi:10.2307/1928178.