

The findings, interpretations, and conclusions expressed in this work are entirely those of the authors and should not be attributed in any manner to the Joint Vienna Institute, the World Bank, its Board of Executive Directors, or the governments they represent.
Abstract
This policy brief presents a risk-return framework for assessing how private capital – equity investors and banks – finances low-carbon and high-carbon investment projects under different policy environments. The model reflects key features of project finance, including equity investor risk aversion, bank capital constraints, and credit risk assessments. It identifies for each project whether it receives spontaneous private-sector financing and in what mix of equity and debt. Applied to a portfolio of potential projects, it maps policy-conditional financing outcomes and shows how measures such as carbon taxes, subsidies, guarantees, co-financing, and regulatory adjustments shift project attractiveness and crowd in private investment. The analysis highlights how structural factors, from fiscal space to equity market depth, condition financing patterns and underscores the potential for well-designed policies to mobilize private capital for the low-carbon transition.
Achieving net-zero emissions by 2050 will require a major global surge in green investment over the next two decades – particularly in renewable energy, electricity networks, and electricity storage (IEA, 2021). In market economies, two questions are pivotal: (i) how much of this investment can be financed by the private sector, and (ii) how can public policy mobilize private capital toward low-carbon projects while disincentivizing new high-carbon projects? With fiscal space more constrained in 2026 than at the turn of the century, policy effectiveness, and not just public spending, must drive the transition. Hence, the new north star of the low‑carbon transition is smart policies that crowd-in private finance at scale to accelerate low-carbon investment project pipelines.
This policy note presents a simple model for policy analysis in the project finance market for clean (low-carbon) and polluting (high-carbon) investments. Fed with data on potential investment projects in a given country, it provides answers to the above questions and supports smart public policy. We believe this model could serve as the core engine for a bank and capital market-oriented approach to setting public policies in financing the transition. It also allows for various extensions that we sketch out below, which could make the model more tailored to the needs of policy advisors in different countries.
Our model considers that capital markets are characterized by a given market depth and risk aversion, that bank lending creates bank deposits, and bank lending capacity is constrained by capital and liquidity requirements. The model aims to identify which projects can be expected to be financed by which financing sources, based on project risk and return considerations, and which ones will not be financed. This identification is conditional on public policies in place.
The following section provides a brief description of the model. We start from a single investment project and then turn to the universe of all potential investment projects in a market segment.
One investment project – you might want to think of a wind farm or a coal-fired power plant – has assets (A) that generate an expected return. In the simplest specification, asset returns (RoA) are assumed to be normally distributed, and the project is financed by a mix of equity (E) and a bank loan (L). The equity investor chooses to finance a fraction k of the project and asks the bank for an interest quote on a project finance loan for the remainder.
The bank assesses the risk of the project and estimates the probability of default (PD) on the loan it may grant. If that PD is above its risk-appetite threshold (e.g. 5%), the bank deems the project too risky and rejects it. Otherwise, it quotes an interest rate i that reflects three components: (i) its cost of capital (CoC), (ii) cost of funding (CoF), and (iii) cost of risk (CoR). Assuming a prudential framework following international standards, the cost of capital depends on the cost of equity (CoE ~15%) and amount of equity required, i.e. the risk weight of the loan (RW ~100-150%) times the asset value (A) times the capital requirement (ρ ~15%). The cost of funding reflects the cost of debt (CoD ~2%) that the bank pays on the liability (1- ρ*RW), while the cost of risk reflects the probability of default (PD) and loss given default (LGD ~50%) associated with the loan.
In the base specification, we take these inputs (applicable risk weight, cost of debt, etc.) as exogeneous, except for the probability of default that crucially depends on the project’s RoA mean (μ), RoA standard deviation (σ) and equity ratio k. As a higher interest rate i also increases the PD, which in turn warrants a higher i, the bank solves for the interest rate i. When such an equilibrium rate exists, the project could go ahead with the chosen equity ratio k, if attractive for the equity investor.
Figure 1 shows possible financing options for one hypothetical project, with an expected RoA of 10% and RoA standard deviation of 12%. For high equity ratios (shown on the right-hand side of the chart), only a very small loan is required, the PD is close to 0 (dashed blue line), the interest rate (continuous blue line) will be low, as will the expected return on equity (continuous yellow line). The return on equity can be leveraged in case of more debt financing (lower k). Equity investors will, however, not finance projects with unattractive risk-return profiles, such as risky projects that do not yield expected returns above the market in a Capital Asset Pricing Model (CAPM) setting. Financing with a very low equity ratio (shown on the left-hand side of the chart) would entail a loan PD above the bank’s risk appetite. This region is therefore not available.
Figure 1. Single project – Optimal equity ratio
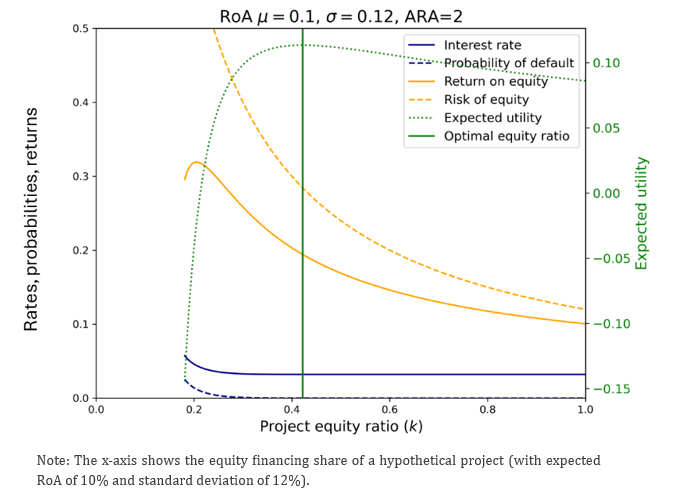
In our model, equity investors have a certain risk-aversion (constant absolute risk aversion or CARA utility), which prevents them from always selecting the equity ratio that maximizes their expected return on equity. The latter would correspond to very high leverage (i.e. small k) but involve extremely high equity risk (dashed yellow line on Figure 1). Instead, a better reflection of project finance reality is that equity investors set their optimal equity ratio (k) in a way that maximizes their utility (dotted green line on Figure 1), by balancing equity risks and expected returns.
Based on this model, we can calculate which projects can be financed by the private sector and how much of the financing will come from equity investors and banks respectively. We call k* the optimal project equity ratio for a given project and equity investor. This optimum depends on the various inputs mentioned above, some of which can be influenced by public policies.
In each market segment (e.g. renewable energy), all investment projects under consideration (i.e. not only those going ahead) can be plotted based on their expected RoA (μ, y-axis) and risk (RoA σ, x-axis) as shown in Figure 2. The bubbles represent possible low-carbon projects (shown in green) and high-carbon projects (shown in brown); their size is proportional to the required investment volume. Applying the above model to each potential project, the project universe is divided into two zones: those that the private sector could in principle finance (zone 1, various colors), and those that the private sector is not willing to finance spontaneously (zone 2, white) because they are too risky or do not yield a sufficiently high expected return.
Figure 2. Multiple projects – Policy-conditional market financing outcomes
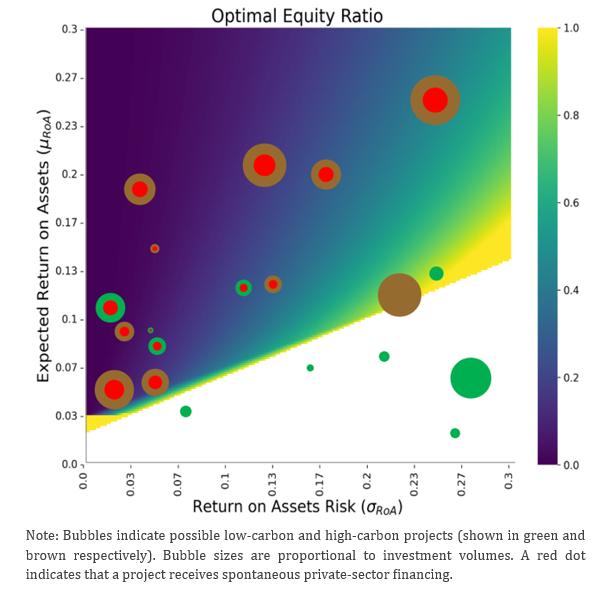
The background colors indicate the optimum equity ratio k*, or correspondingly the project leverage, that results from the optimization exercise described above. In line with intuition, low-risk high-return investment projects can be largely bank-financed (dark blue area, k → 0), while projects with risk-return characteristics at the margin of receiving financing require a larger equity tranche to achieve an acceptable credit rating (PD) that allows the bank to provide debt financing (green or yellow areas, k → 1).
We define as the baseline scenario a no-change-in-policy setting of the respective jurisdiction, taking into consideration as exogenous variables the available fiscal space, the size of the equity market, and bank capital regulation. Based on these parameters, our model yields the expected market outcome, i.e. which high- or low-carbon projects will be financed and in which order (those yielding the highest equity utility are financed first).
A red dot in the middle of the project bubble in Figure 2 indicates that under current structural and policy conditions the project is financed and goes ahead. In the example shown, the market would finance four low-carbon and nine high-carbon investment projects. Two additional projects are in zone 1 as well (one high-carbon, one low-carbon), yet do not receive financing because in this example capital markets are not deep enough, and those projects are the least attractive from a risk-return perspective.1
Based on this model, we can change the structural and policy parameters and see how they will influence the market outcome. For instance, increasing the risk-free interest rate will change the cut-of between zone 1 and 2 (as the risk-free rate impacts the CAPM returns) as well as the color pattern of zone 1, especially in the part of high-risk moderate-return projects that will require more equity financing to go ahead (i.e. this area will turn from blue or green to yellow). Similarly, the impact of equity investor risk aversion and equity market depth will impact which projects receive private sector financing and which do not.
The model can represent the impact of several types of public policies on the financing of low-carbon and high-carbon projects through different channels:
The tool and underlying codes are available on demand. Fed with appropriate data for investment projects, structural and policy variables, such as available fiscal space, size of capital market, applicable risk weights and capital requirements, it yields concrete market outcomes which low- and high-carbon investment projects can be expected to be financed by the private sector conditional on the policies applied.
In the simplest form, these policies are included as on/off policy levers. As their design can be tailored (e.g. carbon tax rate, better subsidy targeting, etc.), we recommend the consideration of various policy specifications on each of the above policy types in practice. This way, multiple policy scenarios can be investigated regarding their impact on market outcomes, thus supporting policy design.
Another possible extension relates to some of the structural variables that are included in the model and could become policy variables over time. For instance, this relates to total equity investment and risk aversion, which is affected by capital market reforms or pension fund sector development, regulatory risk weights (e.g. brown penalizing factor, green supporting factor), lower or higher capital requirements, or different fiscal space that can be used to support public policies in this field.
The model provides policymakers with a scenario analysis tool for assessing how different policy mixes can steer capital allocation toward desired investment objectives, such as mobilizing a targeted volume of green finance or ensuring the viability of specific low-carbon projects, while maximizing private-sector participation. Starting from a baseline defined by structural conditions (fiscal space, equity market depth, bank capital regulation) and market preferences, the model identifies which high- and low-carbon projects would be financed absent additional policy intervention. Policymakers can then introduce a range of measures, such as guarantees, subsidies, or co-financing instruments, to observe how each one of them, as well as their combination, shifts project risk-return profiles, equity demand, and the overall composition of financed investments.
A natural next step is empirical application. The model can be calibrated with available project-level data: expected returns and risk measures from the International Renewable Energy Agency (IRENA), BloombergNEF (BNEF), or development banks, and jurisdiction-specific information on interest rates, regulatory parameters, capital market depth, and fiscal space. This would allow a systematic comparison between simulated outcomes and observed financing patterns. As such, it would facilitate a quantitative assessment of how specific policy instruments shift the set of projects that attract private financing.
More broadly, the framework highlights that constraints to low-carbon investment arise less from the aggregate availability of savings than from the interaction of risk, expected returns, and regulatory conditions shaping equity and bank credit allocation. A risk-return approach provides a transparent structure for evaluating policy options, assessing their relative efficiency, and identifying complementarities across instruments. The model is intended as a technical tool to support such policy analysis and to inform the design of measures that enhance private-sector participation in the transition.
On a conceptual level, we believe that one advantage of the risk and return approach to financing the transition lies in departing from a possible misperception of the relationship between savings and investments under a flow-of-funds approach. Following the latter, one might be tempted to explore whether sufficient available savings exist to finance investments that are needed in the transition to a low-carbon economy, possibly with sobering results. We consider that way of reasoning to be flawed as it does not factor in a key difference between equity and debt financing in project finance, which is linked to the banks’ role in credit and money creation. Hence, available financial savings today are not a mechanical constraint on green investment in the years ahead. Instead – and we end this piece on this optimistic note – financial markets and bank credit creation can provide the necessary resources to finance the transition, provided countries pursue supportive public policies, for which our model hopefully provided some food for thought.
Toy model available at Github repository: https://github.com/lmillischer/bankingondecarbonization
Model, codes and methodological note available upon request (mfandl@jvi.org; lmillischer@worldbank.org).
International Energy Agency (IEA) 2021, ‘Net Zero by 2050 – A Roadmap for the Global Energy Sector’, https://www.iea.org/reports/net-zero-by-2050