

The opinions expressed are those of the authors and do not necessarily represent those of the European Central Bank, SSM or the Eurosystem. We are grateful for comments by Miguel Ampudia, Armin Leistenschneider, Tobias Linzert, Benoit Nguyen, Torsti Silvonen and Julian von Landesberger.
Abstract
Government bond markets provide a crucial safe asset for the euro area banking sector. They are intermediated “over the counter” by a group of dealer banks whose balance-sheet space has become more costly since the Great Financial Crisis. As sovereign issuance has risen and has stayed elevated, pressures on banks’ capacity for intermediation between buyers and sellers may increase. Using security-level Securities Holdings Statistics for euro area primary dealers from 2018 to 2025, we describe the composition of euro area banks’ exposures and associated risks. We also analyse the evolution of banks’ balance sheet utilisation. Our main results are: 1) Dealer banks are absorbing a growing share of euro area sovereign debt. 2) The share in domestic government debt held by dealer banks is stable but heterogeneous across countries. 3) Standard risk metrics do not show any material and outsized increases during the sample period. Our findings echo the rapidly expanding international evidence of the “nexus” between the fiscal policy stance and the mechanisms and capacity of dealer intermediation.
Government bonds are the most important security for the financial system: they anchor the pricing of risky instruments, make up the bulk of banks’ high-quality liquid assets, and are the dominant form of collateral security in repo markets and central clearing. Dealer banks play a central role in the smooth functioning of sovereign bond markets. Dealer banks bridge the primary and secondary market by holding securities bought in governments’ auctions and reselling them to investors. In the secondary markets, bonds trade in an OTC market where a group of (bank) dealers provide intermediation to customers such as asset managers (see Scheicher, 2023, for a survey on fixed income markets). Transactions often occur on a bilateral basis via electronic trading venues.
Post-crisis regulation (in particular the Basel III capital, leverage and liquidity requirements) has strengthened the resilience of the banking system but has also made balance-sheet space more costly, especially in low-margin, balance-sheet-intensive activities such as the intermediation of low-risk assets (cf. Duffie, 2018). Balance-sheet constraints could significantly affect the functioning of the government bond market. Reduced market-making capacity diminishes liquidity, widens bid-ask spreads, and increases transaction costs for investors (cf. Braeuning and Stein, 2026). The Covid market turmoil in March 2020 or the UK gilt stress in autumn 2022 illustrate how a fall in intermediation services during sharp spikes in demand can strain market functioning and distort price mechanisms (cf. Duffie et al, 2023, Pinter, 2023). At the current juncture, these pressures are structural rather than episodic: sovereign issuance is expected to remain elevated while central banks’ balance-sheet normalisation withdraws a large, price-insensitive buyer, so that a rising share of sovereign bonds are held on private-sector balance sheets.1
Against this background, we examine the bond holdings of major euro area banks and study a broad range of risk metrics including proxies for balance-sheet constraints. We use the unique regulatory data in the Securities Holdings Statistics by Banking Group (SHSG) and the Centralised Securities Database (CSDB) to build a comprehensive security-level panel dataset comprising more than 1.3 million ISIN-bank-quarter observations.2 We focus on the group of 29 EU Primary Dealers.3 Due to the use of holding data, there are some constraints in our analysis. A more granular analysis of dealer bank activities in euro area debt markets would require detailed transaction data (see Duffie et al, 2023 for US analysis). Such a comprehensive data set will become available with the implementation of the “Consolidated Tape”.4
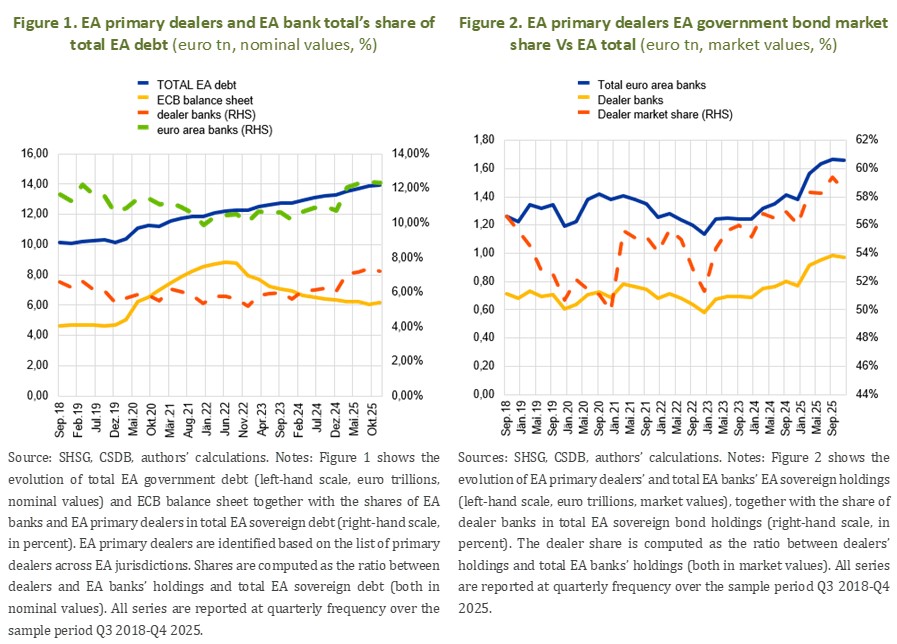
Dealer banks are absorbing a growing share of euro area (EA) sovereign debt. Euro area general government debt currently stands at around €14 trillion5. Euro area banks as a whole hold around 12% of total government debt. The subset of Dealer banks accounts for around 7% of bond volume.6 Both shares have risen markedly against the backdrop of pandemic-related issuance and also a declining Eurosystem balance sheet (figure 1).7 Within the banking sector, dealers have become more dominant: their share of EA sovereign holdings rose from 56% in the third quarter of 2018 to 59% in the last quarter of 2025, and the market value of their sovereign portfolios grew by 36% over the period, against 26% for non-dealer banks (Figure 2).8
Intermediation is concentrated among a small group of major banks. The five largest dealers account for roughly half of total dealer holdings, highlighting how aggregate intermediation capacity in the euro area depends on a small number of key institutions. On average, dealers allocate just under half of their total bond holdings (49.4%) to sovereigns.
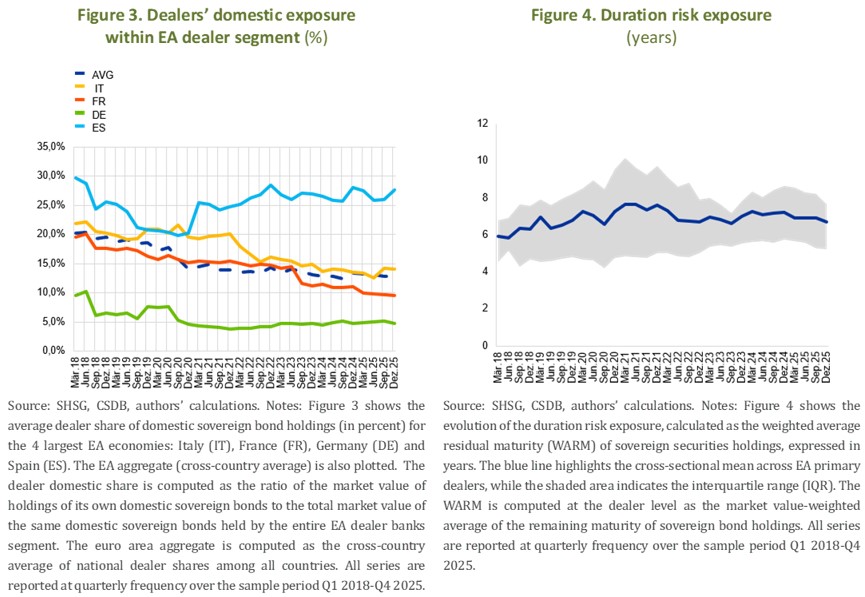
Exposures differ by country (Figure 3). Dealers in Italy and Spain hold larger shares of their own national debt (around 14% and 28% respectively), while dealers from Germany hold a smaller domestic share (around 5%). In aggregate, we find no evidence of a “re-nationalisation” of sovereign risk in recent crises episodes: the cross-country average domestic share declined over the sample, from around 20% to 13%.
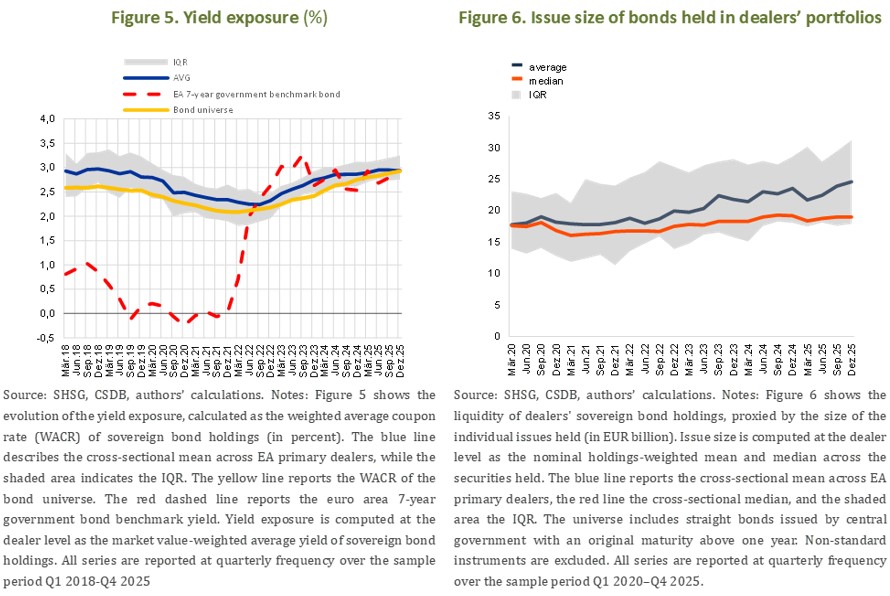
Standard risk indicators of bond exposures have changed only modestly over our sample period. The weighted-average residual maturity of dealers’ sovereign portfolios rose moderately, from 5.8 to 6.9 years, mostly before the onset of quantitative tightening (figure 4). The weighted-average coupon rate evolved closely in line with that of the outstanding bond universe9, declining under the low-rate regime and rising from the third quarter of 2022 as higher-coupon issuance replaced maturing securities (figure 5). As an indicator for secondary-market liquidity of dealers’ holdings we use bond-level issue size.10 In figure 6, we show that the liquidity profile of euro area dealers’ sovereign holdings is concentred in large, benchmark issues and has not deteriorated over time.
As a next step we use public data to compare the evolution of US and EU government bond issuance and bank holdings over the last ten years. Figure 7 shows the upward trend in US government debt when compared to GDP. At the time of writing US government debt exceeds 120% of GDP whereas euro area government debt is around 90% of GDP.
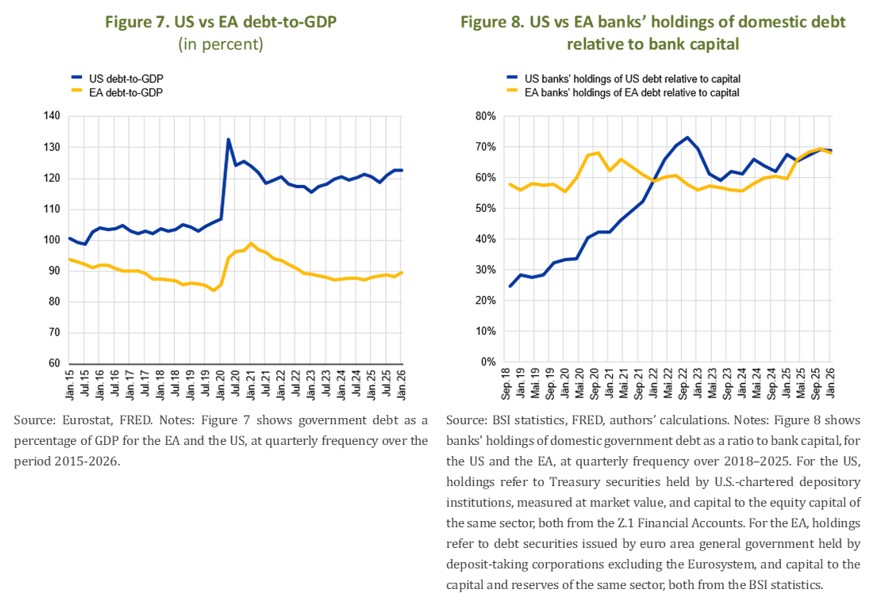
Figure 8 shows diverting evolution of bank holdings in the US and EA. We compare banks’ holdings of domestic government debt to their risk-bearing capacity as represented by bank capital. For the US, we use data from the Financial Accounts (Z.1) for holdings of Treasury securities by U.S.-chartered depository institutions. For the EA, we focus on securities issued by euro area general governments and held by deposit-takers. The share for the banking sector is more stable in the EA than in the US and is partly driven by the design and implementation of central bank purchase programs (see BIS, 2026 for further discussion).
As a last step we use our granular dataset to study the evolution of dealer balance sheet use. Following Ampudia et al. (2025) we first construct a dealer-level measure of balance-sheet utilisation and then we estimate how macroeconomic factors influence this proxy (subject to several assumptions and data caveats)11.
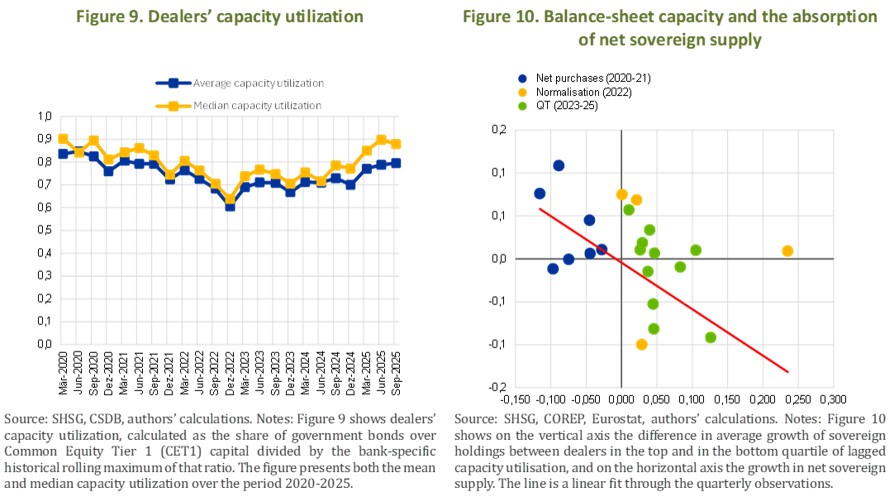
Following Duffie et al (2023), capacity utilisation is defined under a leverage-ratio-type constraint as the ratio of a dealer’s government bond holdings to its Common Equity Tier 1 (CET1) capital, normalised by the bank-specific historical maximum of that ratio. A value close to one indicates that a dealer is operating near its own historical ceiling, with potentially strong constraints to expand the balance sheet. This measure indicates for our sample that capacity utilisation peaked during the COVID-19 crisis (in line with Duffie et al, 2023). In recent quarters it has shown an upward trend (Figure 9) against the backdrop of rising global issuance.
Our baseline econometric approach estimates the following two-way fixed effects panel regression on quarterly, dealer-level data:

The dependent variable, 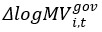 is the quarterly log change in the market value12 of dealer i’s sovereign holdings. The change in net supply,
  is the log change in euro area sovereign debt net of Eurosystem holdings.
  is the dealer’s capacity utilisation, lagged one quarter to mitigate endogeneity. For our analysis, the coefficient of interest is β: a negative β means that more constrained dealers expand their sovereign inventories less when net supply rises. The estimation sample is an unbalanced panel of 29 euro area primary dealers over 23 quarters; the first eight quarters per dealer are dropped to construct the rolling-maximum utilisation measure, leaving 509 dealer-quarter observations. Tables are presented in the annex.
We find evidence that some banks’ balance-sheet constraints may be reacting to rising sovereign volumes. A one-standard-deviation increase in capacity utilisation (around 22%), combined with a one-standard-deviation rise in net supply (around 8%), is associated with an 8.5 percentage point reduction in the growth rate of sovereign holdings. Furthermore, the impact of these constraints is more pronounced for dealers with higher utilization levels: a dealer at the 75th percentile reduces inventory growth by 2.8 percentage points more than one at the 25th percentile facing the same supply increase.13
The mechanism extends beyond sovereigns. Re-estimating for total fixed-income and for non-sovereign holdings yields interaction coefficients that are likewise negative and highly significant, indicating that the constraint may operate through balance-sheet expansion as a whole. Nevertheless, when balance-sheet space is scarce, the shadow cost of holding sovereigns is lower than that of corporate or other non-sovereign securities, given their perceived safety, liquidity and more favourable capital treatment. Consistent with this, we find that the sovereign share of fixed-income portfolios rises as leverage constraints intensify and supply rises (see also Figure 10).14
Overall, we find that dealer banks allocate around half of their total bond holdings to sovereign issuers. Dealer banks have been absorbing a growing share of euro area sovereign debt. Dealer banks’ share in domestic debt has declined moderately over time but remains heterogenous across EA countries. Our analysis of bond holdings provides tentative evidence that the positive trend in bond issuance may also influence bank balance sheet utilisation.
According to empirical analysis of the US Treasury market (Braeuning and Stein, 2026), bank risk-bearing capacity is an important determinant of their intermediation capacity. For EA banks, liquidity ratios and capital buffers have recently remained stable. Furthermore, equity (CET1) ratios have reached a new high, further increasing capital headroom and contributing to banking sector resilience.15
Given the vital systemic importance of government bond markets, policymakers have been active in a variety of directions (FSB, 2022). In particular, the US is engaged in wide-ranging reforms, in particular expanding mandatory central clearing for Treasury repos (Duffie, 2025).
Given common concerns about non-bank leverage in global fixed income trading, minimum haircuts in repos have also been internationally discussed (FSB, 2026; Bank of England, 2026). Much of the leverage that non-banks build in repo rests on very low or zero haircuts. By containing the build-up of such undercapitalised positions ex ante, minimum haircut floors would attenuate the funding demand that weighs on dealer banks’ balance sheets (cf. Grill et al., 2024).
For the Annex please see the PDF
Ampudia, M. et al. (2025), “Constraints on intermediary banks can undermine functioning government bond markets”, ECB Blog, 22 September.
Bank of England (2026) “Discussion-paper on enhancing the resilience of the gilt-repo-market: Feedback-statement.”
BIS (2026) “Annual Economic Report”.
Bräuning, F. and Stein, H. (2026), “The Effect of Primary Dealer Constraints on Intermediation in the Treasury Market”, Review of Financial Studies, forthcoming.
Duffie, D. (2018), “Financial Regulatory Reform After the Crisis: An Assessment”, Management Science, 64(10), 4835–4857.
Duffie, D. (2025) “How US Treasuries Can Remain the World’s Safe Haven.” Journal of Economic Perspectives, 39(2): 195–214.
Duffie, D., Fleming, M., Keane, F., Nelson, C., Shachar, O. and Van Tassel, P. (2023), “Dealer Capacity and U.S. Treasury Market Functionality”, BIS Working Paper 1138.
FSB (2022) “Liquidity in Core Government Bond Markets.”
FSB (2026) “Vulnerabilities in government bond-backed repo-markets. “
Fang, X., Hardy, B. and K. Lewis (2025) “Who Holds Sovereign Debt and Why It Matters.” The Review of Financial Studies, 38(8), 2326–2361.
Grill, M., Molestina Vivar, L., O’Donnell, C. and Weistroffer, C. (2024), “Containing risks from leverage in the NBFI sector – insights from recent policy initiatives.” Financial Stability Review, ECB, May.
Pinter, G. (2023), “An Anatomy of the 2022 Gilt Market Crisis”, mimeo.
Scheicher, M. (2023), “Intermediation in US and EU bond and swap markets: stylised facts, trends and impact of the COVID-19 crisis in March 2020”, ESRB Occasional Papers, No. 24.
Schestag, R.; Schuster, P.; Uhrig-Homburg, M. (2016). „Measuring Liquidity in Bond Markets.” Review of Financial Studies 29 (5), 1170–1219.
See also Chapter 2 in BIS (2026) for a detailed policy discussion
See Fang et al (2025) for a global analysis of sovereign debt holdings.
More details: https://commission.europa.eu/strategy-and-policy/eu-budget/eu-borrower-investor-relations/primary-dealer-network_en.
More details: https://www.esma.europa.eu/esmas-activities/markets-and-infrastructure/consolidated-tape-providers.
Source: ECB GFS.
Shares are computed from SHSG. Using ECB BSI, we would obtain €2.0tn in EA debt securities holdings (against €1.7tn in SHSG), yielding a share of 14.9% (2025 Q4). This reflects the difference in reporting perimeter between the two sources.
Due to confidentiality restrictions, we only show aggregate information.
Extending the issuer perimeter to all sovereigns, the dealer share increases from 62% in 2018Q3 to 66% in 2025Q4; market values grow by 62% for dealers against 38% for non-dealers.
Banks are not able to rebalance their bond portfolios instantaneously.
See Schestag et al (2016) for a detailed analysis of the measurement and drivers of bond market liquidity.
In particular, we have to assume absence of structural breaks (e.g. due to changing policy regimes), that our sample period is fully representative and that aggregate holdings reflect banks’ market-making strategy. Finally, our results are also dependent on the specification of the econometric model in use.
We use market values to capture pricing changes. We show in the annex that the estimates remain unchanged when holdings are measured at nominal value.
Our findings are robust to alternative transformations of the supply variable, different lag structures, two-way (dealer and time) clustering and small-sample corrections, and to excluding the COVID-19 period. The effect is driven by recent rather than distant utilisation, and inventory adjustment occurs contemporaneously with the supply variation, with no evidence of anticipatory or delayed behaviour.
See Box B in the ECB Financial Stability Review (May, 2026) for a detailed analysis of investors’ portfolio adjustments as a reaction to yield curve changes.
See section 3.1 in the ECB Financial Stability Review (May, 2026) for more details on EA banks’ regulatory metrics.