

This policy brief is based on Foschi (2026), Bank of Italy Working Paper No 1527 and CESifo Working Paper No. 12567. The views expressed here are those of the author and do not necessarily reflect those of the Bank of Italy or the Eurosystem.
Abstract
This work introduces the Flight-to-Safety Index (FLY): a novel news-based measure of global demand for safe assets constructed from articles in the Financial Times and the Wall Street Journal. The FLY captures all major flight-to-safety episodes since the 1990s, tracks the global savings glut, and predicts declines in the natural interest rate. Using FLY loadings to classify bonds as safe, neutral, or risky, the analysis shows that the set of global safe assets shrank markedly after the Great Recession while US asset safety increased, and identifies “safety switches” — regime changes in a bond’s safe-asset status. Positive switches (becoming safe) align with economic expansions, higher government spending, lower debt, and credit upgrades; negative switches (becoming risky) are associated with contractions, reduced spending, higher debt, and downgrades.
Safe assets sit at the heart of the international financial system — relied upon to store value, secure collateral, and hedge against adverse shocks.
The economic literature tends to treat the safe-asset status of sovereign bonds as fixed and permanent, but history tells a different story. British gilts gave way to US Treasuries as the global safe asset between the two World Wars. The euro led investors to treat several European sovereign bonds as safe — a perception that shattered during the debt crisis. And in 2025, the yield spike following the Trump tariff announcements raised fresh questions about the safe-asset status of US Treasuries themselves. This work introduces the Flight-to-Safety Index (FLY), a novel, continuous measure of global safe-asset demand, and uses it to identify changes in individual bonds’ status — what I call “safety switches”.
The FLY is built from daily counts of Financial Times and Wall Street Journal articles mentioning terms specifically associated with safe-asset demand. These two outlets are chosen for their global coverage and consistent availability over a long horizon. Construction relies on two purpose-built safe-assets libraries: a “simple” list of bigrams (two-word phrases) hand-picked to capture discourse about safe assets; and a “full” library extracted from 56 NBER working papers on safe assets and flight-to-safety dynamics. The methodology is closely related to that of Baker, Bloom, and Davis (2016) for the Economic Policy Uncertainty index, but targeted squarely at safe-asset dynamics rather than policy uncertainty.
The resulting two versions of the FLY (based on the “simple” and “full” libraries) are shown in Figure 1. The FLY spikes at all important events intuitively associated with flight-to-safety episodes — the Russian debt default, the global financial crisis, the 2011 US downgrade, the European debt crisis, Brexit, COVID-19 — but also captures episodes that standard uncertainty measures miss: the Swiss National Bank’s franc cap removal in 2015 and the 2019 global bond rally. The FLY also drifts upward from the early 2000s onward — consistent with the global savings glut phenomenon. The FLY and estimates of the natural interest rate (R*) display a striking negative co-movement, and a VAR analysis confirms it: an orthogonalized FLY shock foreshadows a persistent decline in the natural rate of up to 20 basis points per standard-deviation shock. Part of the secular fall in neutral rates can thus be associated with rising global demand for safe assets.
The FLY has a number of key advantages over the VIX, an index of implied volatility for the US stock market widely used as a global measure of uncertainty. The VIX focuses on equity volatility rather than on sovereign bond safety and is specific to the US; it is therefore less sensitive to credit-driven episodes in the rest of the world, and is also poorly correlated to global savings, unlike the FLY.
Figure 1. The two versions of the FLY index
(based on the “simple” and “full” libraries) over time, with key events highlighted
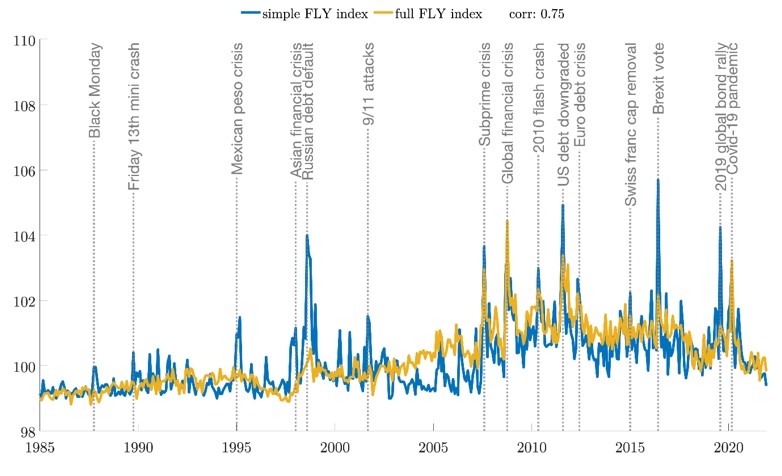
Figure 2. Safety transitions around the global financial crisis,
showing the pre-crisis (1991-2008) vs. post-crisis (2009-2021) safety loadings for selected countries
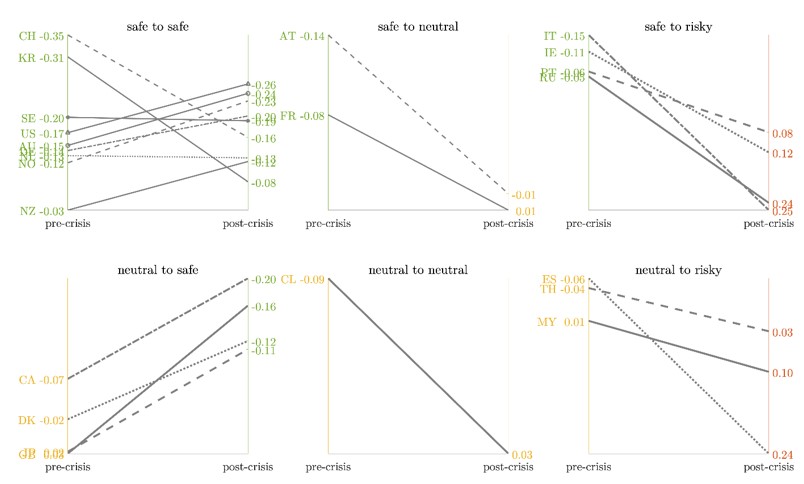
A bond’s safety is linked directly to its correlation with the FLY: bonds whose prices rise when the index spikes are safe; those that fall are risky; uncorrelated ones are neutral. Estimating these loadings across 40 economies over 1991–2021 confirms the US and Switzerland at the top of the hierarchy of global safe assets, followed by Germany, the Netherlands, Finland, Australia, Norway, and Sweden. Splitting the sample around the global financial crisis, however, reveals a striking reorganization, as shown in Figure 2. Before the crisis, several euro-area members — Austria, France, Ireland, Italy, Portugal — were treated as safe or statistically indistinguishable from the US. After the crisis, the set contracted sharply: Ireland, Italy, and Portugal became risky; Austria and France became neutral; and the US emerged as the unambiguous dominant safe asset. The Great Recession, the euro debt crisis, and the savings glut combined to concentrate safe-asset demand on American bonds — with lasting implications for European sovereign markets.
The pre/post-crisis split captures only one potential break in the safe-asset status of sovereign bonds. To extend this reasoning and track changes continuously, I estimate a Markov-switching model for each country’s bond returns, allowing FLY loadings to shift between regimes over time. A positive safety switch occurs when a bond’s loading moves from insignificant to significantly positive; a negative switch is the reverse. Switches are common, concentrated around crises but also frequent in calmer times.
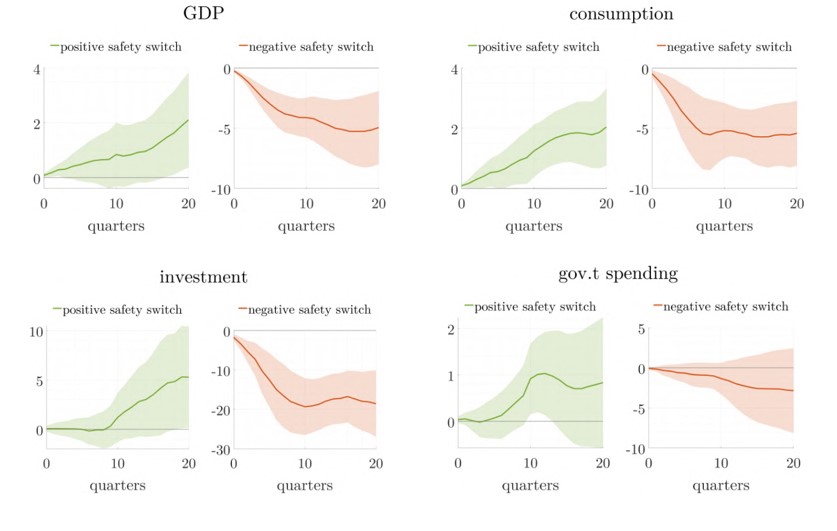
Their macroeconomic consequences, estimated via local projections and shown in Figure 3, are large and asymmetric. Positive switches coincide with expansions — GDP, consumption, and investment rise, debt-to-GDP declines, and credit ratings improve. Negative switches are more consequential: losing safe-asset status brings sharp output contractions, increases in debt, and deteriorating ratings. The pattern suggests self-reinforcing fragility: a negative switch worsens fiscal fundamentals, making it harder to regain safe status.
Figure 3. Macroeconomic dynamics after safety switches:
positive switch to safe (green) and negative switch to risky (red)
Safe-asset demand continues to shape global financial dynamics, with flight-to-safety episodes remaining a recurrent and consequential feature of international markets. This work introduces the FLY index to measure global safe-asset demand continuously, documenting that the sovereign safe-asset landscape has shifted substantially since the 1990s, most dramatically after the global financial crisis. Safety switches carry large, asymmetric macroeconomic consequences that shape borrowing costs, fiscal space, and economic resilience. Measuring these dynamics precisely is a precondition for understanding and addressing them.
Baker, S. R., N. Bloom, and S. J. Davis (2016): “Measuring Economic Policy Uncertainty,” Quarterly Journal of Economics, 131, 1593–1636.
Brunnermeier, M. K., S. Merkel, and Y. Sannikov (2022): “Debt as Safe Asset,” NBER Working Paper 29626.
Caballero, R. J., E. Farhi, and P.-O. Gourinchas (2021): “Global Imbalances and Policy Wars at the Zero Lower Bound,” Review of Economic Studies, 88, 2570–2621.
Foschi, A. (2026): “Safety Switches: The Macroeconomic Consequences of Time-Varying Asset Safety,” Bank of Italy Working Paper No 1527.
Holston, K., T. Laubach, and J. C. Williams (2023): “Measuring the Natural Rate of Interest After COVID-19,” Journal of International Economics, 144.
Krishnamurthy, A. and A. Vissing-Jørgensen (2012): “The Aggregate Demand for Treasury Debt,” Journal of Political Economy, 120, 233–267.