

This policy brief is based on ECB Working Paper No. 3105 “Opening the black box of local projections”. The views expressed are those of the authors and not necessarily those of the institutions the authors are affiliated with.
Abstract
Local projections (LPs) quantify how the economy responds to shocks – and recently, needless to say, there have been quite a few. Yet for all their popularity, LPs remain surprisingly opaque about where their estimates actually come from. This note presents a decomposition method that reveals which historical events contribute to the final LP estimates. By tracing impulse responses back to their historical building blocks, policymakers and analysts can better assess the reliability of estimates and detect cases where results are driven by only a few exceptional episodes or are broadly supported by the data. The approach also extends naturally to machine learning models, offering a common ground for comparing linear and nonlinear estimates and exploring the origins of potential asymmetries.
LPs are a standard tool for quantifying the effects of policy actions such as interest rate hikes or fiscal stimulus, as well as the effects of economic shocks such as oil supply disruptions or financial market disturbances. However, the interpretation of LP results is often unclear. Do they reflect a broad base of past experiences, or are they mainly shaped by a handful of extreme events? The new decomposition technique proposed by Goulet Coulombe and Klieber (2025) addresses this problem by expressing LP estimates as weighted averages of past events, with weights reflecting their similarity to the shock under study.
The method builds on the insight that least-squares estimates, including those from LPs, can be rewritten as weighted averages of past outcomes. Each contribution combines the realized response variable at a given time with a model-implied weight. These weights wear two hats: they can be seen as purified shocks that account for the role of controls, or as proximity scores indicating how similar was past intervention X to the one we’re studying. The latter perspective connects directly to Goulet Coulombe, Göbel & Klieber (2024), who interpret machine learning forecasts as weighted portfolios of past outcomes based on similarities. Extending this idea from forecasts to impulse responses allows us to uncover whether a policy intervention – say, an interest rate increase – is supported by many different past experiences or dominated by just a handful of extraordinary events. By clarifying the historical foundations of results, the approach strengthens the link between empirical evidence and policy decisions.
To illustrate the method with a timely application, we study the effects of an adverse oil supply shock (Baumeister & Hamilton 2019) on CPI energy and CPI core inflation in the US. We scale the shock to produce a 10% increase in oil prices. In the linear specification, we estimate impulse responses via OLS, including monthly observations of CPI inflation, industrial production, oil prices, and the federal funds rate as regressors with six lags each. In a nonlinear extension, we apply a Random Forest, augmenting the regressor set with the unemployment rate, the S&P 500 stock market index, and average weekly manufacturing hours to allow for richer conditioning on macroeconomic state variables.
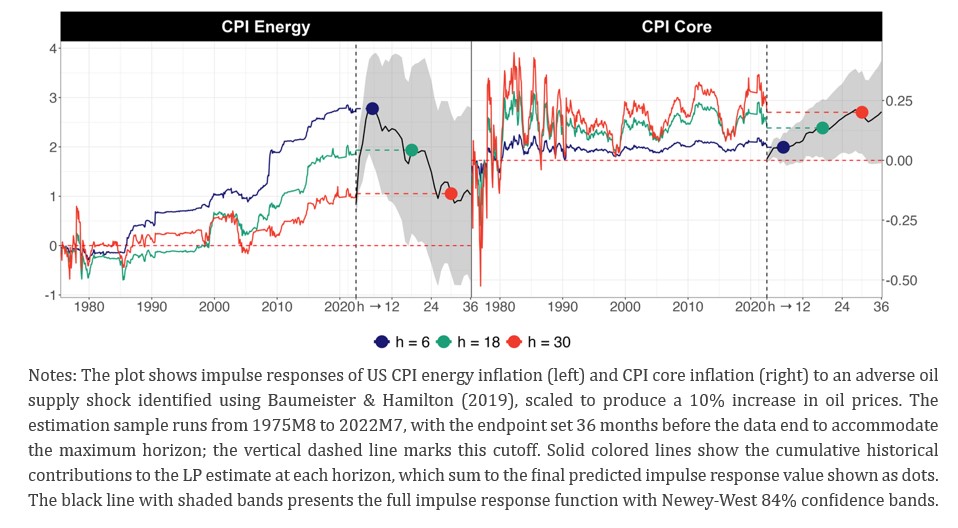
The decomposition of the linear model in Figure 1 shows that CPI energy inflation reacts immediately and strongly to an adverse oil supply shock, as one would expect from direct pass-through of oil prices to household energy costs. The response peaks after around six months, with cumulative inflation rising by approximately 3 percentage points. This response is broadly supported across the historical sample (shown as colored lines summing to the final impulse response estimates), suggesting that the pass-through from oil prices to household energy prices is a systematic and robust feature observed throughout the sample. Key contributors include the large and rapidly reversing oil supply shocks associated with the mid-1980s oil market regime shift following the breakdown of OPEC discipline, as well as the 2007-2008 oil price surge that coincided with the onset of the Global Financial Crisis.
Core inflation tells a different story. The response is close to zero in the short run – contributions accumulate slowly and show little net movement – before rising to a peak of roughly 0.2 percentage points around horizon h = 30 (two and a half years). At first glance, the medium-term response of core inflation might be read as evidence for second-round effects, with oil supply shocks propagating into broader price pressures. However, the decomposition suggests a more cautious interpretation.
The historical support for the core inflation response in the medium run is concentrated in only a few episodes. The 1970s and early 1980s contribute large positive amounts, reflecting a period of repeated oil supply disruptions, sharp swings in oil prices, and heightened volatility in global energy markets. Episodes such as the Iranian Revolution in 1978-1979, and the Iran-Iraq War (September 1980 to August 1988) generated substantial increases in oil prices at a time when inflation expectations were already elevated and monetary policy remained relatively accommodative, creating conditions conducive to genuine second-round effects. However, even within this volatile period, some years show offsetting negative contributions, pointing to the heterogeneity of the transmission mechanism. A second cluster of contributing episodes arises in the late 1990s and early 2000s, when OPEC agreed on substantial production cuts in March 1999 that sharply reversed the oil price collapse of the previous years. A third cluster emerges in the run-up to the Covid-19 pandemic: US sanctions on Iran and the collapse of Venezuelan oil production in 2018 tightened global supply conditions, and the September 2019 missile attacks on Saudi Aramco’s Abqaiq processing facility briefly disrupted a significant fraction of global output. Outside of these specific episodes, the data offer comparatively little support for a strong and persistent pass-through from oil supply shocks to core inflation. In other words, while direct energy price effects are widespread and systematic, second-round effects appear to be much more episodic.
Figure 1. Inflation Responses to Oil Supply Shock
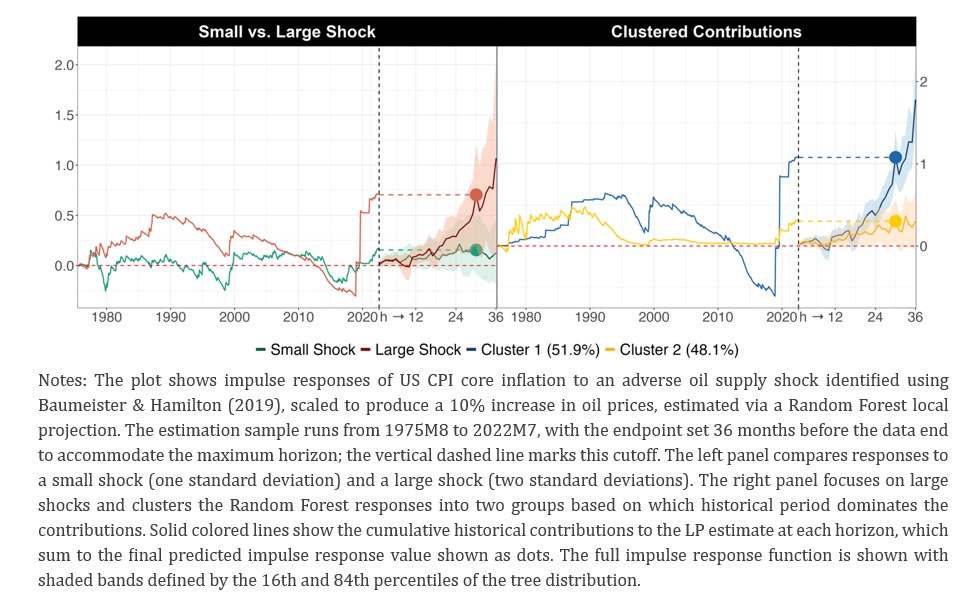
These findings point toward two important dimensions of heterogeneity that a nonlinear model is well-suited to explore: shock size and historical regime. Comparing small shocks (one standard deviation) with large shocks (two standard deviations, roughly equivalent in magnitude to the Iranian Revolution of late 1978-1979 or the Suez Canal blockage in March 2021) in Figure 2 shows that a meaningful core inflation response only materializes under the larger shock. Small disruptions, it appears, are absorbed without leaving a durable mark on underlying price pressures. For large shocks, the main contributors to the medium-run core inflation response (h = 30) are the 1970s and 1980s – when the inflationary environment was already fragile – as well as the more recent adverse supply events: the Aramco attacks in late 2019 and the Suez Canal blockage in early 2021. Clustering the responses of large shocks into two groups sharpens the picture further. One cluster of observations draws almost all of its information from the 1970s and 1980s, reflecting a high-inflation, low-anchor regime. The other cluster is driven primarily by recent episodes from the 2010s and 2020s, when supply disruptions occurred against a backdrop of much lower trend inflation. The implication is that whether an oil supply shock generates second-round effects depends not only on the size of the disruption, but also on the broader economic environment.
Figure 2. Nonlinear Responses to Oil Supply Shock
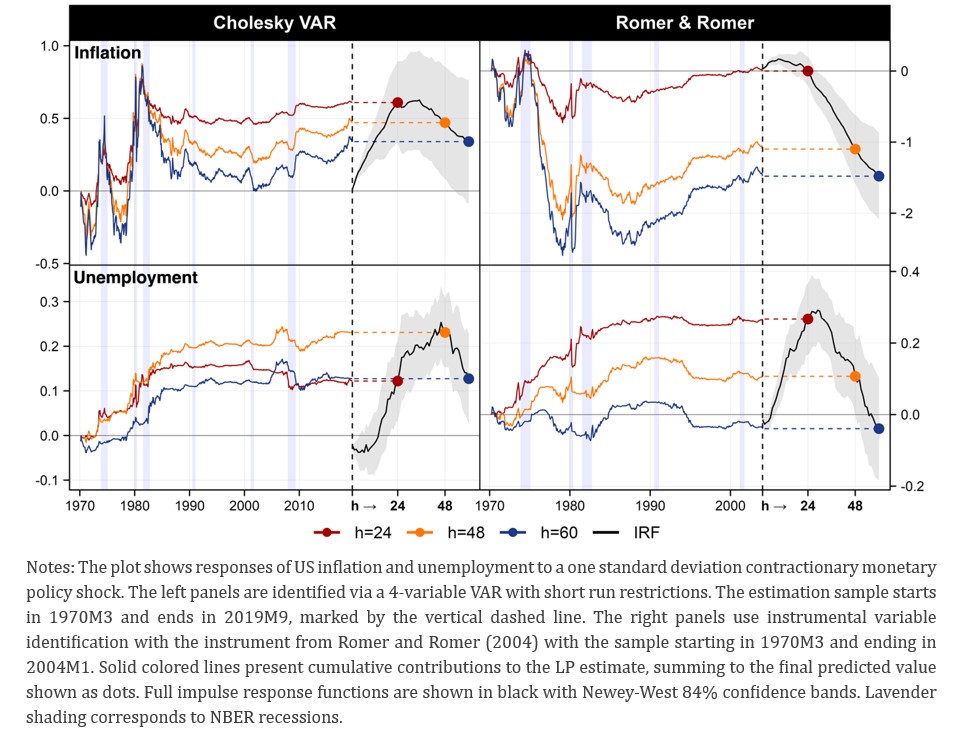
An application to monetary policy adds a further illustration of the value of the decomposition (see Figure 3). When impulse responses are identified through a Cholesky VAR, local projections often display the so-called “price puzzle,” where inflation rises after a contractionary monetary policy shock. The decomposition shows that this puzzling result is largely driven by stagflation episodes of the 1970s, where inflation increased despite monetary tightening. By contrast, when using the Romer & Romer (2004) narrative shock series, the decomposition reveals that the resulting estimates are not puzzling but still highly concentrated: the responses are supported almost entirely by a small set of periods in the mid-1970s.
Figure 3. Responses to Contractionary Monetary Policy Shocks
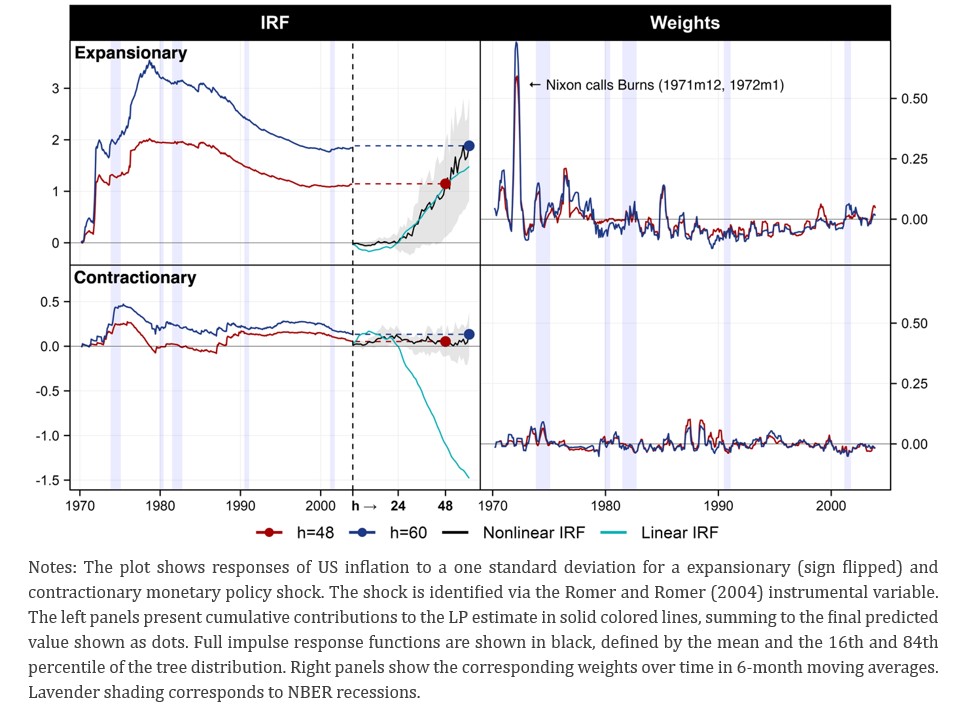
The framework also sheds light on potential nonlinearities by applying nonlinear local projections based on a Random Forest (see Figure 4). While the linear model suggests modest or puzzling effects of contractionary monetary policy shocks, the nonlinear estimates reveal a striking asymmetry: only expansionary interventions generate clear and significant responses. In particular, unexpected monetary loosening episodes in the 1970s stand out as dominant drivers of the results, most notably the well-documented episodes when President Nixon pressured Fed Chair Arthur Burns to keep interest rates low ahead of the 1972 election. By contrast, contractionary shocks contribute little evidence. This finding highlights how nonlinear methods can capture state-dependent effects that linear specifications average out, and the decomposition makes transparent which historical episodes underpin such nonlinear patterns.
Figure 4. Nonlinear Responses of Inflation to Monetary Policy Shocks
A credible impulse response estimate requires two things: a plausible economic mechanism and broad historical support. Local projections, for all their methodological appeal, have traditionally provided only the former, leaving the latter largely unexamined. The decomposition method introduced by Goulet Coulombe and Klieber (2025) closes this gap. By revealing which historical episodes underpin a given estimate, with what weight, and in what concentration, it transforms the LP from a black box into a narratively grounded and diagnostically rich tool for economic analysis.
Baumeister, C., and Hamilton, J. D. (2019). Structural interpretation of vector autoregressions with incomplete identification: Revisiting the role of oil supply and demand shocks. American Economic Review, 109(5), 1873-1910.
Goulet Coulombe, P. and Klieber, K. (2025). Opening the Black Box of Local Projections. Available at SSRN 5237376.
Goulet Coulombe, P., Göbel, M., and Klieber, K. (2024). Dual interpretation of machine learning forecasts. Available at SSRN 5029492.
Romer, C. D. and Romer, D. H. (2004). A new measure of monetary shocks: Derivation and implications. American Economic Review, 94(4):1055–1084.