

This policy brief is based on University of Cambridge, Department of Land Economy Working Paper Series No. 2026-10. Views expressed are the authors’ own and do not necessarily reflect those of the National Bank of Slovakia, the Eurosystem, the Statistical Office of the Slovak Republic, or Eurostat.
Abstract
Reliable wealth statistics are essential for designing tax policy, monitoring financial stability, and constructing Distributional National Accounts, among other purposes. Yet household wealth surveys systematically underrepresent affluent households, biasing a wide range of wealth-related statistics, including measures of wealth inequality. This policy brief summarises the findings of Waltl et al. (2026), who present evidence from a randomised field experiment embedded in the Slovak Household Finance and Consumption Survey (HFCS). The study shows that targeted participation incentives and personal interviewer contact, alongside oversampling strategies, substantially improve response rates among wealthy households and yield better coverage of the upper tail of the wealth distribution. Improved top-tail coverage not only affects measured wealth inequality and related distributional statistics, but also improves the comparability of wealth measures across the European countries that conduct the HFCS. These findings suggest that harmonising survey protocols — beyond simply harmonising questionnaires — could strengthen the quality and international comparability of official wealth statistics and improve the accuracy and reliability of Euro Area aggregates.
Wealth is substantially more concentrated at the top of the distribution than income, which makes it particularly hard to measure accurately. Because a relatively small number of households hold a disproportionate share of total wealth, failing to capture even a small fraction of these households can lead to sizeable biases in estimates of average wealth and wealth inequality (Kennickell, 2019).
The underrepresentation of affluent households is a well-known feature of household wealth surveys. Wealthy individuals are generally less willing to participate, and some of the very richest households are difficult even to identify and contact in the first place. As a consequence, survey-based wealth aggregates typically fall short of macroeconomic benchmarks and require ex post statistical adjustments based on rich lists or administrative tax records (Vermeulen, 2018; Waltl & Chakraborty, 2022).
A further complication is that countries differ substantially in how successfully they capture the upper tail of the wealth distribution. National surveys within the HFCS — the euro area’s principal source of harmonised household wealth data — differ with respect to oversampling strategies, fieldwork procedures, interviewer practices, and participation incentives, even though the underlying questionnaire is harmonised across countries. These institutional differences shape the likelihood that wealthy households end up in the final sample.
Although questionnaires are largely harmonised and countries attempt to correct for sampling differences through post-survey reweighting, these adjustments do not fully resolve the problem: cross-country differences in measured wealth inequality can still reflect differences in the effectiveness of national survey protocols in reaching affluent households, not only genuine differences in the underlying distribution of wealth. Waltl (2022) shows that the quality of the underlying survey is a key determinant of the quality of Distributional National Accounts and an important predictor of discrepancies between micro-level survey data and macro-level National Accounts. Waltl et al. (2026) extend this work by causally identifying substantial variation in measured wealth statistics that stems from differences in sampling protocols and persists even after reweighting.
This study shows that relatively simple, low-cost changes to survey design can improve top-tail coverage before any statistical correction becomes necessary. Rather than relying exclusively on ex post adjustments, targeted incentives and interviewer engagement can reduce selective non-response directly, improving both the accuracy and the international comparability of wealth statistics. To test whether better survey design can improve the representation of affluent households — and thereby the comparability of wealth statistics across countries — the authors implemented a randomised field experiment within the Slovak HFCS.
The experiment was embedded in the fifth wave of the Slovak HFCS, fielded between October 2023 and January 2024 through face-to-face interviews conducted by the National Bank of Slovakia. Using the 2021 Slovak Census of Population and Housing, the authors pre-identified 598 households likely to be wealthy — based on proxies including home ownership status, dwelling attributes, and characteristics of the household reference person — and randomly assigned them to a treatment group (299 households) and a control group (299 households).
Both groups received the standard HFCS invitation letter, signed by the National Bank of Slovakia and the Statistical Office, together with the usual €15 participation voucher. The treatment group’s letter additionally pre-announced a participation reward: a proof-quality silver collector coin, issued by the National Bank of Slovakia.
The coin was chosen deliberately rather than a larger cash sum. Because the opportunity cost of participating is higher for wealthy households, and cash incentives are known to be more effective among lower-income groups in general, a rare and prestigious collectible was expected to appeal more strongly to affluent respondents than an equivalent cash amount.1
This design allows the authors to isolate the causal effect of the incentive on participation, on the composition of respondents, and on the quality of the data they provide — while a parallel comparison across the pre-identified pool, the general population sample, and previous survey waves isolates the separate contribution of oversampling itself.
Figure 1. The Collector Coin Increased Participation Among Affluent Households
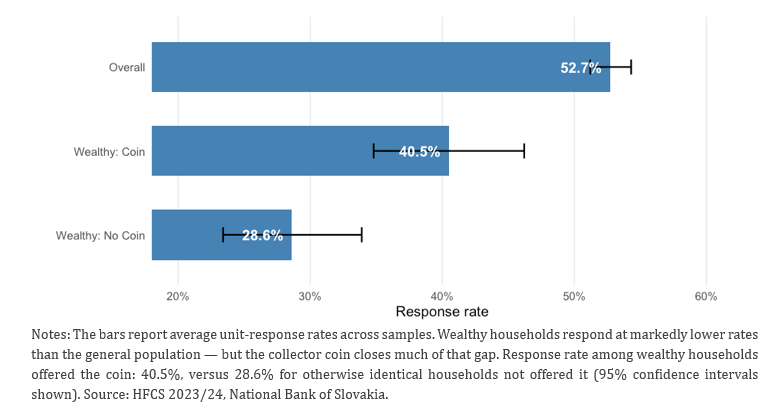
Regression estimates confirm the raw comparison in Figure 1: being offered the coin raises the likelihood of participation by roughly 12 percentage points, a highly statistically significant effect that survives an extensive set of robustness checks, including controls for interviewer characteristics and regional fixed effects.
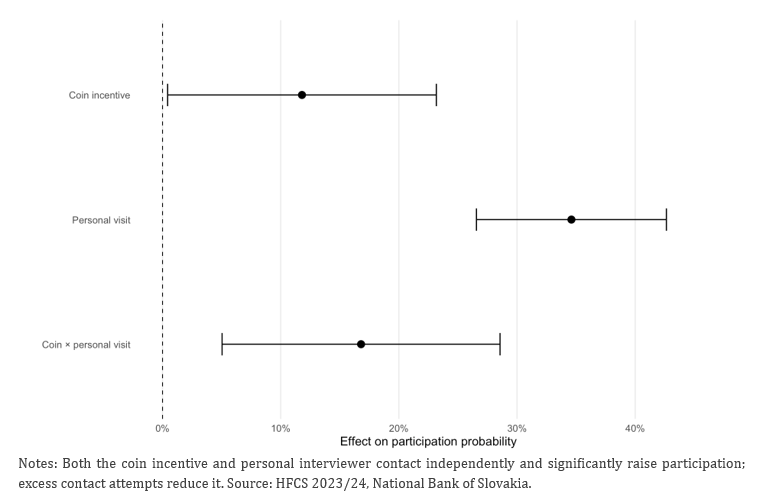
Personal interviewer contact — an interviewer following up in person after an invitation letter — has an even larger effect, of around 44 percentage points. Combining the two is more effective than either alone: the coin and personal contact operate independently rather than as substitutes, and the joint effect is reinforced by a positive interaction term (Figure 2). By contrast, participation declines the more contact attempts are required, suggesting that repeated follow-up cannot substitute for an effective first approach.
Figure 2. Marginal effects on the probability of survey participation
A natural concern is that an incentive might attract respondents who participate for the reward but answer carelessly. The authors test this directly, using interviewers’ own assessments of response reliability and the rate of ‘don’t know’ answers to asset-value questions. Neither measure differs significantly between the treatment and control groups: the coin does not measurably improve or degrade the quality of the data collected.
The coin is not equally effective across all wealthy households. Compared with the control group – a sample randomly drawn from an ex ante identical participant pool – incentivised respondents are significantly more likely to hold shares or investment funds, are more often highly educated, and report somewhat higher median net wealth, total assets and income — differences that show up in medians rather than means, indicating a shift in the composition of respondents towards greater financial sophistication rather than simply pulling in a few extremely wealthy outliers. Because these financially sophisticated households are disproportionately important for accurately measuring the top of the wealth distribution, their improved representation is valuable well beyond the modest headline gain in the response rate.
The experimental design lets the authors separate the contribution of census-based oversampling from that of the incentive, by constructing three counterfactual, population-representative wealth distributions for Slovakia: (i) a baseline relying only on standard random sampling, with no oversampling of the wealthy; (ii) a sample that adds the oversampled pool but excludes incentivised households; and (iii) the full sample, combining oversampling with incentives.
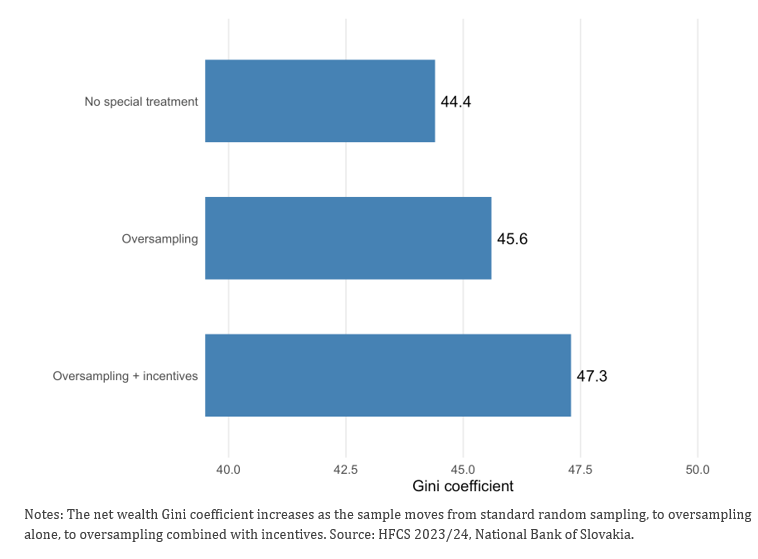
Both interventions matter, and they add up. The measured net wealth Gini coefficient rises from 44.4 in the baseline sample to 45.6 with oversampling alone, and to 47.3 once incentives are added — an overall increase of nearly 6.5% (Figure 3). Mean net wealth rises by 7.2% and coverage ratios against National Accounts financial-asset aggregates improve by around 5%, moving in the same direction across all three samples. These improvements in coverage against National Accounts benchmarks are statistically significant but modest: even the fully enhanced sample still undershoots National Accounts aggregates by a wide margin, so better survey design narrows the micro–macro gap without closing it.
Figure 3. Better top-tail coverage systematically raises measured wealth inequality
To place these gains in a European context, the authors compute the effective oversampling rate of the wealthiest 10% of households (EOW) — the gap between the theoretical and the realised share of top-decile households in the sample, benchmarked against all 22 countries currently participating in the HFCS. In the 2021 wave, Slovakia’s EOW for the top decile was −18, implying that wealthy households were in fact under-represented relative to their population share — one of the weakest results in the whole HFCS. In the 2023 wave, incorporating both oversampling and the incentive experiment, Slovakia’s EOW rose to +41, the largest improvement recorded by any HFCS country between the two waves, moving Slovakia from 20th to 11th place out of 22 countries.
Decomposing this gain shows that oversampling and incentives each contribute roughly equally: relative to the unadjusted baseline, oversampling alone raises the EOW for the top decile by about 14 percentage points, while adding incentives contributes a further 26 percentage points.
Because sampling and fieldwork protocols are not harmonised across the HFCS Network — unlike the underlying core questionnaire, which is coordinated centrally — these results suggest that a meaningful share of the cross-country variation in measured wealth inequality reflects differences in data-collection protocols rather than genuine differences in the distribution of wealth across European countries. Countries that are more successful at reaching affluent households will mechanically also report higher average wealth and greater measured concentration, independent of underlying economic conditions.
The findings carry three concrete lessons for national statistical institutes and central banks running wealth surveys, and one broader lesson for the coordination of European wealth statistics.
Ex ante improvements to survey design of this kind can also reduce reliance on unstable ex post statistical corrections, which typically require external data — rich lists or tax records — that are not consistently available or comparable across countries. Investing in fieldwork design is therefore not only a data-quality issue but a matter of ensuring that the euro area’s official wealth statistics measure genuine economic differences across countries, rather than artefacts of how each national survey is run.
EG-LMM (2020). Understanding household wealth: linking macro and micro data to produce distributional financial accounts. ECB Statistics Paper Series, No 37 / July 2020.
Hsu, J. W., Schmeiser, M. D., Haggerty, C., and Nelson, S. (2017). The effect of large monetary incentives on survey completion: Evidence from a randomized experiment with the Survey of Consumer Finances. Public Opinion Quarterly, 81(3):736–747.
Kennickell, A. B. (2019). The tail that wags: differences in effective right tail coverage and estimates of wealth inequality. The Journal of Economic Inequality, 17(4):443–459.
Vermeulen, P. (2018). How fat is the top tail of the wealth distribution? Review of Income and Wealth, 64(2):357–387.
Waltl, S. R. (2022). Wealth inequality: A hybrid approach toward multidimensional distributional national accounts in Europe. Review of Income and Wealth, 68(1):74–108.
Waltl, S. R. and Chakraborty, R. (2022). Missing the wealthy in the HFCS: micro problems with macro implications. The Journal of Economic Inequality, 20(1):169–203.
Waltl, S. R. ⓡ Jurašeková Kucserová, J. ⓡ Brokešová, Z. ⓡ Frankovič, B. ⓡ Cupak, A. (2026). Reach Me if You Can: How to Boost Participation of Rich Households in Wealth Surveys? University of Cambridge, Department of Land Economy Working Paper Series No. 2026-10.
The underlying assumption was that scarcity would make the coin particularly appealing. With only 7,200 pieces issued, the coin had a face value of €10 and an initial acquisition price of €30. By the time of the study, its market value had nearly tripled.