

We are grateful to Michal Horváth, Jochen Mankart, and Joan Paredes for their comments and suggestions. The views expressed are those of the authors and not necessarily those of the institutions the authors are affiliated with.
Abstract
What drives household inflation perceptions in the euro area, and what are the implications for ECB monetary policy? We show that food prices account for about 20% of fluctuations in HICP inflation. Yet they exert a disproportionately large influence on inflation perceptions, explaining about 40% of the variance in changes in perceived inflation— twice their contribution to headline inflation — when perceptions are modeled using food, energy, and core inflation rates. The pattern is robust across pre-2020 and post-2020 sub-samples and not only holds at the euro area aggregate but also across individual member states. Drawing on Hahn and Marenčák (2026), who demonstrate in a New Keynesian model with boundedly rational consumers that optimal monetary policy should place greater weight on sectors that strongly affect inflation perceptions, we argue that a strong focus on core inflation in ECB policymaking may place insufficient weight on food-price developments and that these developments should be taken into account carefully.
Which prices shape inflation perceptions, i.e., consumers’ perceptions of current inflation, the most? This question matters because optimal monetary policy should pay particular attention to these prices, as demonstrated by Hahn and Marenčák (2026) in a New Keynesian model with boundedly rational consumers.
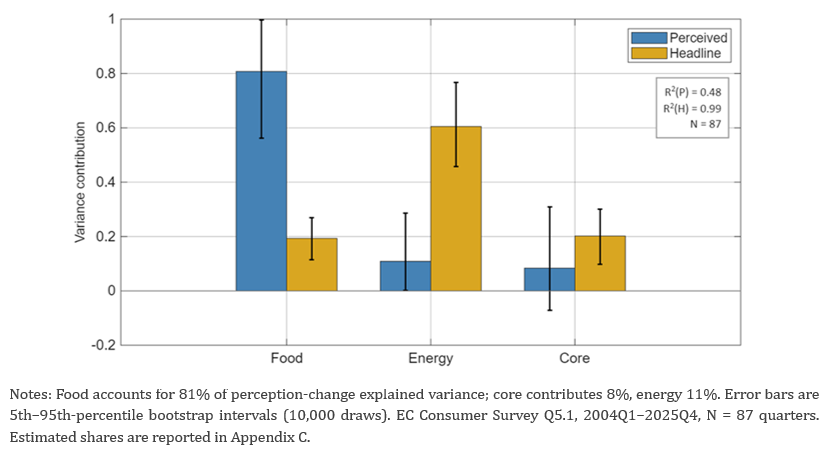
Hahn and Marenčák (2026) use UK data to show that fluctuations in food prices shape perceived inflation in the UK to a large extent. The present note extends this empirical finding to the euro area as well as to individual euro area member countries. In particular, food prices account for about 20% of fluctuations in headline HICP inflation over 2004–2025. Yet their influence on inflation perceptions is disproportionately large, accounting for roughly 80% of the explained variance and 40% of the total variance in changes in perceived inflation when changes in inflation perceptions are regressed on changes in food, energy, and core inflation rates. Together with the results from the structural model in Hahn and Marenčák (2026), this empirical finding suggests that food prices should be an important input into ECB monetary policymaking and that food-price developments deserve greater consideration alongside core inflation measures.
This note also shows that energy prices contribute less to inflation perceptions. For the euro area, roughly 60% of the variance in HICP inflation can be attributed to energy prices, whereas only 5% of the total variance in inflation perceptions is due to energy prices. Thus, the analysis in Hahn and Marenčák (2026) suggests that ignoring these prices may be less consequential.
We are not the first to use survey data to examine the determinants of consumers’ inflation perceptions. Other authors have also found systematic and sizable differences of perceived inflation from actual rates (Lein and Maag, 2011; Detmeister et al., 2016; Abildgren and Kuchler, 2021). A potential reason for why food prices influence perceptions strongly is that individuals observe these prices frequently, which is a mechanism highlighted by Jonung (1981) and Georganas et al. (2014). A survey of the literature about consumers’ expectations of future inflation as well as perceptions of current inflation can be found in D’Acunto and Weber (2024). In this note, we focus solely on consumers’ perceptions of current inflation and do not consider their expectations of future inflation.1
We use two main sources of data. First, the European Commission Consumer Survey provides quarterly, quantitative measures of how households in the euro area perceive inflation at the aggregate level, covering the period from 2004 to 2025.2 This long span includes both tranquil periods and major economic shocks, such as the global financial crisis and the post-pandemic surge in inflation (see Figure 1). Second, the ECB Consumer Expectations Survey provides higher-frequency, monthly data, but over a shorter period that begins only in April 2020.3 Importantly, it reports perceptions separately for six individual euro area countries — Belgium, France, Germany, Italy, the Netherlands, and Spain — and our analysis uses the data available through December 2024.
We regress changes in perceived inflation on changes in the year-on-year inflation rates of three HICP components: food, energy, and core inflation. From this regression we compute a variance decomposition, which quantifies how much of the variation in perceived inflation is associated with each of the three components (see Appendix B for details). As a reference point, we also calculate variance decompositions for regressions in which headline inflation is the dependent variable.
Figure 1. Euro area aggregate perceived inflation (EC Consumer Survey Q5.1 quantitative estimates, red) against HICP components
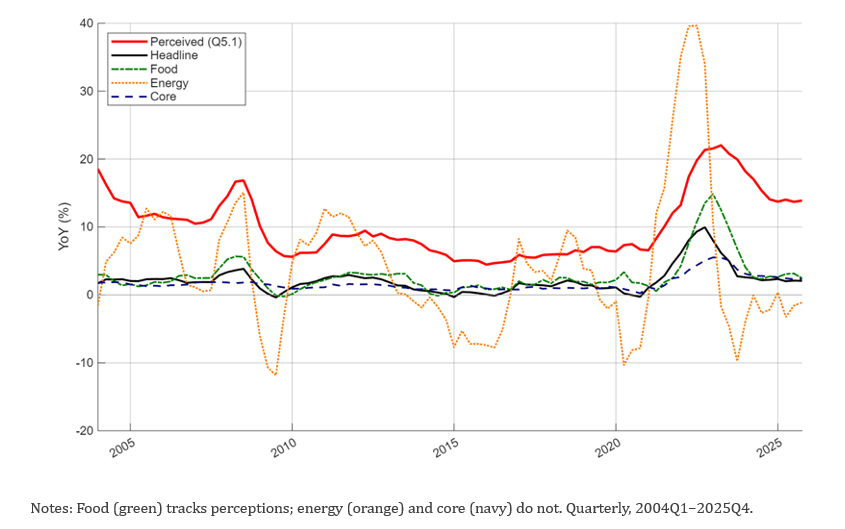
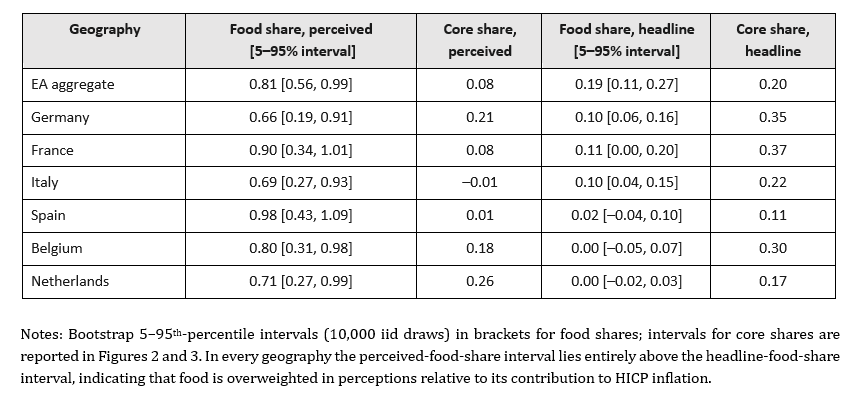
The findings for the euro area are striking, as shown in Figure 2. In a regression of changes in perceived inflation on changes in the sectoral rates, food accounts for 81% of the explained variance in changes in inflation perceptions, while energy and core contribute 11% and 8%, respectively. Given the regression fit (R² = 0.48), food therefore explains about 39% of the total variance of changes in perceived inflation. By contrast, food plays a much smaller role for actual HICP inflation. When the change in HICP inflation is used as the dependent variable, the decomposition is essentially mechanical (R² ≈ 0.99), with explained variance shares virtually coinciding with total variance shares. Fluctuations are dominated by energy (60%), while food accounts for only 19%.4
The sample spans a period of unprecedented food-price volatility in 2021–2023, raising the concern that the strong influence of food on perceptions could reflect a crisis-specific phenomenon rather than a normal-times feature. Repeating the decomposition on the pre-2020 sample (2004Q1–2019Q4), which excludes the post-pandemic shock entirely, yields a food share of 43% of the total variance in perception changes. The post-2020 sample (2020Q2–2024Q4) delivers a qualitatively similar estimate (38%). The pre-2020 evidence therefore suggests that the importance of food inflation in shaping perceptions is not solely driven by the 2021–2023 episode.
Figure 2. EA aggregate variance decomposition of perceived and headline inflation, first-differenced specification
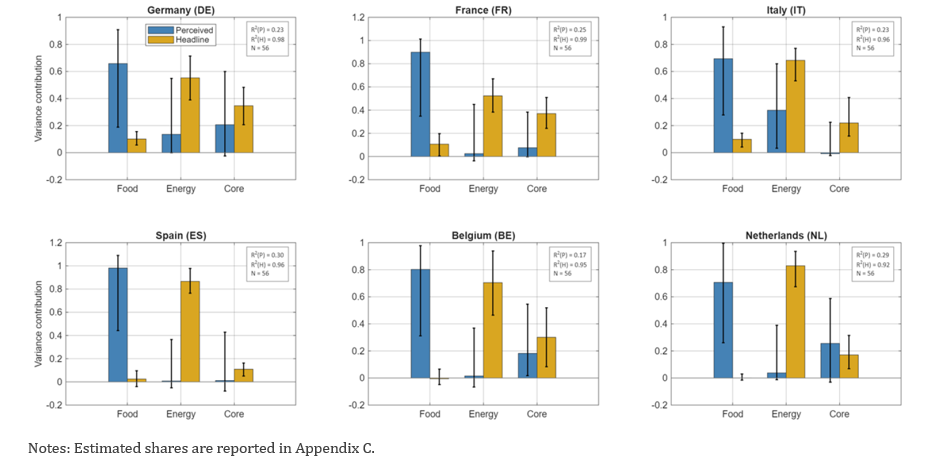
The country-level regressions are consistent with the aggregate results. The share of explained perception-change variance attributable to food inflation ranges from about 66% in Germany to 98% in Spain across the six countries covered by the ECB CES, while the contributions of core and energy inflation are generally small (Figure 3). In all countries, food inflation accounts for a larger share of the explained variance in inflation perceptions than of the variance in headline HICP inflation. By contrast, energy inflation contributes little to fluctuations in inflation perceptions.
Figure 3. Variance decomposition of explained changes in perceived inflation by country
To discuss the role of food prices in monetary policymaking, we turn to the literature on which measures of inflation central banks should focus. According to a classic result by Aoki (2001), central banks should place greater weight on stabilizing inflation in sectors with sticky prices. The underlying mechanism is that, under staggered price setting, inflation volatility generates inefficient relative price dispersion and thereby distorts consumption allocation across goods. Hahn and Marenčák (2026) extend this result by showing that central banks should assign greater importance to prices that strongly influence inflation perceptions. The intuition is that distortions from staggered price setting are amplified when households pay close attention to certain goods and respond strongly to their price signals. By contrast, when attention to a sector is limited, relative price fluctuations, even under high or volatile inflation, are less distortionary.
What are the implications for ECB policymaking?5 Gautier et al. (2024) document that euro area food prices adjust more frequently than core prices. When sales are excluded, 10.4% of processed-food prices and 24% of unprocessed-food prices change each month, compared with 8.5% for prices overall. This, by itself, would suggest that food prices should receive a relatively modest weight in monetary-policy decisions. However, the results in this note indicate an important role of food prices for inflation perceptions. Hahn and Marenčák (2026) show for the UK that, even when food prices are more flexible than core prices, the effect of high degrees of attention dominates and thus optimal monetary policy should take fluctuations in food prices seriously. Hence, these findings suggest that food prices may warrant greater weight in the ECB’s policy assessment than implied by their relatively high frequency of adjustment.6
For energy, by contrast, the implications are different. The relatively small influence of energy prices on inflation perceptions, both at the country level and for the euro area as a whole, suggests that looking through energy price increases may be less problematic. However, in the current environment of elevated oil prices, consumer attention may shift towards energy prices. If so, the case for looking through energy price fluctuations becomes less clear-cut for the European Central Bank. These findings also speak to the choice between headline and core inflation as guides for monetary policy. Central bankers often consider core inflation to be more informative about underlying inflation trends than headline inflation because headline inflation may be affected by temporary fluctuations in food and energy prices, which cannot easily be influenced by monetary policy (see Mishkin, 2007). Our research suggests that, despite these considerations, food prices may deserve greater attention in monetary policymaking than energy prices because of their much stronger influence on inflation perceptions.
Another implication is that due to the particular importance of food prices for consumers, the ECB’s communication may need to engage more directly with food price developments. Explaining whether food price movements are transitory or persistent, how they relate to the inflation target, and what the ECB can and cannot do about supply-driven food inflation could help manage perceptions in ways that discussions of headline or core inflation alone cannot. At the same time, a stronger focus on food prices in communication may reinforce their salience for households and thereby amplify their influence on inflation perceptions. This effect might make inflation perceptions more volatile.
This note has presented evidence for several euro area countries, as well as for the euro area as a whole, that food prices are important for understanding fluctuations in inflation perceptions, whereas energy prices appear to play a more limited role. Together with the theoretical results in Hahn and Marenčák (2026), these findings suggest that it is important for the ECB to focus on a measure of price stability that includes food prices when pursuing its mandate. Moreover, the ECB may acknowledge the role of food prices not only in the policy target but, potentially, in communication as well.
Table A1 reports, by geography, the augmented Dickey–Fuller p-values for perceived inflation and the three HICP components as well as the Engle–Granger cointegration p-value for the perception regression in levels. The Engle–Granger test was implemented by estimating the levels regression of perceived inflation on food, energy, and core inflation and applying a residual-based ADF test using MacKinnon (2010) critical values for a four-variable system.
Table A1. Specification diagnostics
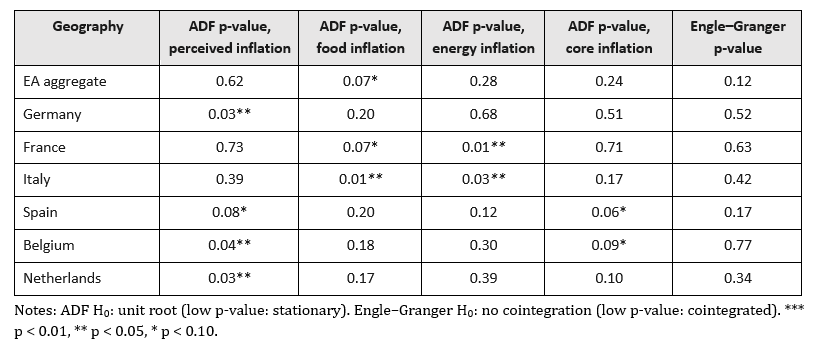
The table shows that, for all countries and the euro area as a whole, the ADF test fails to reject a unit root in multiple time series. Moreover, for all geographies, the Engle-Granger test does not find evidence of cointegration. Because several variables exhibit nonstationary behavior in levels and no evidence of cointegration is found, the analysis proceeds in first differences. We have confirmed that, after first-differencing, no perception regressor (food, energy, core) or dependent variable (perceived inflation) is classified as non-stationary by the joint AFD and KPSS criterion in any geography.
The decomposition follows Hahn and Marenčák (2026), Appendix G. Let X denote the T×3 matrix of regressors (changes in food, energy, and core inflation) and β the 3×1 vector of OLS coefficients from the perception regression. Define
F = Cov(X) ⊙ (β β′),
where ⊙ denotes element-wise multiplication. The variance of fitted values equals the sum of all entries of F. The contribution of sector s is defined as the sum of the entries in row s of F, divided by the sum of all entries of F. The resulting shares sum to 100% of explained variance, rather than of total variance in perceptions. Shares may be negative if sufficiently negative covariance terms outweigh the sector’s own variance contribution.
Table C1 reports the first-differenced variance decomposition by geography, showing the food and core contributions to perceived and to headline HICP variance.
Table C1. First-differenced variance decomposition shares, by geography
Abildgren, K. and A. Kuchler (2021). “Revisiting the inflation perception conundrum.” Journal of Macroeconomics 67, 1–19.
Aoki, K. (2001). “Optimal monetary policy responses to relative-price changes.” Journal of Monetary Economics, 48(1), 55–80.
Bobeica, E., G. Koester, and C. Nickel (2025) “When groceries bite: the role of food prices for inflation in the euro area.” The ECB blog, 25 September 2025.
D’Acunto, F. and M. Weber (2024). “Why survey-based subjective expectations are meaningful and important.” Annual Review of Economics, 16, 329–357.
Detmeister, A., D. Lebow, E. Peneva, et al. (2016). “Inflation perceptions and inflation expectations.” FEDS Notes 2016 (1882), 1–7.
European Central Bank (2024). “ECB Consumer Expectations Survey: Methodological overview.” ECB Statistics.
European Commission (2025). “Business and Consumer Surveys.” DG ECFIN.
Gautier, E., C. Conflitti, R. P. Faber, B. Fabo, L. Fadejeva, V. Jouvanceau, J.-O. Menz, T. Messner, P. Petroulas, P. Roldan-Blanco, F. Rumler, S. Santoro, E. Wieland, and H. Zimmer (2024). “New Facts on Consumer Price Rigidity in the Euro Area.” AEJ: Macroeconomics 16(4), 386-431.
Georganas, S., P. J. Healy, and N. Li (2014). “Frequency bias in consumers’ perceptions of inflation: An experimental study.” European Economic Review, 67, 144–158.
Hahn, V. and M. Marenčák (2026). “Inflation perceptions and monetary policy.” mimeo.
Jonung, L. (1981). “Perceived and Expected Rates of Inflation in Sweden.” American Economic Review, 71(5), 961–968.
Lein, S. M. and T. Maag (2011). “The formation of inflation perceptions: Some empirical facts for European countries. ” Scottish Journal of Political Economy 58 (2), 155–188.
MacKinnon, J. G. (2010). “Critical Values for Cointegration Tests.” Queen’s Economics Department Working Paper No. 1227, Queen’s University.
Mishkin, F. S. (2007), “Headline versus core inflation in the conduct of monetary policy.” Speech in Montreal, Canada.
Parker, M. (2025) “Has the heatwave been driving you nuts?” The ECB blog, 13 July 2025.
In the model of Hahn and Marenčák (2026), households’ inflation expectations are given by the rational expectations of their future inflation perceptions. Consequently, inflation expectations inherit the overweighting of food prices.
For a description of the dataset, see European Commission (2025).
For a description of the dataset, see European Central Bank (2024).
Using a bootstrap procedure, we have confirmed that the food shares of total variance differ significantly between the perception and headline inflation decompositions at the 10% level.
An interesting discussion of the significance of food prices for the ECB can be found in Bobeica et al (2025).
In the future, climate change may make food prices even more volatile (see Parker, 2025). Consequently, consumers’ attention to food prices may intensify further.