

This Policy Brief is based on Arrigoni, Bénétrix, McIndoe-Calder, Romelli (Open Economies Review, 2025). The views expressed are those of the authors and do not necessarily reflect those of the Banque de France, the European System of Central Banks, or the Economic and Social Research Institute.
Abstract
This Policy Brief explores the link between household financial holdings and demographic characteristics through the lens of a novel dataset that combines granular asset-level information from the Securities Holdings Statistics (SHS) with household-level characteristics from the Household Finance and Consumption Survey (HFCS). By integrating these two rich yet underutilised datasets, our framework helps overcome the limited availability and accessibility of administrative microdata for cross-country comparisons within the euro area.
As an illustration of its potential, we analyse how portfolio risk and returns vary with education levels. We show that more educated households exhibit higher risk tolerance and achieve higher returns. Understanding household finances is relevant, given its implications for many economic decisions related to consumption, savings and labour supply, that condition macro-financial linkages. Therefore, the insights derived from this augmented dataset can support policymakers seeking to assess the consequences of household decisions and provide researchers with new tools to investigate the drivers of portfolio composition and performance at the household level.
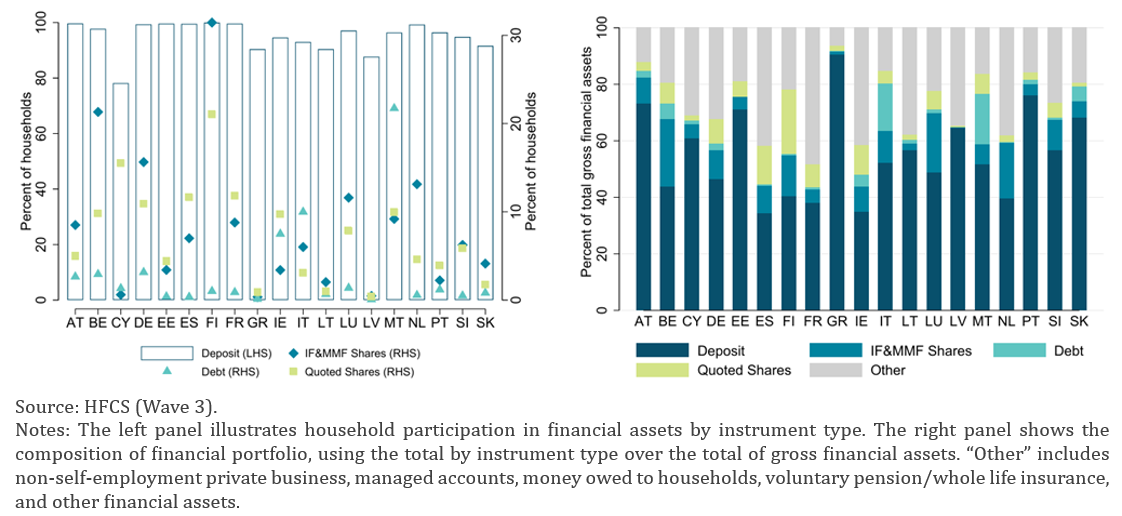
External asset holdings vary substantially across countries and over time due to differences in the structure of their financial systems and associated confounding factors. When the focus is on international investments, most research explores these (typically international investment positions, flows, and valuation effects) from an aggregate, country-level perspective. As a result, less is known about the link between sectoral characteristics and the heterogeneity in cross-border asset holdings, with even less attention being paid to the household sector. This leaves a gap in the literature, which is important to address for two reasons. First, household decisions affect the macroeconomy. Household income determines aggregate private spending, saving decisions affect monetary policy transmission, indebtedness levels influence aggregate output and financial stability. Together, differences in net wealth holdings affect wealth inequality. Second, households hold a non-negligible share of total financial assets. As Figure 1 shows, almost all households have deposits but participation rates in investment assets are lower and more heterogeneous across countries. However, the value of riskier investments (Debt Securities, Quoted Shares, and Investment Funds (IF) & Money Market Funds (MMF) Shares) constitutes a significant portion of households’ financial portfolios. Euro area households hold 20.1% of their gross wealth as financial assets (ECB-HFCN, 2023).
Figure 1. Financial participation (left) and financial portfolios (right)
A key reason behind the persistence of this gap in the literature is the limited availability of detailed data on household financial investments. With a few exceptions, administrative data in euro area countries are generally not widely accessible, preventing cross-country comparisons. As a second-best solution, we propose a methodology that links two rich but underutilised datasets available across euro area countries:
Why combine SHS and HFCS? SHS provides a detailed disaggregation on security holdings at the sectoral level (household in our case) but does not include any demographic information on who holds these assets. In HFCS, we have detailed information on household characteristics, but instead limited information on the valuation and risk associated with these asset holdings. Merging the two complementary datasets provides a more wholistic view of household financial asset holdings, comparable across a panel of euro area countries. We match country-level valuation and risk measures computed from the SHS to household portfolios in the HFCS to construct household-specific return and risk information.
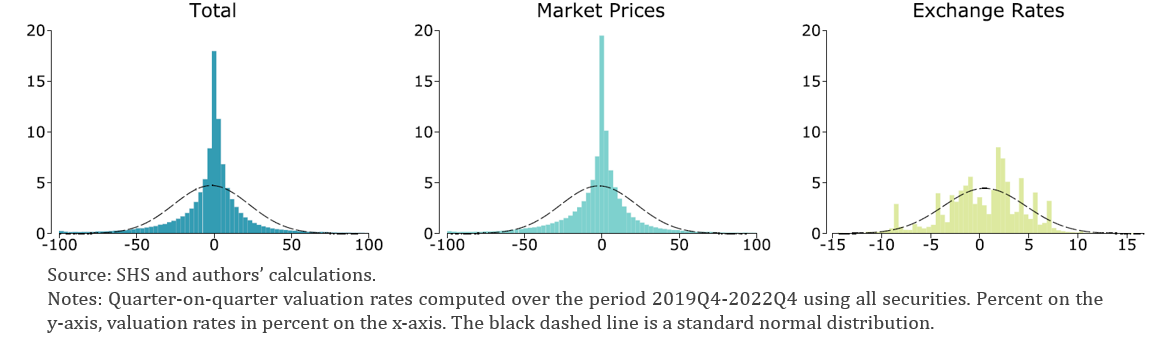
We merge the two databases based on the observation that, for most countries, households’ aggregate portfolio allocations across the three asset classes are similar in the two datasets. We proceed in three steps. First, we compute quarter-on-quarter valuation rates (valuation amount at time t over stock amount at time t-1) at the security level using SHS data over the period 2019Q1-2022Q4. Due to the high level of detail available in SHS, we can compute this measure for total valuation as well as for valuations related to market price changes or exchange rate movements. Most of the variation and gains in our sample come from the former (Figure 2).
Figure 2. Distribution of valuation rates from SHS
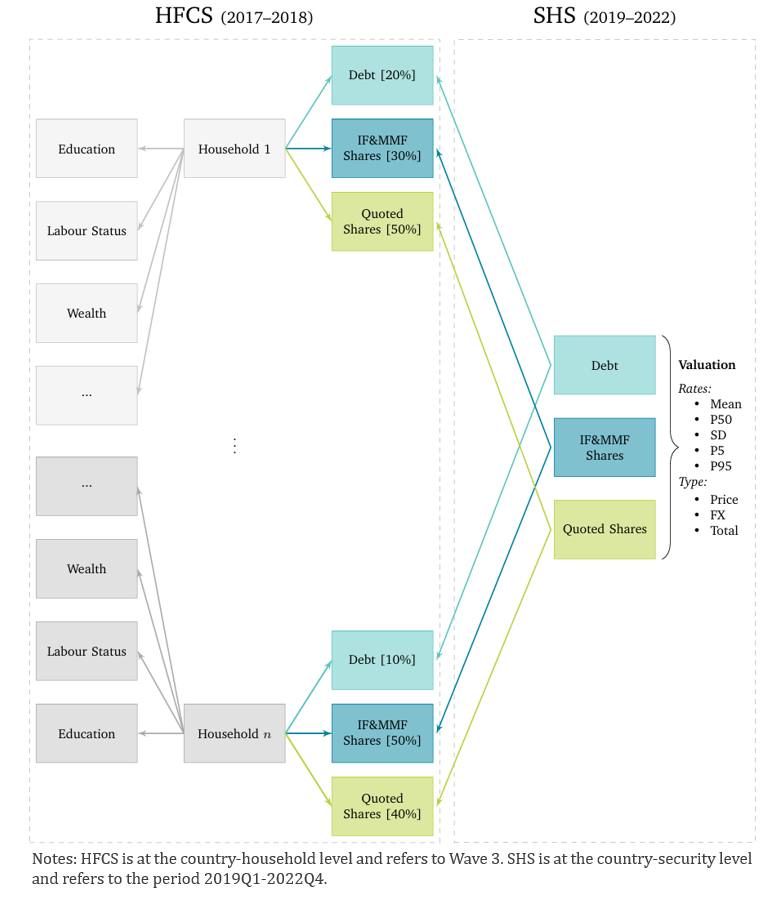
Second, we compute summary statistics of these valuation rates (i.e., mean, median, standard deviation, 5th and 95th percentiles) and allocate them to households in HFCS. To do so, we assume that all households within the same country and within a given instrument type invest in the same pool of securities. Heterogeneity arises from differences in portfolio allocations across instruments, which are observed in the HFCS. For example, consider quoted shares. Under this assumption, all households in country c that invest in quoted shares hold proportional claims on the same aggregate national equity portfolio. Individual exposure nevertheless differs because households allocate different shares of their wealth to equities; for instance, household c1 allocates 50% of its portfolio to quoted shares, whereas household c2 allocates only 20%. We make this assumption based on evidence from the HFCS showing that, while household participation in risky assets increases with net wealth, the share of risky assets in total financial wealth remains relatively stable. Figure 3 provides a visualisation of the merging. Third, we compute household-level return and risk measures for each country as a weighted average of the SHS summary statistics using HFCS household-specific portfolio shares as weights. Our final sample consists of households that hold at least two of the asset classes (5,266) and countries with at least 50 households, i.e., Austria, Belgium, Germany, Spain, Finland, France, Ireland, Italy, Netherlands, Portugal.
Figure 3. Visual HFCS-SHS merging scheme for country c
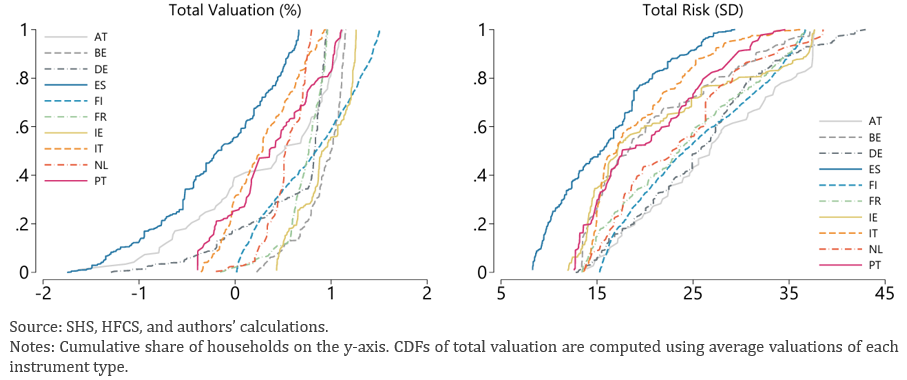
This augmented dataset allows us to study how households’ investment returns and risk exposures vary both between and within countries. To visualise the derived household-level return and risk metrics, Figure 4 plots the Cumulative Distribution Functions (CDFs) of total valuation effects and risk for a sample of euro area countries. The CDF provides the share of households (probability) for which the variable of interest, i.e., the valuation rate or the risk measure, is less than or equal to a certain value x (on the x-axis). Household return-risk profiles differ substantially between countries, with some (e.g., Spain) showing low return and low risk, while others (e.g., Ireland, Finland) show both high return and high risk. Within each country, the dispersion of household outcomes also varies significantly, as highlighted by the width and shape of the CDFs. Since our analysis focuses on households holding at least two out of the three financial instruments, the results effectively describe the diversification patterns of households that participate in risky asset markets.
Figure 4. Cumulative Distribution Functions (CDFs) of total valuation (left) and risk (right)
The value added of the augmented dataset is that we can condition the computed household-level return and risk metrics on household-level demographics. To illustrate the framework’s potential, we examine how education relates to financial investment. We split our sample between households with high (tertiary) and low (non-tertiary) levels of education, exploiting the education level of the reference person in the household. Figure 5 shows the CDFs for the euro area aggregate, using all the households and countries in our sample, and distinguishing by education level. We observe that more educated households are not only more likely to experience positive investment returns but also exhibit a higher tolerance for risk. Interestingly, we find that differences in return and risk primarily come from portfolio composition and market price movements, rather than from exchange rate fluctuations.
Figure 5. CDFs of return and risk, by education level, euro area
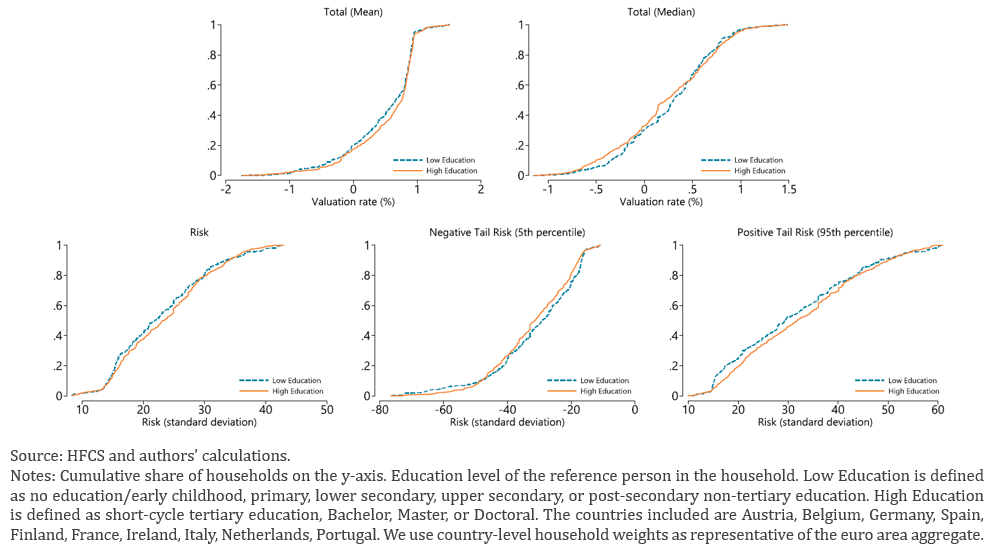
To generalise our analysis and control for dynamics in the local financial system (i.e., domestic market capitalisation, credit, and deposits) and macroeconomic conditions (i.e., NEER, government bond yields, GDP growth, and inflation), we conduct a second exercise on the panel of euro area countries using point estimates from regressions. In this case, alongside the country and household dimensions, we exploit the time dimension as well by using return and risk measures at quarterly frequency, constructed from SHS summary statistics computed each quarter and HFCS data for wave 3, which remains constant over time. In line with the findings previously presented, we find that education is strongly associated with higher returns. Households with higher education benefit from a total return that is 31.4% higher compared to households without tertiary education.
Because education is correlated with financial wealth, part of this relationship operates through wealthier households having more scope to diversify into risky assets. This aligns with established evidence that risk tolerance rises with wealth (e.g., Calvet and Sodini, 2014; Liu, Yang, Cai, 2016). These patterns may also reflect other factors, such as the presence of illiquid business wealth among some households.
By complementing detailed information on domestic and cross-border financial investments at the aggregate level with granular information on individual household characteristics, this paper offers a novel and comprehensive perspective on the link between cross-border financial holdings and demographic characteristics of euro area households.
While we illustrate the potential of our framework by looking at education, the implications extend beyond this single example. Disaggregated information on household financial asset holdings enables researchers and policymakers to detect emerging risks, understand how shocks propagate across household types, and design policies that support both welfare and financial stability. The insights of our paper are directly relevant for current European policy debates. European households hold markedly less risky portfolios than those in the United States. Moreover, European households hold about 70% of their savings (worth a total of €10 trillion) in bank deposits (European Commission, 2025). Recent policy reports note the relatively high financing costs faced by young and innovative firms in the EU (Draghi, 2024; Letta, 2024; Noyer, 2024; Noyer and Kukies, 2026). Mobilising household savings toward productive investment has therefore become a central policy objective. The Savings and Investments Union (SIU) initiative (European Commission, 2025) aims to foster greater participation in capital markets by broadening investment options and improving financial literacy. Indeed, financial education is one lever to increase participation, further illustrating why detailed household level data such as ours is essential for effective policy design and evaluation.
Calvet, Laurent E., and Sodini, Paolo (2014): “Twin picks: Disentangling the determinants of risk‐taking in household portfolios.” The Journal of Finance 69.2, 867-906.
Draghi, Mario (2024): “The Future of European Competitiveness”.
ECB-HFCN (2023): “Household Finance and Consumption Survey: Results from the 2021 wave.” ECB Statistics Paper.
Letta, Enrico (2024): “Much More Than a Market”.
Liu, Xuan, and Yang, Fang, and Cai, Zongwu (2016): “Does relative risk aversion vary with wealth? Evidence from households׳ portfolio choice data.” Journal of Economic Dynamics and Control, Elsevier, vol. 69(C), pages 229-248.
Noyer, Christian (2024): “Developing European Capital Markets to Finance the Future”.
Noyer, Christian, and Kukies, Jörg (2026): “The European Savings and Investment Union”.
European Commission (2025): “Savings and Investments Union Strategy”.