The views expressed in this paper are the authors‘ alone and do not necessarily reflect the views of the Croatian National Bank or European Central Bank.
Energy is a vital input for the corporate sector as it is embedded in its entire business process, making its price and availability also important for the functioning of the economy. Due to its multiplicative effect, energy shocks can impair corporate activity which can then spill to rising prices, economic growth deceleration and financial stability risks. Using data for Croatia, the presented analysis confirms the sensitivity of the corporate sector performance to the energy shocks. However, regardless of the sudden rise in the interest in energy as a topic in 2022, energy policy should be considered beyond the current macro financial and geopolitical juncture since it is an important element of building a clean and sustainable economy. Technology change seems to be the main long-term strategy available for the development of sustainable corporate operations and decreasing economies‘ exposures to energy shocks.
A sharp increase in energy prices together with the fear of shortages represented a strong shock for the corporate sector in 2022, comparable with the sudden stop of operations in 2020. Prices of raw materials and commodities started increasing in 2021 when “downstream” bottlenecks experienced due to epidemiological stringency were slowly replaced with “upstream” delays caused by the overwhelmed infrastructure in international trade. Driven largely by oil prices, a mild increase in energy prices was recorded already in 2021 which resulted in increased energy costs, from 2.3% to 2.5% of corporate revenue. However, because of the geopolitical shock, energy prices spiked in 2022 with electricity and gas initially expected to increase in EU by around 400% and 250% in 2022 (Figure 1 and Figure 2).
The importance of energy price and availability arises from its multiplicative effect on the economy, and therefore its importance goes beyond the current macro-financial and geopolitical juncture. Besides explicit energy costs, an energy price increase leads to other material costs increase and subsequently to higher producer and consumer prices. Further increases in the prices of energy and especially its shortage could trigger a “disorderly adjustment” leading to capacities decrease (fixed assets sell-off, labour force decrease) or a return to a less efficient and environmentally unfriendly production process. All of this would lead to an increase in financial stability risks and a deceleration of economic growth in the long term.
This note contributes to the energy and environment analytical and policy work streams. By providing an insight into corporate energy sensitivity, the finding from this note can be used for energy considerations in general, especially in lieu of searching for a new energy paradigm and increasing efforts to build a cleaner and more sustainable energy system. Based on microdata, the analytical part of the note could benefit micro and macro prudential surveillance efforts. Also, the techniques presented can be used for the corporate sector stress testing and therefore help in creating a more comprehensive stress test framework.
Figure 1: Energy prices and energy intensity of the corporate sector
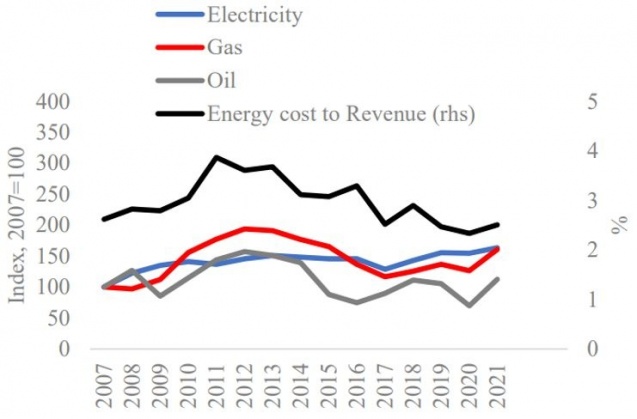
Source: FINA (Financial agency) and Eurostat
Figure 2: Energy costs forecast
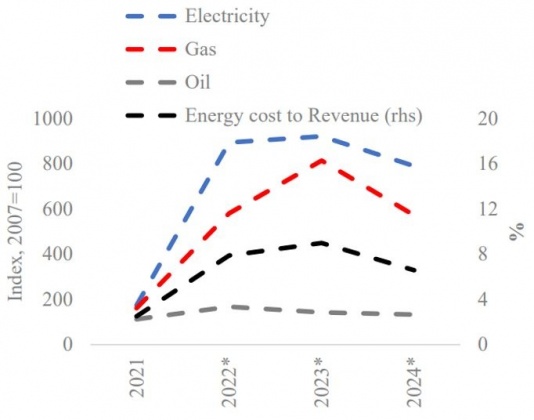
Note: *Forecasted values without presumed government intervention or mitigation by the corporates. Eventually, energy price increase was smaller than expected in September 2022. Revenue growth is forecasted at 20%, 0% and 10% in 2022, 2023 and 2024.
Source: Authors‘ calculation, ECB data (ECB Economic Bulletin, Issue 4/2022).
Energy is a vital input for the corporate sector, as it is embedded directly and indirectly in all of its activities. Energy costs appear as direct charges for energy corporates used and indirect increases in other material costs. Direct energy costs amounted to around 2.5% of corporate revenue in 2021 (an increase compared with 2.3% in 2020). According to this common criteria energy intensity1 varies significantly between economic activities. Using the data for 2021, economic activities can be grouped in three classes regarding energy intensity: High (Transport, Tourism and Power supply), Middle (Manufacturing, Agriculture and Construction) and Low (Communication, Trade and Other) (Figure 3). However, apart from direct energy costs, other material costs are also to some extent sensitive to energy prices. Therefore, the potential threat of energy shocks for depleting the revenue and pushing the corporates into the loss-making territory is significant, especially when having in mind that material costs amount to around 70% of revenue (Figure 4).
Figure 3: Direct energy intensity in economic sectors
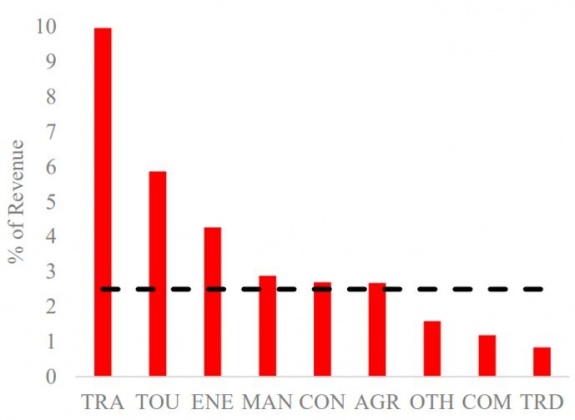
Source: Authors‘ calculation, FINA data
Figure 4: Corporate sector EBIT contributions2
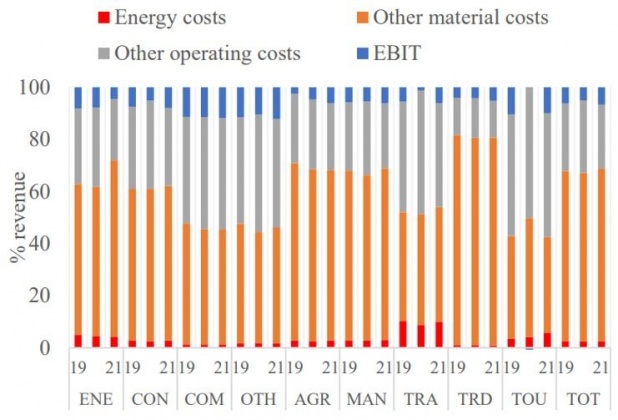
Source: Authors‘ calculation, FINA data
Looking at the historical developments, the direct energy intensity of the corporate sector increased during the recession (2009-2014) and decreased afterward. However, since looking at the nominal values in current prices might be misleading, we look at the decomposition as well.3 It seems that the main driver of energy intensity happened within companies and not between them (changing composition between economic sectors) (Figure 5). Looking into more detail, the contributions of Energy prices, Output prices and Output volume have the expected sign (positive, negative, negative). However, it seems that companies in Croatia did manage to decrease the energy consumption used for producing a unit of output in the period 2007-2021 (Figure 6). Therefore, in constant prices, the corporate sector became less energy intense, or from another angle, its energy productivity increased.
Figure 5: Corporate sector energy intensity and contributions to the change
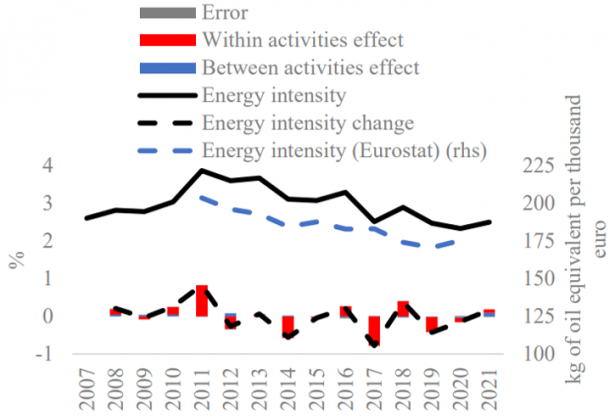
Source: Authors‘ calculation, Eurostat and FINA data
Figure 6: Corporate sector energy intensity change contributions
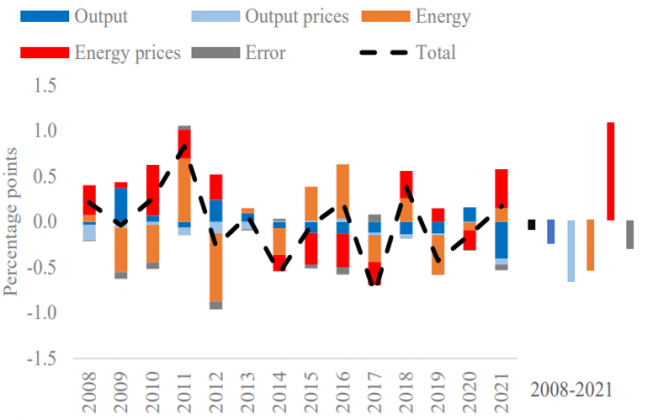
Source: Authors‘ calculation, FINA data
Energy shocks for the corporate sector can materialize in two forms: Energy price increase and Energy shortage. In the first round, the mechanics of these two shocks are different, however, depending on the structure of the market and shock intensity, both can result in price increase and business activity decrease. We proceed by looking at the effects of the two shocks in isolation and assuming no mitigation techniques or technology change in the short run.
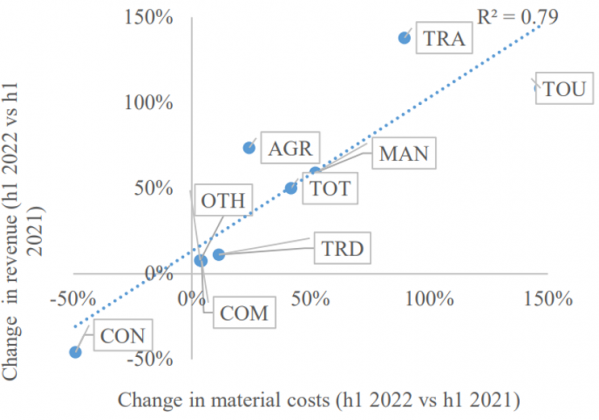
Since energy is mostly a variable input (generating variable cost), its price increase leads to increase in marginal cost and generates pressure for output price increase.4 However, whether the output prices will increase, depends on the demand, market structure and individual corporates` market power (ability to pass through the cost to clients). According to the Zagreb Stock exchange data, during the first half of 2022, material costs increased by around 50% compared with the first half of 2021. As expected, the strongest increase in material costs was recorded in companies from energy-intense activities: Transport and Tourism (Figure 7).
An energy price increase leads to a direct increase in energy costs and an indirect increase in other material costs. According to the simple econometric model used, for each percentage point increase in explicit energy costs, other material costs increase by around 0.13% (the model is explained in the Technical Box). Therefore, since other material costs make up to 66% of revenue (2021 data) energy price increases without the possibility to pass through the costs to clients, can expose the corporate sector to losses, as the costs increase would consume a significant part of the revenue (Figure 8).
Figure 7: Energy intensity and material costs increase in H1 2022
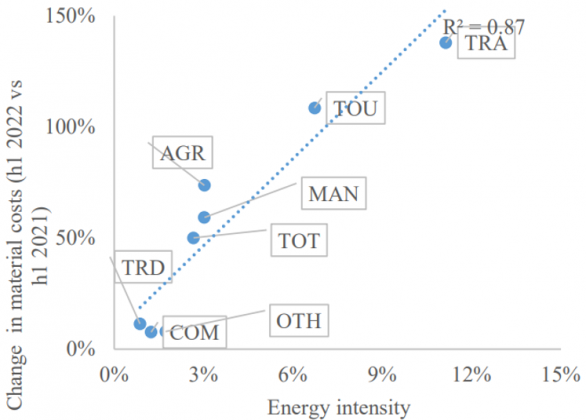
Source: Authors‘ calculation, FINA and ZSE data
Figure 8: Other material costs sensitivity to change in energy costs (indirect effect)
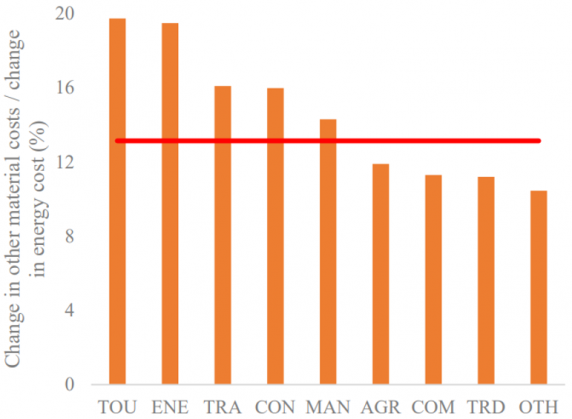
Note: The line represents the NFC average.
Source: Authors‘ calculation, FINA data
According to performed analysis, the corporate sector is highly sensitive to energy price shock, with indirect shock having a higher contribution (Figure 9). A price increase of around 50%, a shock comparable to the developments in the first half of 2022, without the possibility for pass-through or any mitigation, would lead to an increase in loss-making companies’ share from 10% to around 46%. However, significant differences are found between the economic activities. Apart from the Energy providers, companies from Agriculture and Transport would be affected the most. While corporates from Agriculture show sensitivity due to low baseline profitability the Transport sector is highly sensitive due to initial weak earnings and energy intensity (Table 1).
Figure 9: Total energy intensity (the effects of a 1% increase in energy costs)
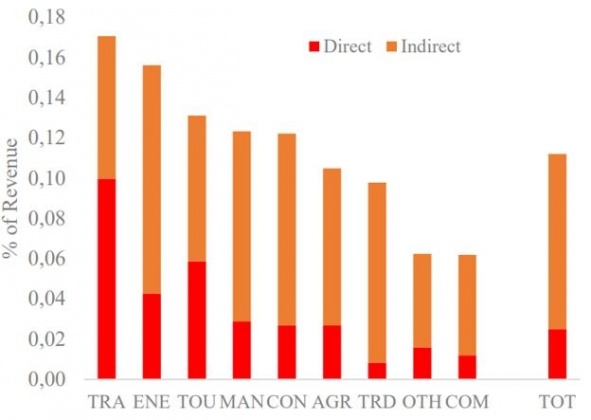
Source: Authors‘ calculation, FINA data
Table 1: NFC sensitivity to energy price shock
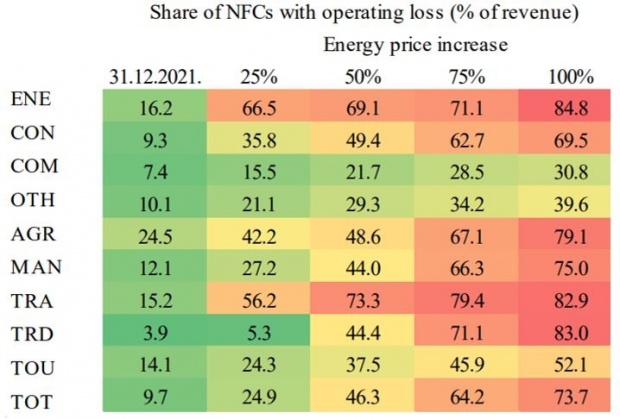
Note: Operating loss is negative EBIT
Source: Authors‘ calculation, FINA data
Shortage of inputs in the short run triggers the operating leverage shock, the sudden increase in burden from the fixed costs. Since they decrease automatically with the activity decrease, variable costs pose little danger for the corporate margin. However, fixed costs pose a threat for corporate earnings. Trying to adjust to the sudden increase in fixed cost results in decreasing the capacity in terms of labour or fixed input.5 For energy shortage shock effects, we modify a methodology presented recently by Allinger and Huljak (2022) and apply it to energy as a reason for operations decline.6 While only a subset of corporates use financial leverage, operating leverage is universal and every corporate uses it to some extent. Significant differences remain between economic activities, with Tourism having the highest share of fixed costs (Figure 10).
Our results show that energy shortage can have significant negative effects on the corporate sector. Should the energy shortage lead to a proportional decrease in business activity, without mitigation, corporate sector EBIT would decrease strongly. For example, an energy shortage of 10% would increase the share of loss-making corporates in aggregate revenue from around 10% to around 22%. Should the business activity decrease by 25%, the share of loss-making companies would amount to around 46% (Table 2).
Figure 10: Operating leverage in 2021
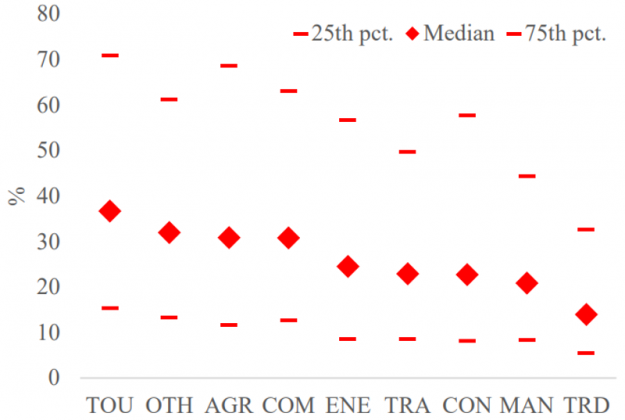
Note: Operating leverage is the share of fixed costs in total operating costs. Source: Authors‘ calculation, FINA data
Table 2: NFC sensitivity to energy shortage shock
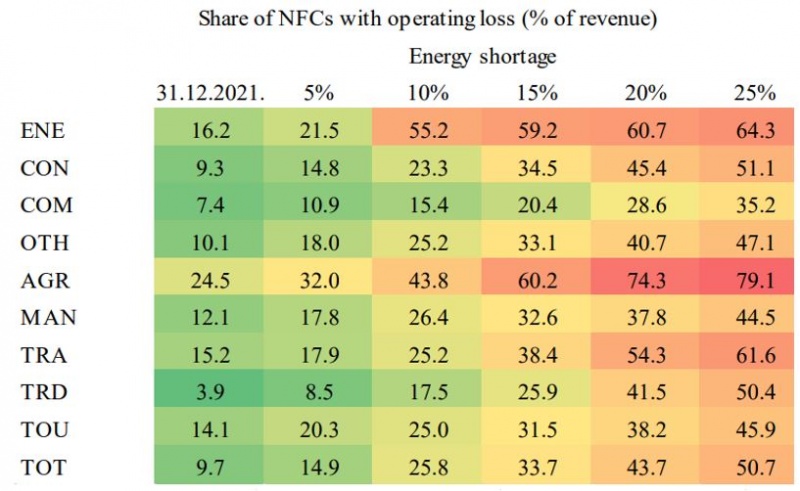
Source: Authors‘ calculation, FINA data
In practice, energy shocks are mitigated by numerous efforts. Passing the costs to the buyers is an automatic response in an environment of strong demand and high liquidity. Larger companies, depending on the industry, can index the outputs prices to input prices. However, these techniques, especially when including financial derivatives (forward contracts), are usually reserved for larger companies with closer ties with financial institutions or with their own treasury departments. Smaller corporates, on the other hand, would usually try to renegotiate the conditions with their buyers. The developments from the 2021 and first half of 2022 are consistent with the pass through of energy prices to buyers; however, due to the strong demand, the level of business activity generally grew also leading to higher material costs and higher revenue (Figure 11).
Apart from passing through the costs to their clients, in order to counter the input price increase, corporates have certain flexibility within the business process. The substitution between inputs or modifications in production process can help in bridging the gap during the period of high prices or shortage of certain inputs; however, these changes usually refer to the substitution between the energy sources, not the energy profile of the business process itself. Also, since companies usually operate with some degree of technical inefficiency, moving towards the efficiency frontier (reducing the gap to the best performers in the same activity), will among other things, also reduce energy consumption. However, potential gains in efficiency are limited in the short period.
Figure 11: Material costs and revenue increase in H1 2022
Source: Authors‘ calculation, FINA data, ZSE
Figure 12: Energy, industry, and consumer prices
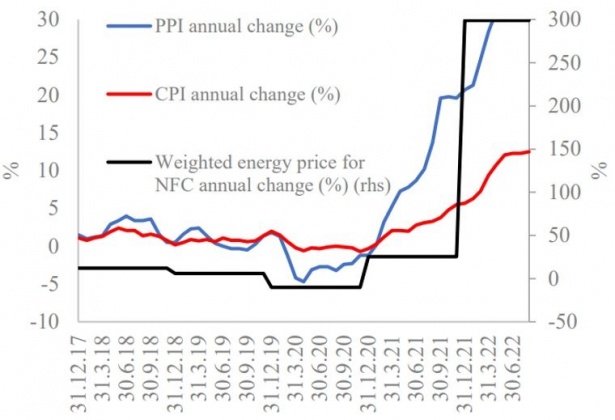
Note: Weighted energy price assumes that companies use 40% gas and electricity and 20% oil.
Source: Authors‘ calculation, Eurostat, HNB
Apart from the fact that economy needs energy to function, the importance of energy for financial stability is additionally amplified via the link between energy intensity and credit. As the data for Croatia (September 2022) suggest, energy intensity is to a significant part credit financed, with bank exposure-weighted energy intensity being higher than clients’ energy intensity (10% vs. 8%). The reason for this is the fact that investments in the fixed assets (asset type generating energy costs) are often loan financed. (Figure 13) Also important from the prudential point of view are the differences between banks regarding their clients’ energy intensity. As Figure 14 suggests, it seems that the clients` energy intensity on bank levels are mostly defined by clients` economic activity. However, differences between banks result from individual effects (Figure 14).
Figure 13: Client energy intensity vs. Exposure weighted energy intensity
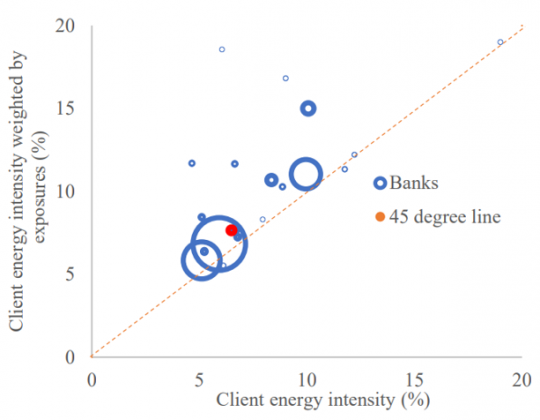
Note: Bubbles note market shares of banks.
Source: Authors‘ calculation, HNB data
Figure 14: Bank client‘s energy intensity contributions
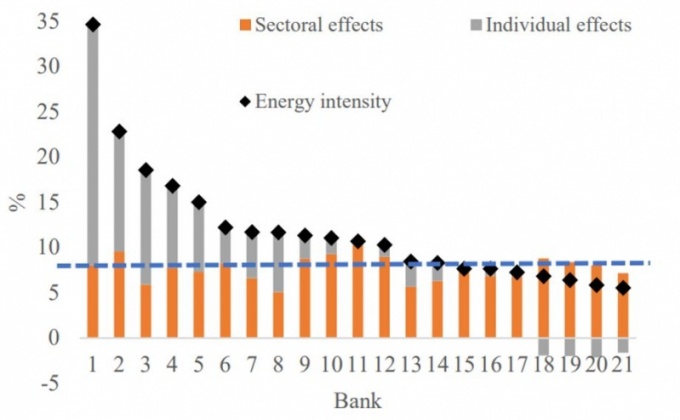
Note: The blue line marks the total.
Source: Authors‘ calculation, FINA and HNB data
The risks associated with higher energy intensity become more obvious when observing the performance of bank clients regarding energy intensity class.7 First, companies with higher energy intensity are less technically efficient. This is expected because inefficient companies waste resources, most notably energy. It is therefore also not surprising that companies with higher energy intensity have lower margins. Finally, companies with higher energy intensity have higher financial and operating leverage. Operating leverage is higher as equipment that produces energy costs also generates fixed costs (more skilled and expensive labour and higher depreciation). As explained earlier, financial leverage increases with energy intensity as bank credit is used to finance it (Table 3).
Higher risks associated with energy intensity are accompanied by higher loan loss provisions. The loan loss provisions coverage increases with higher energy intensity, suggesting that banks include the risks associated with a higher relative burden of energy in provisioning policy. However, significant differences are present between banks, with for example the coverage for the highest energy intensity group ranging from 3% to 9%. (Figure 15). Although this can result also from structural drivers (wide definition of economic sector used in this analysis), it does indicate that banks can indeed treat energy exposures differently and that energy intensity considerations could be used to supplement micro and macro- prudential surveillance.
Table 3: Corporate performance regarding energy intensity quartiles
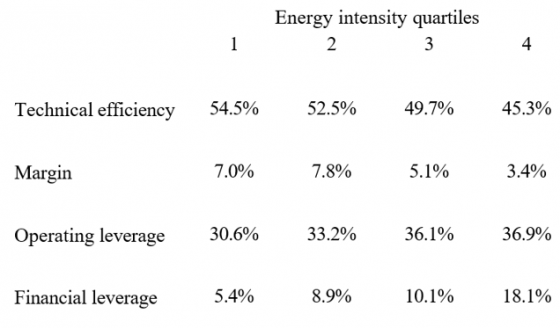
Note: Technical efficiency is derived from SFA applied on production function, Margin is EBIT / Sales, Operating leverage is the share of fixed costs and Financial leverage is the bank credit to sales. Data refers to end 2021.
Source: Authors‘ calculation, Eurostat and HNB data
Figure 15: Loan Loss Provsions coverage percentiles by energy intensity classes
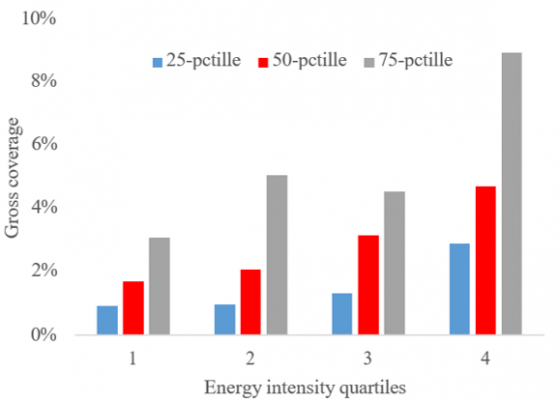
Note: Data refers to end 2021
Source: Authors‘ calculation, FINA and HNB data
To decrease NFCs’ sensitivity to energy shocks, a more long-term strategy is required. Rationalization and cost savings are obvious options for corporates that do not operate on the efficiency frontier, while geographical diversification of energy supply chains accompanied by an intensification of sustainable and ecologically acceptable energy sources can help in gauging the corporate strategy. However, in the short run, corporates are unlikely to change their business process significantly and reduce their sensitivity to energy shocks. Therefore, companies might benefit from support programs, as they are unlikely to pay for the whole transition themselves, especially during a period of expected deceleration in economic activity.
Corporate productivity gains related to energy in Croatia seem to result from revenue, not cost side. Per unit of tangible fixed assets, corporate sector was able to increase the product (GVA) significantly, while energy cost per tangible fixed assets did not decrease. Accelerating amortization does suggest, although it does not confirm, increased investment in more sophisticated machines. Also, the share of tangible fixed assets in total assets started decreasing after 2018 signalling perhaps an end of one investment cycle (Figure 16).
Co2 emission8 per tangible fixed assets remained stable after 2015; however, Co2 energy density increases continuously. It seems that little progress was made on the equipment level regarding the Co2 emission, which is in line with the previous statement on revenue-based productivity. At the same time, it seems that corporates were able to extract more revenue per Co2. However, when accounting for energy prices, it seems that per one unit of Energy cost (in 2007 prices), the mass of Co2 increased (Figure 17).
Figure 16: Tangible fixed assets productivity
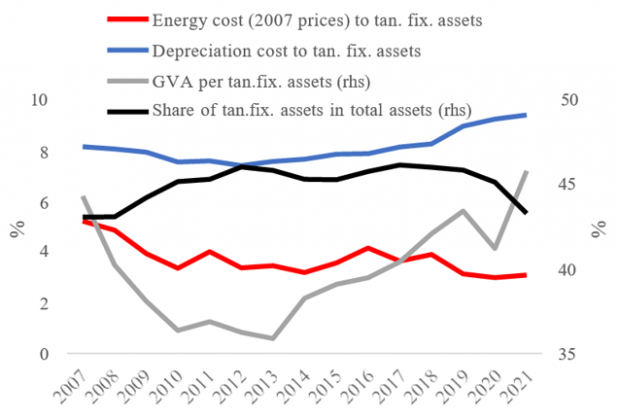
Source: Authors‘ calculation, FINA data
Figure 17: Co2 density in corporate operations
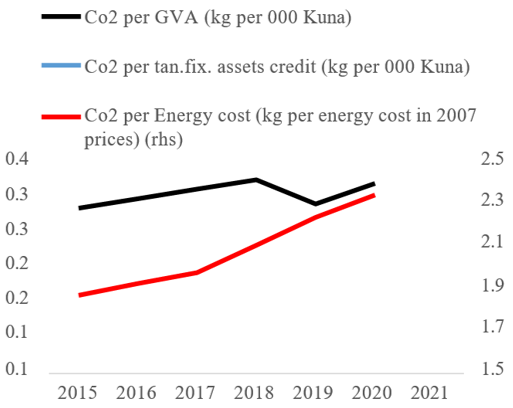
Note: Co2 emission refers to 172 corporates.
Source: Authors‘ calculation, FINA data
Energy is an important input for the economy as a whole as its prices, quality and safety spill through all the sectors. The spike in energy prices in 2022 was eventually contained and therefore had significantly smaller impact on corporate activity, revenue and profitability than initially feared. However, presented sensitivity of corporates to energy prices and energy shortages refers to shocks in isolation, without any mitigating or second-round effects. In reality, a strong price increase would lead to decreased activity while shortages would also lead to price increases, making the sensitivity of corporates to simultaneous energy price and shortage shock larger. Therefore, the developments regarding energy prices during 2022 should serve as a warning, as a renewed and prolonged energy crisis increases the likelihood of corporate sector disorderly adjustment with significant adverse social effects and reduced potential for future growth.
Moving towards cleaner and more stable energy might prove challenging in the periods of decelerated economic activity; however, significant gains are available via energy efficiency increase. Corporates seem to have been able to leverage more on the energy in revenue terms, while their equipment in unit terms produces similar levels of energy costs and emits similar Co2 levels. This suggests that improving production efficiency might help support corporate margins and investment potential.
Allinger, K., Huljak, I. (2022). Operating leverage and its importance during the Covid-19 pandemic, SUERF Policy Brief, No 256, Operating leverage and its importance during the Covid-19 pandemic
European Central Bank (2022). Box 1 Technical assumptions about interest rates, commodity prices and exchange rates, ECB staff macroeconomic projections for the euro area, https://www.ecb.europa.eu/pub/projections/html/ecb.projections202209_ecbstaff~3eafaaee1a.en.html#toc3
European Central Bank (2022). Energy price developments in and out of the COVID-19 pandemic – from commodity prices to consumer prices, ECB Economic Bulletin, Issue 4/2022. https://www.ecb.europa.eu/pub/economic-bulletin/articles/2022/html/ecb.ebart202204_01~7b32d31b29.en.html
Gu, L., Hackbarth, D., & Johnson, T. (2018). Inflexibility and stock returns. The Review of Financial Studies, 31(1), 278-321.)
European Central Bank (2015). The Bank for the Accounts of Companies Harmonized (BACH) database, Statistics Paper Series, No 11 / September 2015 https://www.ecb.europa.eu/pub/pdf/scpsps/ecbsp11.en.pdf
International Energy Agency (2022). World Energy Outlook 2022 https://www.iea.org/reports/world-energy-outlook-2022
Energy intensity is the ratio of energy used and output. When missing the physical data, the monetary value of energy spent, and revenue are used.
The following abbreviations for economic activities are used in the paper: ENE – Energy, CON – Construction and real estate, COM – Communication and IT, OTH – Other, AGR – Agriculture, MAN – Manufacturing, TRA – Transport, TRD – Trade, TOU – Provision of food and accommodation.
We decompose the contributions to a) Between vs. Within sectoral developments and b) Output prices, Energy prices, Energy and Product quantity (Revenue). We use weighted energy prices for discounting the Energy costs and CPI for discounting the Output.
According to a simple econometric model (Gu et. al, 2018), the share of fixed component in energy cost is low, between 0.7% and 2.0%.
The effects of input shortage are similar to the sudden stop in 2020 due to the epidemiological measures. A relative increase in fixed costs compared with revenue would undoubtedly lead to negative margins corporates would try to counter with capacities decrease or exit from the market.
Allinger and Huljak (2021) suggested that the operating leverage, due to its importance especially in periods of stress, deserves more attention in the literature.
We group all NFCs into four quartile groups. To respect the energy intensity specificity of economic activities, the groups are constructed for each economic activity.
Our data sample includes a balanced sample of 172 corporates that reported on Co2 emissions from 2015 onwards.