The Covid-19 pandemic provoked a series of epidemiological measures resulting in a significant decline in corporate activity, especially in economic sectors that require social contact. This sudden stop of business activity exposed the sensitivity of the corporate sector to operating leverage (the pressure of fixed costs). Using the sample of the Croatian corporate sector (2008-2020) we show that firms with higher fixed costs generally have lower financial leverage and keep higher liquidity buffers as a precaution. Moreover, we show that their profitability and liquidity is more sensitive to a slow-down in business activity. Without the fiscal support, during the pandemic, profitability pressure on high fixed costs firms would have provoked adjustments in terms of reducing capacities, which would have impeded economic recovery. Understanding operating leverage is therefore important not only for understanding the developments around the Covid-19 pandemic but also for understanding and improving resilience of the corporate sector, for instance, against climate events and supply chain disruptions.
Overshadowed by financial leverage, especially after the Global Financial Crisis (GFC), operating leverage, was left sidelined in the economics literature of the past decade. However, the sudden pressure from fixed costs on cash flows of non-financial companies during the Covid-19 pandemic, shifted some of the interest back to the operating sphere of corporate activity. As epidemiological measures put a sudden stop to certain business activities in 2020, corporate turnover recorded a sharp decrease. Without fiscal support by governments, this could have quickly turned into liquidity and subsequently solvency issues for many companies.
The companies most exposed to a sudden decline in turnover were those whose costs were least responsive to a fall in turnover (ceteris paribus). Higher fixed costs exposed them to larger liquidity needs than firms with more cost flexibility. Fixed costs, such as staff or rental costs, thus triggered the need for immediate government support, with governments’ support structured mostly in the form of fixed cost support.
The responsiveness of operating profits to turnover, which largely depends on the amount of fixed costs of the firm, is known as operating leverage. Companies with a higher share of fixed costs stand to record higher profits when turnover increases. However, firms with a high share of fixed cost are more vulnerable to shocks, which increases their default risk (ceteris paribus) (e.g. Chen et al., 2019).
There are many different approaches in the literature on operating leverage calculation. Our baseline measure follows the approach of Chen et al. (2019), who determine which cost types to classify as fixed or variable by running regressions of the logarithmic change in sales and the change in sales interacted with a dummy that is 1 for negative sales growth periods on different cost measures and comparing the coefficients. In the next step, fix-costs are defined as the ones that react the least to a sales decrease.2
Based on a regression analysis we determine the elasticity of cost types against changes in business activity (sales), allowing us to define our baseline measure of operating leverage as the sum of staff and depreciation costs over total costs.3 For a 1% decrease in sales, costs of goods sold, materials and consumables decline by a corresponding 0.88%, external supplies and services by 0.62% and other expenses by 0.66%. Staff expenses decrease by only 0.29%, however, and depreciation costs by only 0.35%.4
It should be noted that the approach we choose to calculate our baseline measure is one of many in the literature. Many authors have proposed estimation-based operating leverage measures with many of the models being modifications of the early seminal contributions of Lev (1974) and Mandelker and Rhee (1984). It is likely that all calculation methods lead to some measurement error. To mitigate this, we use our operating leverage indicators in terciles rather than as a continuous measure (see Kahl et al., 2019). Moreover, we also calculate two estimation-based operating leverage measures – namely the “quasi fixed costs” (QFC) proposed by Gu et al., 2018 and “cost structure” proposed by Kahl et al., 2019 – to check the robustness of our results.5
Operating leverage in Croatia increased over time, while financial leverage started to decelerate after the prolonged recession 2009-2014 following the GFC. Financial leverage of the median company declined from 69% to 47% between 2008 and 2020, likely due to a variety of reasons including better operating performance allowing for more internal financing of expansions. Operating leverage of the median company increased, however, from 26% to 35% between 2008 and 2020 (see Figure 1). Operating and financial leverage also differ quite substantially across sectors. Companies in the trade sector rely more on financial leverage, while their operating leverage is lowest. On the other end of the spectrum, services and “other” (which includes “public” services like education, health and social work services) have the lowest financial, but the highest operating leverage. Thus, some of the industries strongly affected by pandemic-related containment measures are characterized by high median operating leverage.6
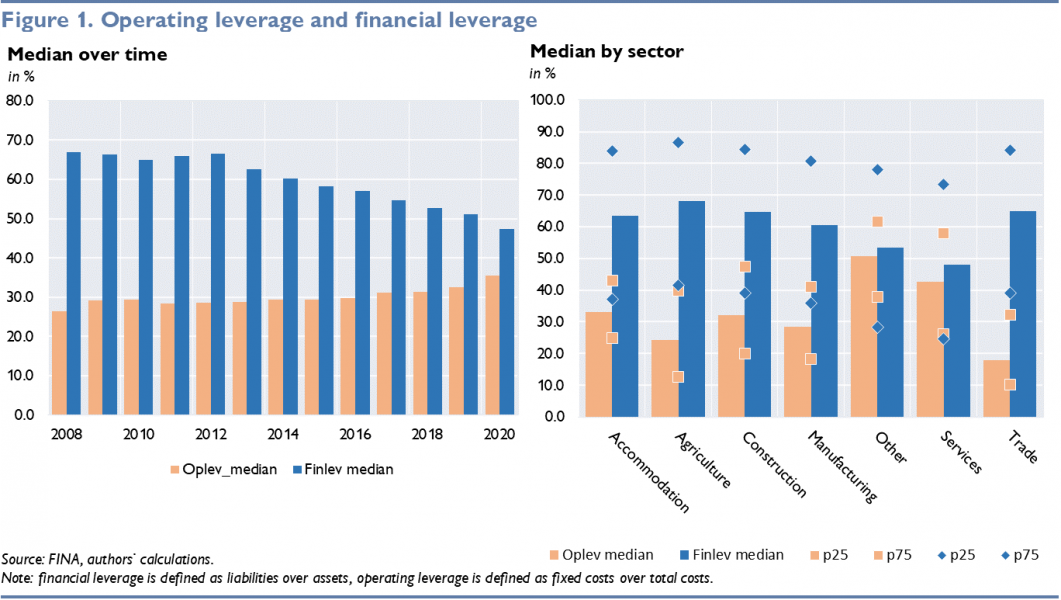
Table 1 shows that the characteristics of Croatian firms differ significantly regarding operating leverage. Firms with higher operating leverage have lower financial leverage and higher liquidity buffers. This is well-documented in the literature. As operating leverage increases the default risk of the firm, firms with high operating leverage choose lower financial leverage and/ or higher liquidity buffers to mitigate this default risk (e.g. Lev, 1974, Kahl et al., 2019). It is assumed that when deciding on total leverage, operating leverage is “chosen first”, given that it is closely related to the industry and business model (e.g. Chen et al., 2019). For instance, some products have little to no marginal production costs, but require large up-front (fixed) development costs, such as software development. However, firms clearly have some control over their cost structure, e.g. via outsourcing, leasing or purchasing decisions or process management, which can transform fixed into variable costs or vice versa. This is also evidenced by the wide dispersion of operating leverage within each sector (see Figure 2).
Table 1 also shows that firms with high fixed costs are somewhat smaller and mildly more profitable. High fixed cost firms have larger shares of tangible fixed assets than low fixed cost firms, contrary to the data reported by Kahl et al. (2019). The relationship with investment intensity seems to be non-linear.
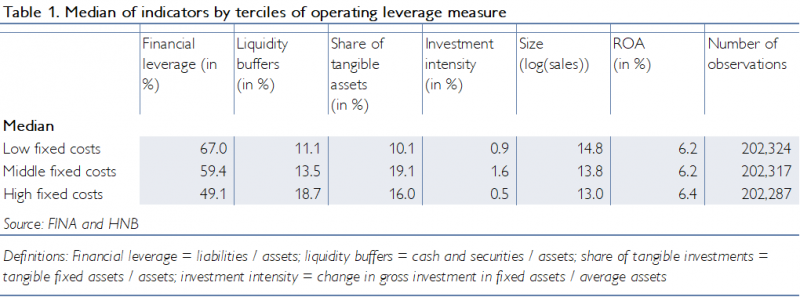
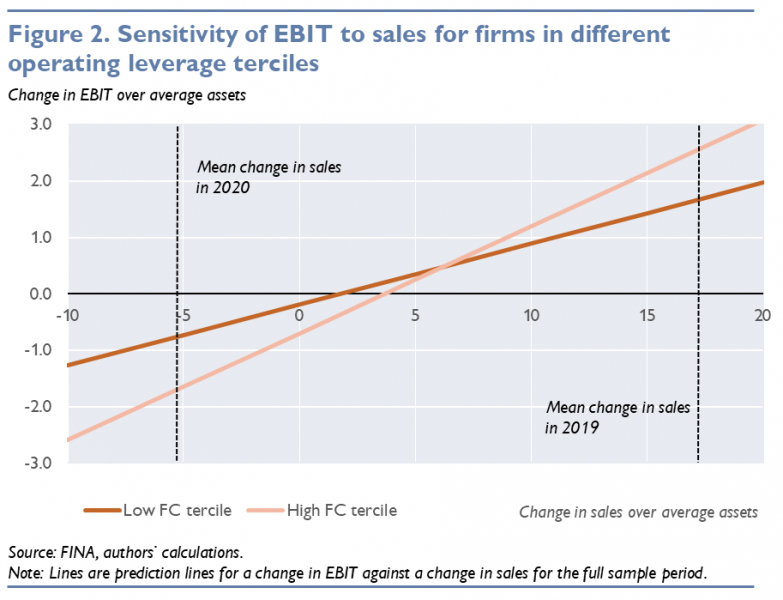
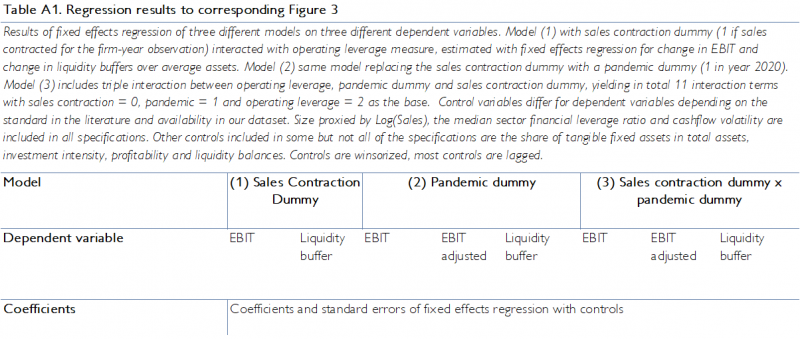
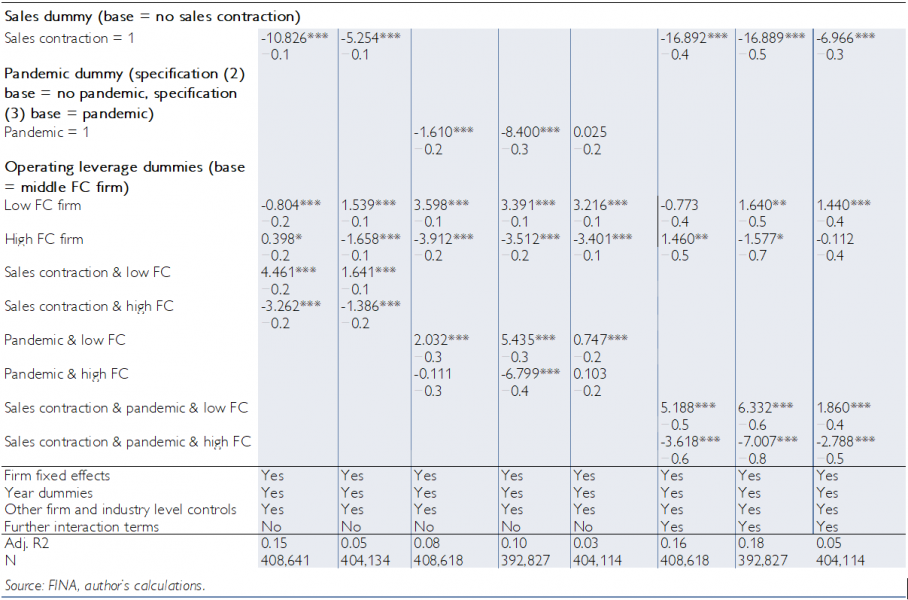
Figure 2 illustrates the effects of operating leverage on companies’ performance in Croatia. During 2019, a year of strong growth of business activity, firms with higher operating leverage recorded a stronger increase in profits. However, in 2020, when business activity declined, the same firms recorded a stronger decrease in earnings. To further investigate how firms with higher operating leverage behave when confronted with a shock, we run several regressions, which are reported in Table A1 in the Annex, while the key coefficients are visualized in Figure 3.
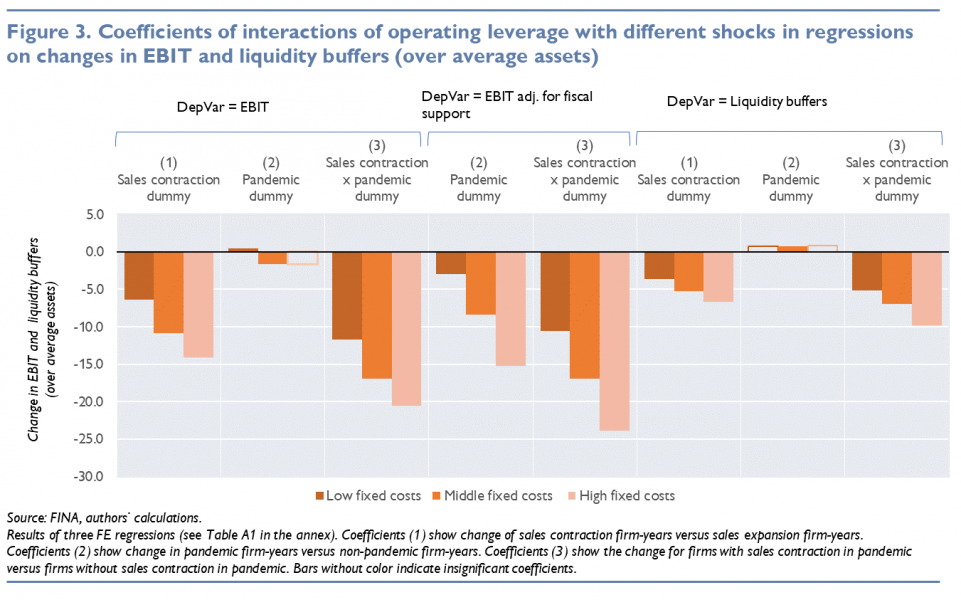
We first show that firms with higher operating leverage experience sharper drops in profitability and liquidity buffers in response to a contraction in sales. This can be seen from the coefficients of specification (1) in Figure 3, which results from a regression of an interaction of a sales drop dummy with operating leverage terciles on changes in profits (EBIT) and changes in liquidity balances7.
In the next step, we investigate the dynamics during the pandemic and how firms with sales drops performed versus other firms. For this purpose we re-run the above regression with a triple interaction of the operating leverage tercile, the sales drop dummy and a pandemic dummy. Figure 3 specification (3) shows that during the pandemic year, the change in profits and liquidity were even more pronounced for firms that experienced a sales drop versus those that did not. As a simple exercise we also adjust EBIT in 2020 by deducting all wage support that the firm received from the government in 2020.8 In this hypothetical scenario the reaction of profits and liquidity is even more pronounced for high fixed cost firms.
Finally, we also show that support measures protected all firms but particularly those with high operating leverage from worse outcomes. This is evident when comparing the coefficients on specification (2) reported in Figure 3. In this specification the sales drop dummy from model (1) is exchanged with a pandemic dummy. The coefficient for the middle fixed cost firms (the base category) is therefore equivalent to the coefficient of the pandemic dummy and shows that, on average, compared to 2019 profits contracted mildly and liquidity buffers increased mildly. However, the interaction terms for low and high fixed cost firms are small or insignificant, which implies that operating leverage does not play an important role in explaining pandemic outcomes post-support. However, once we consider specification (2) for the EBIT adjusted for fiscal support, we see that without support, firms with high operating leverage would have been more severely hit, which means that government support mitigated the vulnerability of firms with higher operating leverage during the Covid-19 pandemic.
Our results are robust to sensible modifications of the model and sample as well as to using different operating leverage measures. The estimation-based operating leverage measure proposed by Kahl et al. (2019) and by Gu et al. (2018) yield roughly the same dynamics as those reported in Figure 3 – however, using these measures for specification (2) on adjusted EBIT, firms with high operating leverage do not seem to have been hit stronger than those with middle operating leverage. This difference could be due to a higher correlation between wage support and a wage-based operating leverage measure compared to the alternative estimation-based operating leverage measures.
We explain the concept of operating leverage as a measure of the response of a firms’ profits to changes in sales via the cost structure of the firm. Firms with high fixed costs stand to gain more in terms of profits when sales increase, but they are also more vulnerable when sales decrease.
The functioning of operating leverage became evident during the Covid-19 pandemic, when a large number of firms saw their sales drop sharply, which made covering fixed costs challenging. Thus, the Covid-19 pandemic has demonstrated the need to be more aware of operating leverage and shocks that could lead to sudden drops in sales. Particularly in the current global context with increasing risks from climate events or supply chain disruptions, such shocks could become more frequent in the future.
We show that in Croatia, firms with high operating leverage have somewhat different characteristics than other firms. Most notably, and in line with international evidence, they have lower financial leverage and higher liquidity buffers. Moreover, their profitability and liquidity is more strongly affected by drops in sales. In a simple exercise where we deduct fiscal support due to the pandemic from 2020 profits, we show that if the government had not supported firms, especially firms with high fixed costs would have been faced with very strong declines in profits.
Annex
Chen, Z., Harford, J., & Kamara, A. (2019). Operating leverage, profitability, and capital structure. Journal of financial and quantitative analysis, 54(1), 369-392.
Gu, L., Hackbarth, D., & Johnson, T. (2018). Inflexibility and stock returns. The Review of Financial Studies, 31(1), 278-321.
Kahl, M., Lunn, J., & Nilsson, M. (2019, May). Operating leverage and corporate financial policies. In AFA 2012 Chicago Meetings Paper.
Lev, B. (1974). On the association between operating leverage and risk. Journal of financial and quantitative analysis, 9(4), 627-641.
Mandelker, G. N., & Rhee, S. G. (1984). The impact of the degrees of operating and financial leverage on systematic risk of common stock. Journal of financial and quantitative analysis, 19(1), 45-57.
Opinions expressed by the authors do not necessarily reflect the viewpoint of the Croatian National Bank or the Oesterreichische Nationalbank.
Our data stem from Croatia’s Financial Agency and span the period 2008 to 2020. After applying commonly used data cleaning practices (see e.g. Kahl et al., 2019; Chen et al., 2019), we use 96,311 Croatian firms or in total 623,427 observations covering around 80% of total sales for our analyses. We exclude (1) companies from the financial and utilities sector as they often show different dynamics, partially due to heavy regulation, (2) firms which report zero employees (roughly 30% of all observations), (3) firms with less than three years of data. We also exclude observations (1) with negative assets, operating costs or sales and observations with suspicious values for key variables, e.g. sudden drops of assets, liabilities or equity to 1, 10 or 100 for a single year. We restrict ratios such as the leverage ratio or the share of fixed costs in total costs between 0 and 1. Other variables are winsorized to reduce the importance of outliers given the high volatility of the data.
Labor costs are often referred to as variable costs in operating leverage discussions – however, much of the literature is focused on the U.S., which have more flexible labor markets and lower employment protection than most European countries. Moreover, the time horizon is crucial – while labor may be adjusted in the medium-term, we are looking at more short-term shocks, where an adjustment of labor costs is rather difficult.
With results similar when running the regressions on sector level.
Both approaches build on Lev (1974), who regressed sales on operating costs to measure the cost elasticity of the firm. Gu et al. (2018) modify this to estimate the share of costs that do not scale with contemporaneous sales by including the lags of costs and sales to Lev’s (1974) regression. Kahl et al., (2019) modify the approach by accounting for growth trends by deducting these trends from costs and sales before running the regression. For reasons of scope we do not show the results of these calculations. The correlation of our baseline measure and the estimation-based measures (in terciles) is roughly 20%, while the correlation between the two estimation-based measures is roughly 50%. There is limited overlap regarding the firms classified in each tercile: Only around 25% of observations in the sample are in the same tercile across all measures.
Across all sectors and years, the median level of fixed costs over total costs in our sample is 30%. The cut-offs for the operating leverage terciles are the 33th and 67th percentile, which lie at 21% and 41%. There were some shifts in the sample over time, most noticeably an increase in the share of service firms from 27% in 2008 to 33% in 2020 and a decrease in the share of trade companies from 37% to 28%. However, even when we keep the shares of firms per sector constant, we see the same pattern in financial and operating leverage.
Firms with middle fixed costs are the base, which means that the shown coefficient for these firms is the one for the sales drop dummy, while for low and high fixed cost firms, the coefficient for the sales drop dummy and the respective interactions are summed; e.g. for change in EBIT -10.8-3.2 = -14.1. To put these estimates into context: the mean change in EBIT for the full sample is 1.36 and the mean change in liquidity buffers 2.78.
This is just a very simple theoretical exercise that ignores important intricacies, such as intra-year developments and potentially averted insolvencies/ business closures or the role of debt and other support measures (e.g. moratoria).