
Summary – In order to find new sources of growth, post-communist countries need to accelerate structural reforms. However, the public support for reforms in these countries is limited. We show that this is explained by the lack of inclusion and fairness of transition from plan to market. While transition has brought higher income levels on average, the benefits of growth have not been shared broadly – and not always in a meritocratic way. Going forward, market reforms should take into account inclusion and governance aspects in order to reduce the risk of reform reversals.
As we show in the Transition Report 2017-18 “Sustaining Growth”, after the Great Recession post-communist countries have experienced a marked slowdown of economic growth. While this slowdown has been observed in many countries around the world, the post-communist countries have been hit disproportionally stronger – their growth rates after the crisis have been lagging those of countries at similar levels of development. This is even more striking as before the crisis, the post-communist countries systematically outperformed the comparators. Our analysis shows that this “reversal of fortunes” is due to the fact that in early years these countries have picked up the low-hanging fruit of removing inefficiencies inherited from the command economy; now they need to carry out the next generation of structural reforms – improving economic and political institutions, deepening the financial system (including equity markets) and promoting investment in human capital, innovation, and sustaina-ble infrastructure.
The problem with promoting further economic and political reforms is that – unlike late 1980s and early 1990s – reforms are no longer popular. Figures 1-2 report the results from EBRD and World Bank’s Life in Transition Survey (EBRD 2016). In most middle-income transition countries, market economy is supported by a minority of households; support for democratic political system is higher but is also much below the one in Germany or Greece.
Figure 1. Percent of respondents supporting market economy
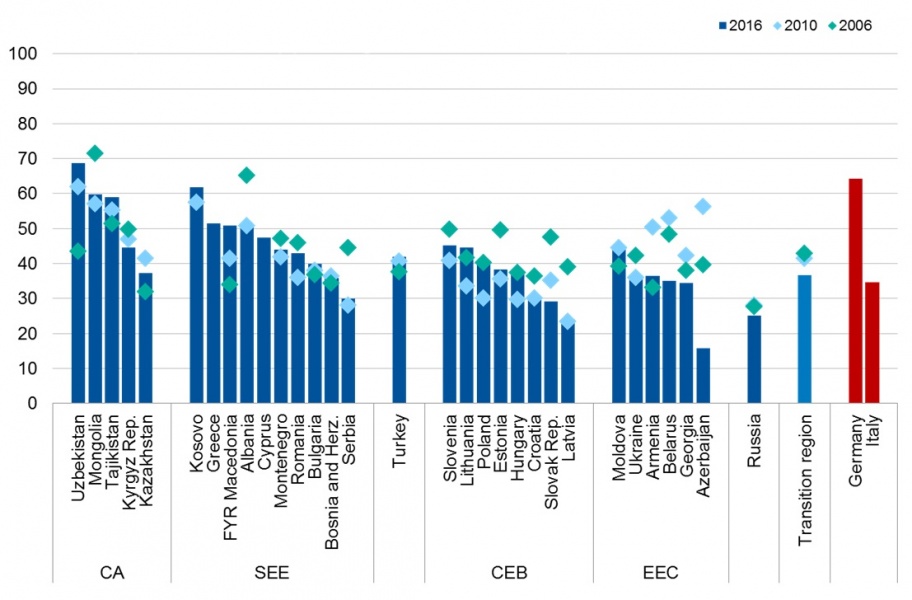
Sources: LiTS I (2006), LiTS II (2010), LiTS III (2016).
Figure 2. Percent of respondents supporting Democracy
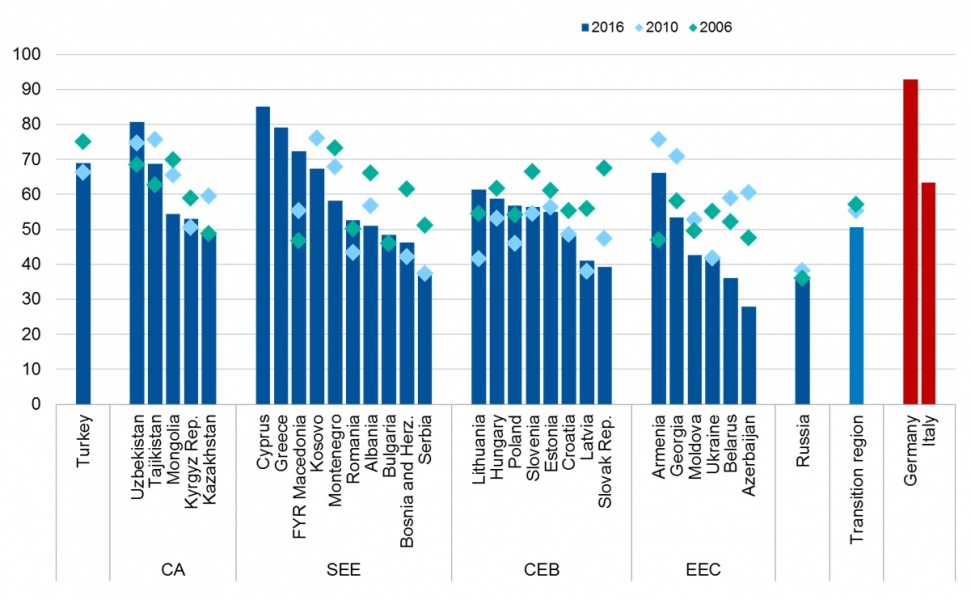
Sources: LiTS I (2006), LiTS II (2010), LiTS III (2016).
What went wrong?
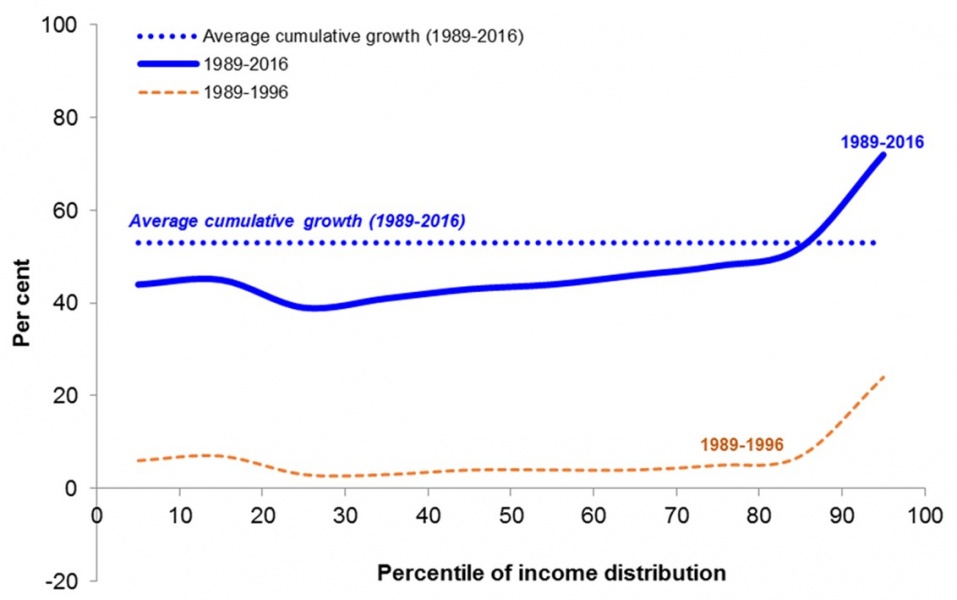
Why have the residents of transition countries lost confidence in market reforms? Our analysis points to the importance of (the lack of) inclusion and fairness. First, while reforms have delivered impressive economic growth on average, the benefits of this growth have not been shared broadly. In Figure 3 we present Branko Milanovic’s famous “elephant curve” (Milanovic 2016) for the post-communist countries. Since the beginning of reforms, real incomes in these countries have grown at about 2 percent per year on average. However, for the bottom 75% of the population incomes grew at slower rates – while the real beneficiaries of this growth were the top 10% of the households. As Milanovic’s analysis may produce different results for country groups and individual countries, we also look at within-country elephant curves and find that for the vast majority of them the results are similar. Figure 4 shows the results for Russia – where the top 20 percent have seen growth at or above the average rate (which in case of Russia was about 3 percent per year) while the bottom 80 percent have experienced growth rates below average. Moreover, the bottom 10 percent have seen their incomes actually fall. In order to put these results in a perspective, we also present the chart for the US. There, the top 10% have also done very well; however, the bottom 90% have not fallen too far below the average. In this sense, the “left behind” issue is much larger in the transition countries than in the modern US (and other Western countries).
These problems look even more striking when we explore the households for which the reforms have reduced the gap between their incomes and incomes of the advanced economies. It turns out that this income convergence has taken place on average, but not for the majority of households. Only 44% of post-communist households we have seen incomes catching up with those of G7 countries. As for the other 56%, their incomes have further fallen behind those of rich countries’ residents.
Figure 3. Post-communist countries: Cumulative growth in income since 1989 depending on initial income
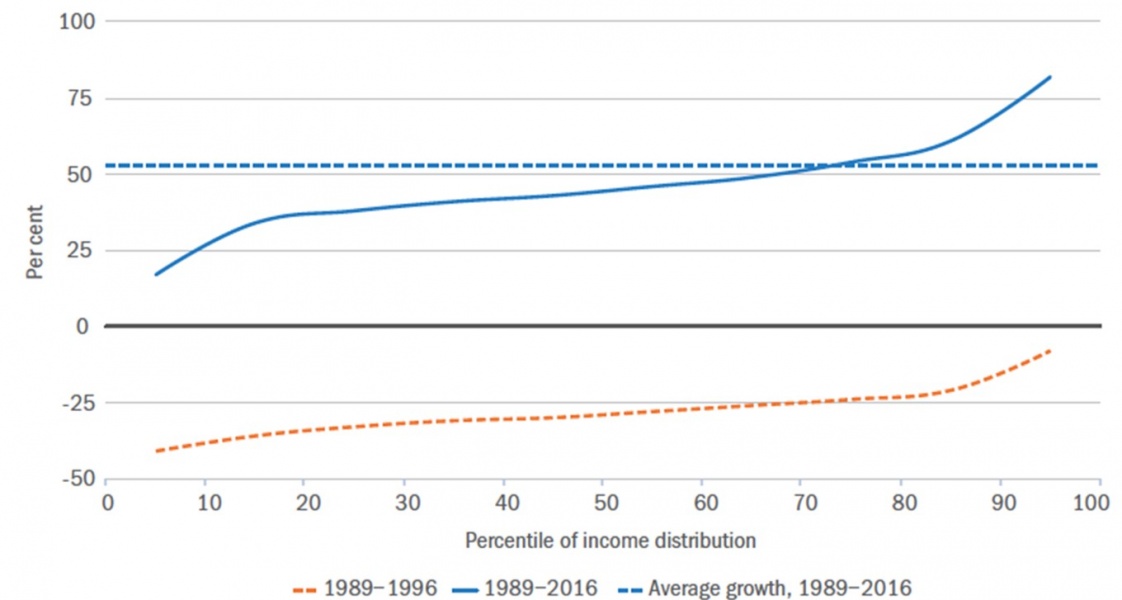
Sources: EBRD Transition Report 2016-17.
Figure 4. Russia: Cumulative growth in income since 1989 depending on initial income
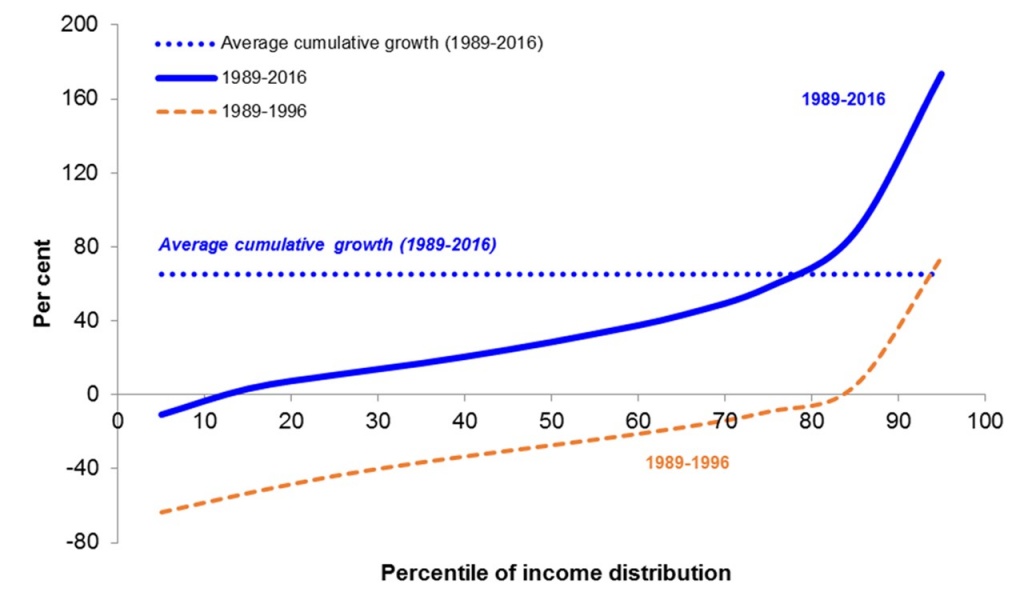
Sources: EBRD Transition Report 2016-17.
Figure 5. US: Cumulative growth in income since 1989 depending on initial income
Sources: EBRD Transition Report 2016-17.
Increase in inequality per se is not necessarily a negative development. After all, socialist economies were “too egalitarian” (at least in terms of nominal incomes); the socialist equality was unfair in the sense that talent and effort was not been rewarded with higher pay. Reforms were actually meant to introduce fair inequality creating market-based meritocratic incentives. However, in many countries, we have also seen a dramatic increase in unfair inequality – where success was based on circumstances of birth, connections and even breaking the law, rather than on effort and skills.
This brings up the second source of low popularity of reforms – the view that reforms have not been carried out in a fair way; instead, they have brought inequality of opportunity and corruption.
We check the correlation between perception of corruption and trust in government (controlling for income, education, employment status, age, gender and town fixed effects). Table 1 in the Appendix shows that perceptions that corruption is growing has a strong negative effect on trust in government. Results for other measures of government approval and of corruption perceptions (as well as experience of corruption) are very similar. Importantly, the views on corruption affect government approval more than economic variables such as income and unemployment; this is actually not the case in other countries (Guriev and Treisman 2017).
In order to understand the role of “fairness” of inequality, we decompose income inequality into two components: (i) “unfair” inequality, or inequality of opportunity (part of inequality explained by gender, race, place of birth, and parental background) and (ii) “fair” inequality (the residual, explained by effort). We find (EBRD 2016) that in many transition countries inequality of opportunity account for about half of the total income inequality.
In Table 2 (in the Appendix) we show that support for market economy is negatively correlated only with the inequality of opportunity (the “unfair” component) while the “fair” component of inequality is positively correlated with support for markets.2
Rethinking Transition
The importance of inclusion and fairness for political legitimacy of market reforms has given rise to EBRD’s rethinking of the destination of the transition process. In November 2016, EBRD’s Board approved the new “Transition Concept” which defined the success of transition as a sustainable market economy characterized by six qualities: (i) competitive, (ii) well-governed, (iii) green, (iv) inclusive, (v) resilient and (vi) integrated. While (i) – related to creating competitive markets and private ownership – has always been an essential part of the Bank’s mandate, qualities (ii) and (iv) are directly linked to political sustainability of market reforms. Good governance is critical for fairness and inclusion is understood precisely as equality of opportunity (in a sense, the “green” quality is also related to inclusion, namely to sharing the benefits of today’s economic growth with future generations).
Light in the end of the tunnel
Given the update of the Transition Concept, EBRD has also redesigned its measurement of transition progress. The good news is that the indicators of reforms alongside the six dimensions above (Transition Report 2017-18, Chapter 5) show the pickup in the speed of the (fair and inclusive!) reforms in 2017. This may be related to recent growth in global economy and in the euro area in particular – which creates growth opportunities and thus eases the fiscal burden in the transition countries as well. The positive developments in 2017 may also be related to the wakeup call delivered by the 2016 rise in populism. Learning from past mistakes, mainstream politicians may now understand that in order to withstand populists’ offensive, their countries need growth, which in turn implies the necessity of reforms – and these reforms should be fair and inclusive.
Denisova, I., Eller, M., Frye, T., & Zhuravskaya, E. (2009). “Who Wants To Revise Privatization? The Complementarity of Market Skills and Institutions.” American Political Science Review, 103(2), 284-304.
Guriev, S., and Treisman, D. (2017). “The popularity of authoritarian leaders: An empirical investigation.” Mimeo, UCLA.
Guriev, S. (2018) “Revisiting Structural Reforms in Transition Countries”. Proceedings Austrian National Bank’s Conference on European Economic Integration. Edward Elgar Publishing, forthcoming.
EBRD (2016a). Transition for All: Promoting Equal Opportunity in an Unequal World. Transition Report 2016-17, European Bank for Reconstruction and Development, London.
EBRD (2016b). Life in Transition: A Decade of Measuring Transition. European Bank for Reconstruction and Development, London.
EBRD (2017). Transition for All: Promoting Equal Opportunity in an Unequal World. Transition Report 2016-17, European Bank for Reconstruction and Development, London.
Milanovic, B. (2016) Global Inequality: A New Approach for the Age of Globalization. Harvard University Press.
Starmans, C., Sheskin, M. and Bloom, P. (2017). Why people prefer unequal societies. Nature Human Behavior, 1, 0082.
***
APPENDIX
Table 1. OLS regressions for trust in government
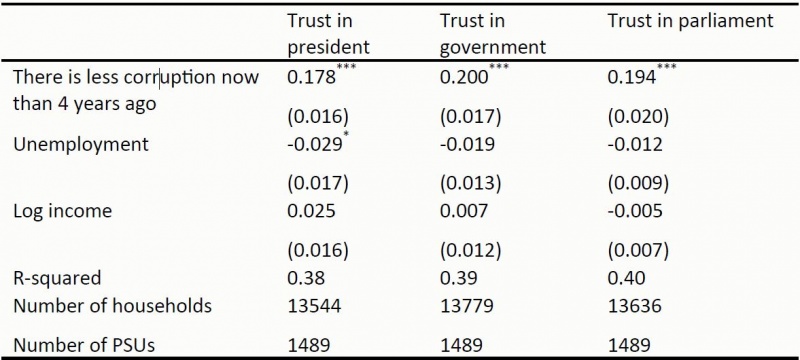
Source: Life in Transition Survey, 2010, 2016. Individual-level socio-demographic controls are included but not reported. The specification also controls for primary sampling units’ (PSUs’) fixed effects.
Table 2. Support for markets as a function of “fair” and “unfair” income inequality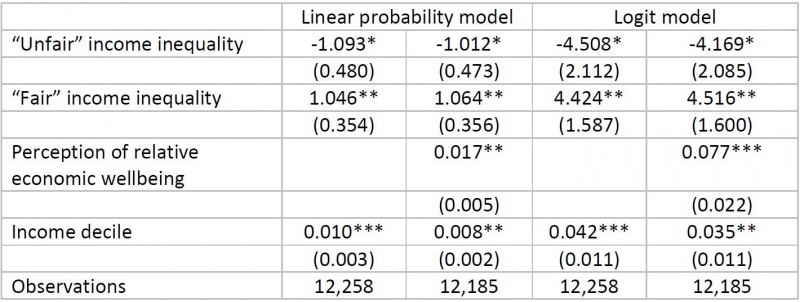
Sources: Life in Transition Survey III, World Economic Outlook, World Development Indicators and authors’ calculations.
Notes: Dependent variable: support for market economy. Perception of economic wellbeing is the self-perceived income decile (1 corresponds to the poorest decile). Income decile is the objective decile in the income distribution based on respondent’s income. Additional controls include gender, education level, age and life satisfaction, region dummies, inequality of opportunity with respect to jobs and education, country inflation, unemployment and per capita GDP. Standard errors are clustered at the country level and are shown in parentheses. *, **, and *** indicate statistical significance at the 10, 5 and 1 per cent levels, respectively.
This is a short version of the article Guriev (2018) based on the keynote lecture delivered at the Austrian National Bank’s Conference on European Economic Integration 2017.
This is consistent with Starmans et al. (2017) who show that people generally prefer fair inequality to unfair equality. The results are also consistent with the earlier analysis by Denisova et al. (2009) who show that support for privatization in transition countries is higher among skilled (and thus better-off) individuals in countries with stronger democratic institutions and better governance.
