

The views expressed in this SUERF policy brief are those of the authors and do not necessarily reflect those of the National Central Banks nor the Eurosystem.
Abstract
Using CPI microdata from nine euro area countries, we provide new evidence on price stickiness during the 2021–2024 inflation episode. In 2022, the monthly frequency of price changes rose to 12%, compared with an average of 8% over the period 2010–2019. It then declined rapidly in 2023 and more gradually in 2024, returning close to its pre pandemic level. The decline was faster for food and non energy industrial goods than for services, where price change frequencies remained elevated in 2024. The rise in the overall frequency was mainly driven by a higher share of price increases. In contrast, the average size of price increases and decreases, when considered separately, varied only slightly during the inflation surge. Products with a larger imported-energy cost share responded more strongly to the shock, and hazard-rate evidence shows that the probability of price adjustments increases with the gap between actual and optimal prices, consistent with state-dependent pricing and a steepening of the Phillips curve. These stylised facts provide a quantitative benchmark for assessing how price-setting behaviour may respond to new large shocks, including the recent rise in energy prices linked to the war in the Middle East.
The post pandemic inflation surge has renewed theoretical and empirical interest in the mechanisms of price adjustment at the micro level. In standard low inflation environments, prices are quite sticky and the frequency of price changes remains largely stable, consistent with time dependent pricing frameworks such as the Calvo model. In these models, firms’ price adjustments are exogenous to macroeconomic conditions, implying that inflation reacts with similar sluggishness to both small and large aggregate shocks. However, the 2021-2023 inflation surge challenged this view by revealing a much faster and more pervasive inflation response. Contrary to time-dependent models, state-dependent models of price stickiness predict that when inflationary shocks are large and persistent, firms endogenously adjust prices more frequently. As emphasized by Cavallo et al. (2024), in these state-dependent models, large aggregate shocks “travel fast” because firms facing sizable deviations from optimal prices accelerate price adjustments. This mechanism helps explain the speed and magnitude of the 2021-2023 inflation surge and has important implications for inflation persistence, monetary transmission, and the slope of the Phillips curve.
While consumer prices are well known to be highly sticky in low inflation environments (see Dhyne et al., 2006, and Gautier et al., 2025, for evidence in the euro area, and Nakamura and Steinsson, 2008, for the United States), much less is understood about how retailers adjust prices when faced with large aggregate cost shocks, such as those experienced during the 2021–2023 inflationary episode. Recent evidence on consumer price adjustment includes Cavallo et al. (2024) and Montag and Villar (2025) for consumer prices in the United States or Gagliardone et al. (2025) for producer prices in Belgium, while Bunn et al. (2026) provide direct evidence on state-dependent behaviour of UK firms.
In Gautier et al. (2026), we document new stylised facts on price rigidity in the euro area during the 2021–2024 period. Our analysis uses highly granular CPI microdata for nine euro-area countries (Austria, Estonia, France, Germany, Greece, Italy, Latvia, Lithuania and Spain, together covering 83% of the euro area HICP) and is based on nearly 190 million individual price quotes over the period 2010–2024.
For each country, we compute several moments of the price adjustment distribution, such as the frequency and the average size of price changes, at the product level. The analysis is conducted on a harmonized sample of 166 detailed product categories covering food, non-energy industrial goods, and services, which together represent around 60% of the HICP consumption basket. These moments are then aggregated to construct euro area-wide statistics.
The 2021–2023 inflationary episode, a large, broad-based shock occurring after a decade of low and stable inflation, provides the before-and-after design that makes these statistics analytically powerful. Three main stylised facts stand out.
Before 2020, the monthly frequency of price changes was stable at around 8.2% in the euro area with very little heterogeneity across the nine euro-area countries. It then rose sharply in 2022, averaging about 12% that year and peaking at 15.7% in January 2023, almost double the pre-pandemic average (Figure 1). This rise was widespread: more than two-thirds of individual product categories showed a statistically significant increase in frequency of price changes in 2022. However, the magnitude of the increase differed across sectors: food experienced the largest increase (7 percentage points above its 2019 average in 2022) while non-energy industrial goods and services each rose by around 3 to 3.5 percentage points.
Figure 1. Monthly frequency of price changes, increases and decreases in the euro area
(excluding sales)
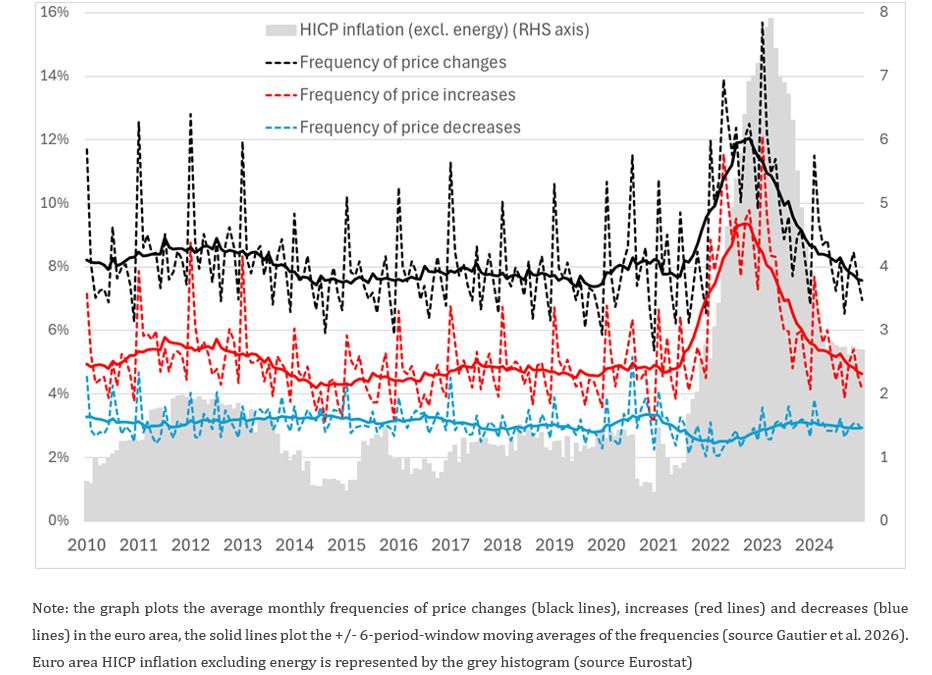
The frequency of price changes subsequently fell, returning close to its pre-pandemic level in 2024 for food and non-energy industrial goods, but it declined more slowly for services, where the frequency remained about 2 percentage points above its pre-pandemic average in 2024.
Repricing shifts emerge as a systematic feature of the 2021-2023 inflationary episode across all euro area countries. The increase in the frequency of price changes in 2022 was particularly pronounced in the Baltic states, which were exposed to larger inflation shocks. This result stands in sharp contrast to the absence of cross-country heterogeneity in price stickiness during the preceding low inflation period.
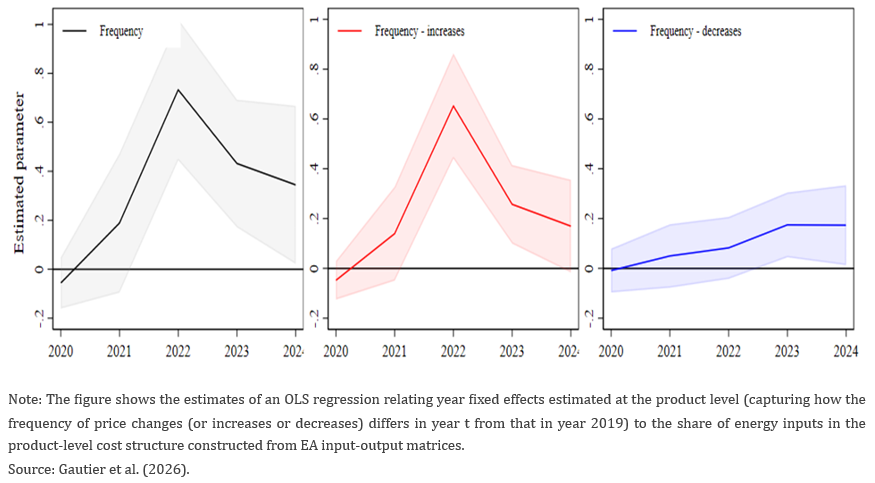
A similar pattern arises in cross sectional regressions at the product level. We find that products with a higher share of imported energy inputs experienced significantly more frequent price adjustments in 2022 and 2023, whereas no such relationship is observed in 2020 or 2021 (Figure 2). This selective sensitivity to cost exposure provides strong evidence of state dependent pricing, whereby firms adjust prices more quickly as the gap between their actual price and their optimal price widens.
Figure 2. Cross-sectoral frequency of price changes in 2020-2024 and the share of imported energy and raw material input
The differential response of goods and services prices to the inflation surge is itself highly informative. The slower normalization observed in services reflects both a structurally lower degree of state dependence (characterized by more stable price adjustment probabilities (ie. flatter hazard rates) and stronger seasonal concentration of price changes, notably in January), and the persistence of wage pressures that extended into 2023–2024. Empirical estimates of monetary policy transmission show that transmission lags to services inflation are substantially longer than for headline inflation, with the peak impact taking more than two years to materialise (Zlobins, 2025). The product-level results in Gautier et al. (2026) provide some evidence on micro-level mechanisms behind this heterogeneity.
During the post-pandemic inflation surge, the average size of non zero price changes increased from about 1.5% before the pandemic to 5.5% in 2022 (Figure 3). At a first glance, this pattern could be interpreted as firms implementing larger individual price adjustments. However, Gautier et al. (2026) show that this conclusion is misleading. The increase is driven almost entirely by a compositional effect: the surge in price adjustment primarily reflects a sharp rise in the frequency of price increases, combined with a modest decline in the frequency of price decreases (Figure 1). Prior to the pandemic, roughly two thirds of all price changes were increases, whereas by 2022 this share had risen to 82%.
Figure 3. Monthly average of (non-zero) price changes, increases and decreases in the euro area
(excluding sales)
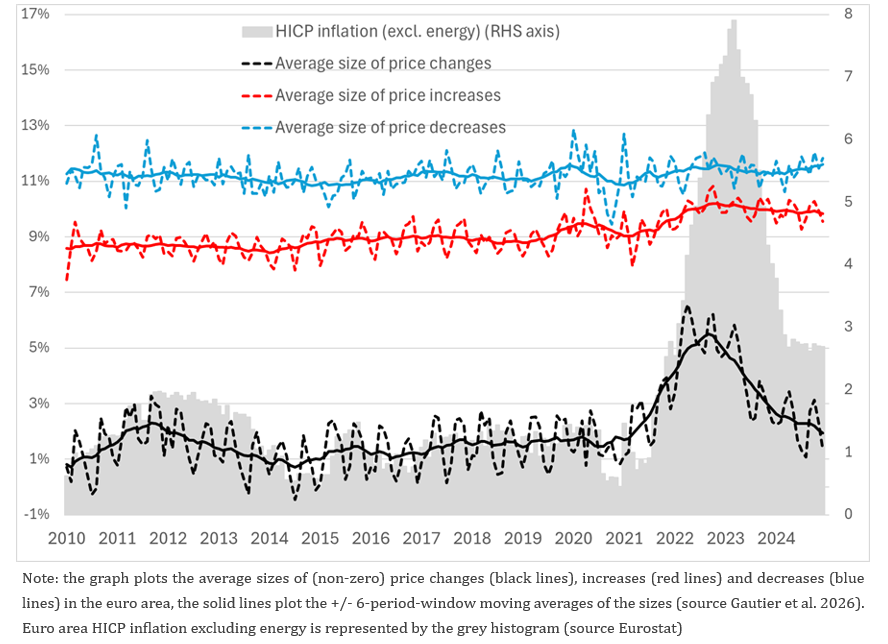
Both the average size of price increases and the average size of price decreases, taken separately, barely moved. The distribution of price changes shifted toward increases and away from decreases, while the shape of the distribution remained essentially stable. The higher moments of the price change distribution, including kurtosis, were marginally affected during the surge.
This pattern has a clear theoretical interpretation. In a state dependent pricing framework, an increase in production costs forces firms to choose between keeping prices unchanged (thereby accepting a temporary reduction in profits because their price falls below the desired level) or paying the fixed cost of adjusting prices. When costs rise sharply, an increasing number of firms face the prospect of substantial profit losses if they do not reprice. In such circumstances, it becomes optimal for many firms to increase their prices immediately rather than tolerate large deviations from their optimal price. The resulting adjustment dynamics closely mirror the empirical evidence: a sharp increase in the frequency of price increases, a decline in the frequency of price decreases, and largely stable conditional sizes of price increases and decreases when considered separately.
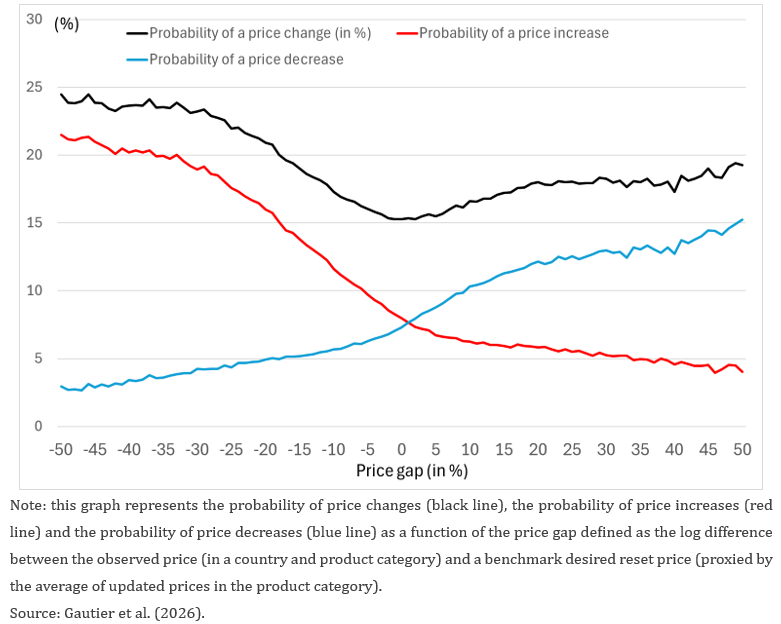
To provide more direct evidence of state dependence in consumer prices, we investigate the shape of empirical hazard rates. These are defined as the probability of adjustment as a function of the estimated gap between actual and optimal benchmark prices. Measuring the price gap is empirically challenging because the frictionless price is unobserved and must be proxied. To circumvent this problem, we follow the existing literature (Karadi et al., 2023) and proxy the frictionless price for each product category with the average reset price across all prices that are revised in the same month. We then calculate the price gap as the log difference between each price observation and this average price.
We find evidence that retailers are indeed more likely to adjust prices when mispricing is larger. Figure 4 shows that the probability of a price change increases with the absolute price gap, meaning that when the price gap is larger, retailers are more likely to adjust their prices. We document that hazard rates follow such a V-shaped pattern in all nine countries and across all major sectors. The slope varies across sectors, being steeper for food and non-energy industrial goods and flatter for services, consistent with the differing price dynamics of goods and services observed during the inflation normalisation.
Figure 4. Adjustment hazard rates as a function of the price gap
We also relate product-level inflation to its two components: the extensive margin (how often prices change) and the intensive margin (how large those non-zero changes are). In the low-inflation period, the intensive margin dominated: most of the variation in product-level inflation came from variation in the size of price changes rather than their frequency. During the surge, the extensive margin (the frequency of price changes) became significantly more correlated with product-level inflation than in “normal” times.
Local projection regressions linking counterfactual inflation rates to oil supply news shocks confirm that the extensive margin responded more strongly to those shocks during the high-inflation period than before, while the contribution of the intensive margin remained broadly similar. This shift from intensive to extensive margin dominance under large shocks is a typical feature of state-dependent models.
Finally, a simple macro-model counterfactual quantifies the aggregate impact: had the frequency of price changes remained at its pre-pandemic level, as a standard Calvo model would imply, the peak in euro area inflation would have been approximately one percentage point lower.
Overall, the euro area inflation surge of 2021–2023 reflected not only a higher inflation environment, but also a fundamental shift in repricing behavior. Micro level evidence shows that state dependence, a key behavioral mechanism generating nonlinear inflation dynamics, is present in euro area consumer prices and operates with economically meaningful magnitude. The price rigidity statistics documented by Gautier et al. (2026), computed at the product level for nine countries over more than a decade, therefore constitute a natural empirical foundation for several active research areas.
Alvarez et al. (2022) demonstrate that the kurtosis and the frequency of price changes are sufficient statistics for the real effects of monetary shocks across a broad class of models, making these moments central inputs for assessing monetary non neutrality. Karadi et al. (2024) show that the degree of state dependence in repricing critically shapes the sacrifice ratio following large shocks: when the frequency of price changes rises, prices become more flexible, reducing the output cost of disinflation and allowing central banks to lean more forcefully against inflationary pressures. Recent work integrating state dependent pricing with production network structures highlights how supply side shocks can trigger rapid, cascading repricing dynamics that are largely absent from demand focused frameworks (Ghassibe and Nakov, 2025). By providing granular sectoral moments of the price change distribution during the 2021-2023 inflationary episode across the euro area, Gautier et al. (2026) provide essential empirical inputs for these frameworks and for the broader question of how pricing mechanisms shape monetary transmission in a large currency union.
Given the importance of price stickiness in the transmission of shocks, closely monitoring high frequency indicators of price rigidity can also help to assess potential inflationary risks arising from the conflict in the Middle East and how this shock might propagate to consumer prices in the euro area. The frequency-of-price-adjustment statistics – ideally at the sectoral and product level – can provide a valuable complement to standard inflation indicators and help to gauge whether firms are in a state-dependent or time-dependent regime and therefore how quickly inflation will respond to new shocks and to monetary policy.
Alvarez F., F. Lippi, A. Oskolkov, (2022) “The Macroeconomics of Sticky Prices with Generalized Hazard Functions”, The Quarterly Journal of Economics, Volume 137, Issue 2, May 2022, Pages 989–1038, https://doi.org/10.1093/qje/qjab042
Bunn, P, N Bloom, C Menzies, P Mizen, G Thwaites and I Yotzov (2026), “State and Time-Dependent Pricing”, NBER Working Paper No. 34666.
Cavallo, A, F Lippi, and K Miyahara (2024), “Large Shocks Travel Fast.” American Economic Review: Insights 6 (4): 558–74.
Dhyne, E., Álvarez, L., Le Bihan, H., Veronese, G., Dias, D., Hoffmann, J., Jonker, N., Lünnemann, P., Rumler, F., and Vilmunen, J. (2006). Price Changes in the Euro Area and the United States: Some Facts from Individual Consumer Price Data. Journal of Economic Perspectives, 20(2):171–192.
Gagliardone, L., M. Gertler, S. Lenzu, and J. Tielens (2025). Micro and macro cost-price dynamics in normal times and during inflation surges. VoxEU.org, 6 June.
Gautier, E, C Conflitti, R P Faber, B Fabo, L Fadejeva, V Jouvanceau, J-O Menz, T Messner, P Petroulas, P Roldan-Blanco, F Rumler, S Santoro, E Wieland and H Zimmer (2024). New Facts on Consumer Price Rigidity in the Euro Area. American Economic Journal: Macroeconomics 16(4): 386–431.
Gautier, E, C Conflitti, D Enderle, L Fadejeva, A Grimaud, E Gutiérrez, V Jouvanceau, J-O Menz, A Paulus, P Petroulas, P Roldan-Blanco and E Wieland (2026), “Consumer Price Stickiness in the Euro Area During an Inflation Surge”, ECB Working Paper 3181.
Ghassibe, M. and Nakov, A. (2025). Business Cycles with Pricing Cascades. Working Paper 3123, ECB.
Karadi, P., Amann, J., Bachiller, J. S., Seiler, P., and Wursten, J. (2023). Price Setting on the Two Sides of the Atlantic-Evidence from Supermarket Scanner Data. Journal of Monetary Economics, 140:1–17.
Karadi, P., Nakov, A., Nuno, G., Pasten, E., and Thaler, D. (2024). Strike While the Iron is Hot: Optimal Monetary Policy with a Nonlinear Phillips Curve. BIS Working Paper No. 1203
Montag, H. and Villar, D. (2025). Post-Pandemic Price Flexibility in the U.S.: Evidence and Implications for Price Setting Models. Finance and Economics Discussion Series 2025-024, Board of Governors of the Federal Reserve System.
Nakamura, E. and Steinsson, J. (2008). Five Facts about Prices: A Reevaluation of Menu Cost Models. The Quarterly Journal of Economics, 123(4):1415–1464.
Zlobins, A (2025), “Monetary Policy Transmission in the Euro Area: Is this Time Different? Chapter I: Lags and Strength”, Latvijas Banka Working Papers 2025/01.