This policy note is based on “Repo Collateral Reuse and Liquidity Windfalls”. The views expressed do not necessarily reflect those of the European Central Bank. We thank Maren Ulm, Benoît Nguyen, Loriana Pelizzon, Iñaki Aldasoro, Guido Della Valle, Sebastian Infante, Vagia Iskaki, Peter Schmidt, Andreas Biewald, Björn-Jakob Treutler, Arne Reichel, Tobias Linzert, Felix Hermes, Mark Paddrik, Sriram Rajan, Christoph Rieger, Mark Wahrenburg and Richard Comotto for helpful comments.
Abstract
Collateral reuse in repo markets helps entities meet short-term funding needs, maintain market efficiency, and anchor collateral valuations, although it creates risks through interconnectedness. A prominent view in the literature is that securities dealers use their market position to obtain temporary free-cash wedges from differences in collateral requirements when reusing collateral, so-called “liquidity windfalls”. However, the evidence has been largely theoretical with limited empirical work. Using a novel, confidential regulatory dataset on European Securities Financing Transactions, this study helps fill that gap. We find that approximately 11.6% of European repo transaction volume is based on reused securities, averaging more than 49 billion euros per day. Moreover, contrary to the liquidity windfalls hypothesis, dealers do not seem to systematically obtain extra liquidity through collateral reuse in repos.
The repurchase agreement (repo) market, where participants sell securities with a commitment to buy them back later, is one of the main sources of wholesale funding in modern finance. Collateral, the security backing the transaction, is essential: it mitigates counterparty credit risk, facilitates short-term financing, and in some cases is the primary object of the transaction itself. In Europe, outstanding repos and reverse repos reached EUR 12.5 trillion July 2025 (ICMA, 2025).
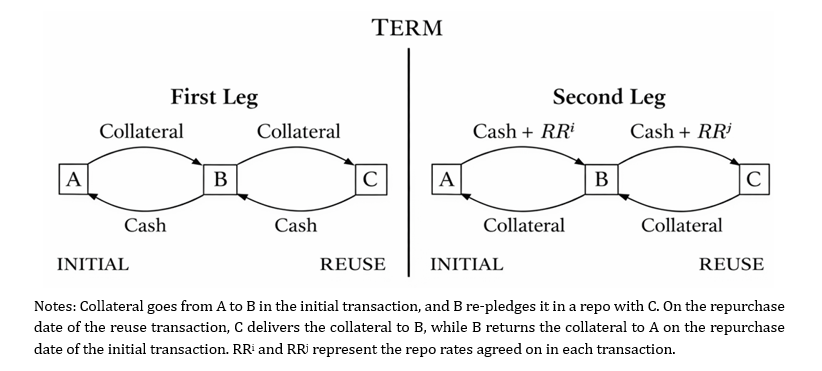
In European repo arrangements the cash lender typically gains legal title over the received collateral and may re-deploy it in subsequent transactions. This practice, known as collateral reuse, can enhance market efficiency by increasing the effective supply of available collateral and unlocking additional liquidity from existing holdings. However, reuse also creates collateral chains, interlinked transactions where the same security is re-transferred multiple times across institutions – raising systemic concerns. These chains amplify interconnectedness: during stress or a major default, disruptions can propagate through them, triggering margin calls, fire sales, and broader instability. Empirical evidence also links excessive reuse to increased volatility, delivery failures, and asset mispricing (Jank, Moench, and Schneider, 2022).
Figure 1. Illustration of collateral reuse in a Repurchase Agreement
Empirical research on collateral reuse remains constrained by data limitations. Reported reuse rates vary substantially across studies: 5% in Switzerland (Fuhrer, Guggenheim, and Schumacher, 2016), 3.4% in Australia (Issa and Jarnecic, 2024), 53% using European MMSR data (Inhoffen and van Lelyveld, 2024), 75% for German banks (Jank, Moench, and Schneider, 2022), and 85% among large U.S. primary dealers (Infante, Press, and Saravay, 2020).
Most prior studies focus on large banks or dealer segments and use datasets that combine different types of securities financing transactions, limiting repo-specific identification. Using confidential transaction-level data from the Securities Financing Transactions Data Store (SFTDS), we that 11.6% of European repo volume involves reused collateral form previous repos. Besides, conditional on the incidence of reuse, collateral chains formed by those transactions include on average three nodes. Reuse is mainly driven by counterparty identity rather than deal terms or collateral features.
We also investigate the hypothesis that large securities dealers exploit their intermediary position to extract ”liquidity windfalls’”: by imposing higher haircuts when lending cash (receiving more collateral) than they face when re-deploying it (obtaining more cash), dealers pocket a temporary surplus. The findings do not support this conjecture: dealers reuse collateral actively but do not systematically obtain extra liquidity when doing so.
As layer of protection against fluctuations in collateral value, repos typically include over-collateralization in the form of a “haircut”, a discount on the collateral’s market value relative to its purchase price.
For instance, a cash borrower seeking $100 while facing a 2% haircut must commit collateral worth approximately $102.04.
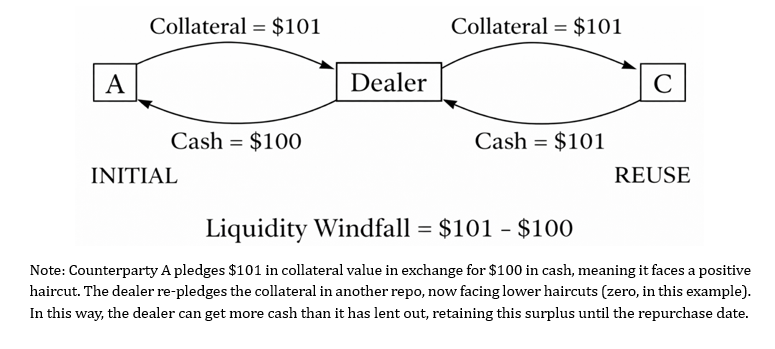
The concept of “liquidity windfalls” (Infante, 2019) posits that dealers intermediate collateral by imposing a larger haircut when lending cash than the one they face when re-pledging the same collateral, thereby extracting a temporary cash surplus. Further academic work with this notion as an underlying assumption include Infante and Vardoulakis (2021), which model coordination failures arising from dealers’ reliance on windfalls, and Kruttli, Monin, and Watugala (2022), arguing that distressed prime brokers may maintain credit to hedge funds precisely because of this extra liquidity.
Figure 2. Illustration of the concept of liquidity windfalls
More importantly, this principle would imply far-reaching implications in financial markets. The advent of temporary extra liquidity encourages dealers to expand their matched book — each reverse repo mirrored by an offsetting repo — thereby inflating gross positions while net exposure remains small. Because these positions are financed almost entirely with borrowed cash, leverage rises without additional equity, increasing fragility. This leverage spiral is formalized in Brumm et al. (2023). Besides, expanding collateral chains, dealers can become exposed to a cascade of events where: (i) over-collateralized counterparties refuse to roll over trades during stress; (ii) the dealer must return securities already reused; and (iii) it is forced to scramble for replacement collateral or fire-sell assets. This sequence matches the “repo runs” of the 2008 Global Financial Crisis (Copeland, Martin, and Walker, 2014).
At the macro level, haircut-driven cash wedges act as a quiet subsidy to dealers’ funding costs, potentially weakening policy-rate pass-through to repo rates (Eisenschmidt, Ma, and Zhang, 2024) and allowing dealers to quote thinner bid-ask spreads as a consequence of cheaper balance-sheet space (Huh and Infante, 2021; Adrian, Boyarchenko, and Shachar, 2017). If those costs rise later (i.e., the liquidity windfalls are eliminated for some reason), the yield curve should shift accordingly (Du, Hébert, and Li, 2022).
We use data from the novel Securities Financing Transactions Data Store (SFTDS). SFTDS derives from the Securities and Financing Transactions Regulation (SFTR, Regulation (EU) 2015/2365), a comprehensive reporting framework requiring all EEA-established entities, their branches located outside the EEA, and branches of non-EEA firms operating within the EEA to report their Securities Financing Transactions. ESMA is responsible for the overall management of the Securities Financing Transactions Regulation (SFTR) reporting regime, which includes defining technical standards, supervising Trade Repositories that collect SFT data and ensuring the quality of it.
Data is available daily since July 2020, including counterparty LEIs, transaction dates, amounts, repo rates, haircuts, currency, counterparty sector, collateral ISINs, and issuer information. To avoid double-counting, our dataset undergoes the deduplication process described in Pelizzon et al. (2026).
SFTDS offers key advantages over the widely used MMSR dataset, used in some seminal studies (Barbiero, Schepens and Sigaux, 2024; de Souza and Hudepohl, 2024). First, it contains separate tables for repos, securities lending, and margin lending, enabling us to isolate repo-to-repo reuse. Second, it broadens reporting beyond large banks to include non-bank financial institutions (NBFIs). Third, centrally cleared trades identify the final cash borrower and lender, enabling deeper counterparty analysis.
After the cleaning process our sample comprises 15 million transactions, consisting of repos involving Euro-Area participants ranging from January 2021 to March 2025. Government bonds represent roughly 90% of the collateral, the remaining part consisting almost exclusively of corporate bonds.
We employ a two-fold algorithm in the spirit of Fuhrer, Guggenheim, and Schumacher (2016). First, transactions are sorted by purchase date, maturity, and collateral value. The algorithm then iterates through each transaction and flags a subsequent one as a “possible reuse” if: (i) the purchase date is not earlier, (ii) the same ISIN is transferred, (iii) the collateral provider in the second transaction is the collateral taker in the first, and (iv) the purchase date of the second does not exceed the repurchase date of the first.
There are two key deviations from prior algorithms. Unlike Fuhrer, Guggenheim, and Schumacher (2016), we do not require the reuse transaction’s repurchase date to precede the initial one, as entities can source the same bond elsewhere — the authors themselves find roughly double the reuse rate when relaxing this condition. Besides, unlike Inhoffen and van Lelyveld (2024), we restrict each reuse transaction to a single initial transaction, reflecting fungibility and traders’ limited information about the origin of transferred collateral. The second fold of the algorithm reconstructs full chains by linking pairs sequentially. Over 961 trading days, 2,174 institutions transferred 5,502 securities, with settled repos totalling around EUR 363 trillion.
We identify 1.34 million initial transactions (8.8%) and 3.24 million reuse trades (21.2%), involving 2865 re-pledged securities. Notably, 0.89 institutions act as cash lenders in reuse but only 547 as collateral providers, suggesting that specific market conditions are needed to supply reused collateral. As Table 1 shows, reuse is heavily concentrated in day-to-day maturities (93.9% of reuse transactions, 89.2% of volume), while initial transactions are more spread across tenor buckets.
Table 1. Distribution of Initial vs. Reuse by Maturity
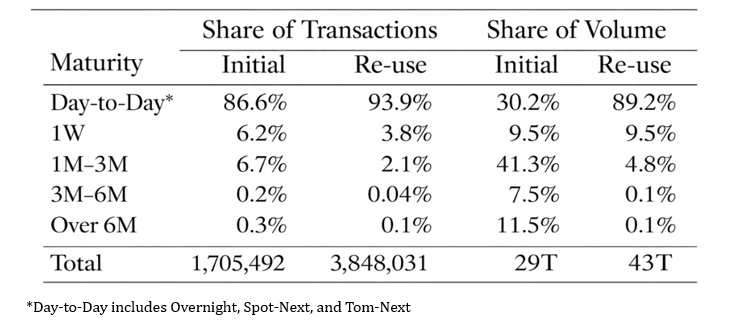
Figure 3 presents the evolution of the daily collateral value transferred in repos. We see a growth in total value from EUR 307 billion to EUR 495 billion (61%) over the sample, while reused collateral expanded from EUR 35 billion to EUR 58 billion (66%), confirming that reuse tracks overall market growth.
Figure 3. Transferred Collateral – Total vs. Reuse
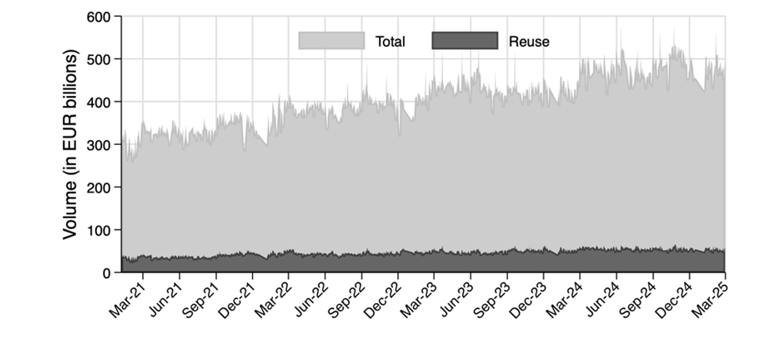
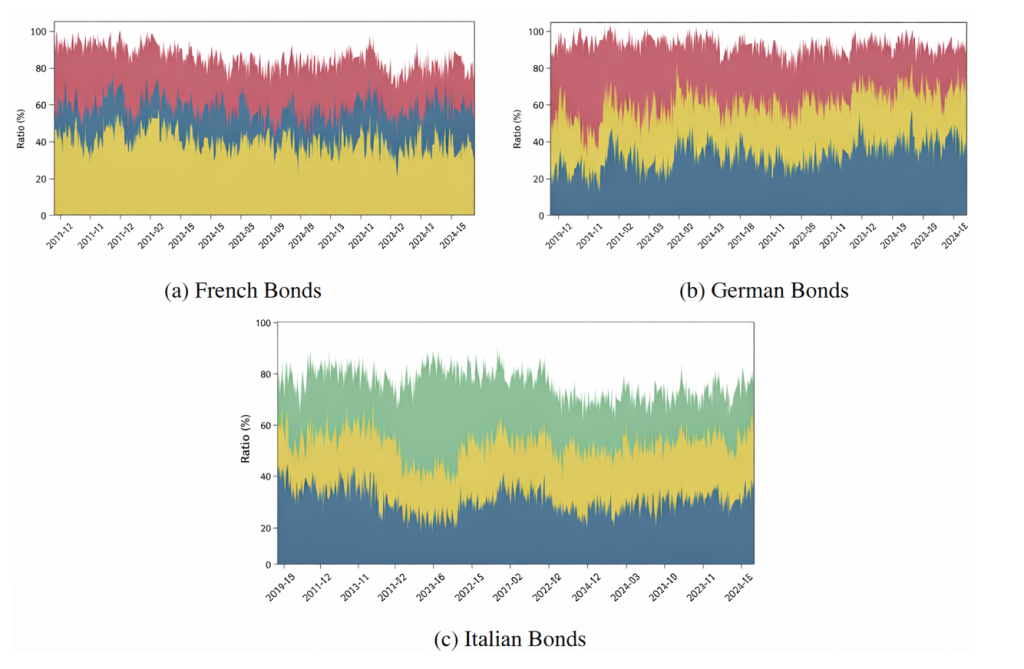
Figure 4 decomposes reuse by counterparty country for German, French, and Italian bonds. British counterparties are active reusing French and German bonds but largely absent for Italian collateral. Perhaps surprisingly, domestic entities are not always the main ones driving reuse of their own sovereign bonds.
Figure 4. Reuse of Top 3 Bonds – Entity Country Decomposition
We pick two metrics to report the extent of collateral reuse in the repo market. The first one is the reuse rate, defined as the proportion of repo transactions in a given period that are backed by reused collateral.
Simply put, we compute the ratio of reused collateral to total outstanding collateral per period (in our case, daily). This measure provides insight into the ability of market participants to generate additional liquidity by re-using collateral (FSB, 2017b).
Figure 5. Average Daily Reuse Rate
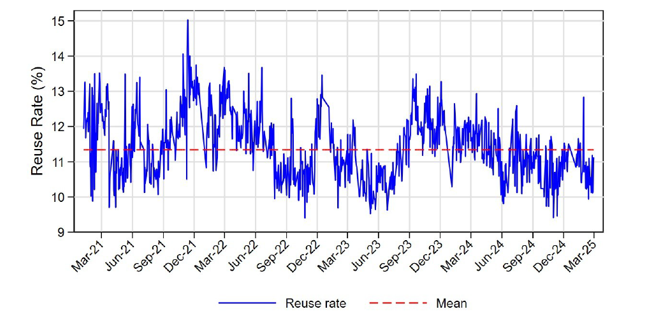
The average reuse rate stands at 11.63% (standard deviation 0.85%), ranging from 9.18% to 15.25%. A persistent downward level shift from July 2022 coincides with the ECB’s rate-hiking cycle, possibly reflecting reduced collateral demand as the market turned more cash-driven. When compared to other studies that focus on repo-repo collateral reuse, our rate is above Issa and Jarnecic (2024) (3.4%) and Fuhrer, Guggenheim, and Schumacher (2016) (5%), while consistent with our less restrictive algorithm — the latter find 10% under similar conditions.
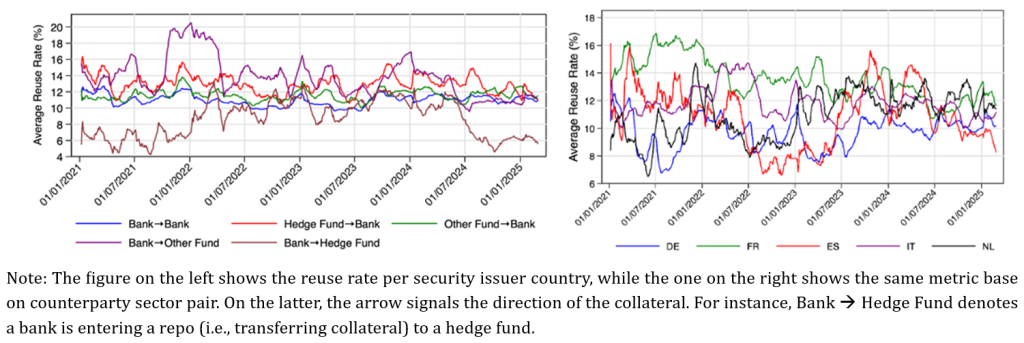
Figure 6. Reuse Rate Selected Breakdown
The second metric is the average reuse chain length. Our algorithm can track the path from the first collateral provider to the last collateral taker. To the best of our knowledge, our work is the first to directly measure collateral chains, rather than estimating them through other measures of reuse. This is an important development in financial market microstructure and, despite not being the focus of this note, we have forthcoming deeper analyses on that side.
Figure 7. Illustration of collateral chains
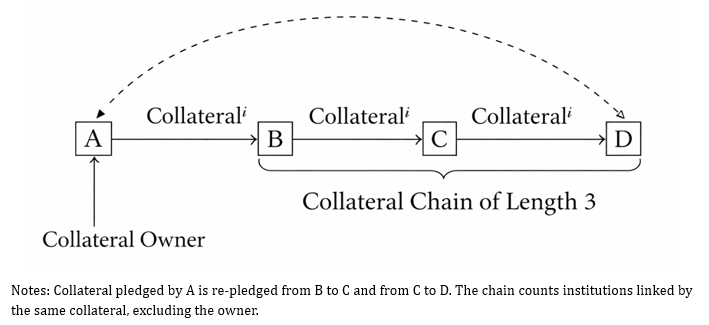
The average chain length is a measure of interconnectedness among market participants, which are linked by the same collateral being re-deployed in subsequent transactions. Any issue faced by one node in the chain may cause distress along the entire sequence, potentially triggering problems in transaction settlements (e.g., a cascade of failures to deliver reused collateral) that can undermine market confidence and worsen deal terms for those seeking collateral.
Figure 8. Average Daily Reuse Chain Length
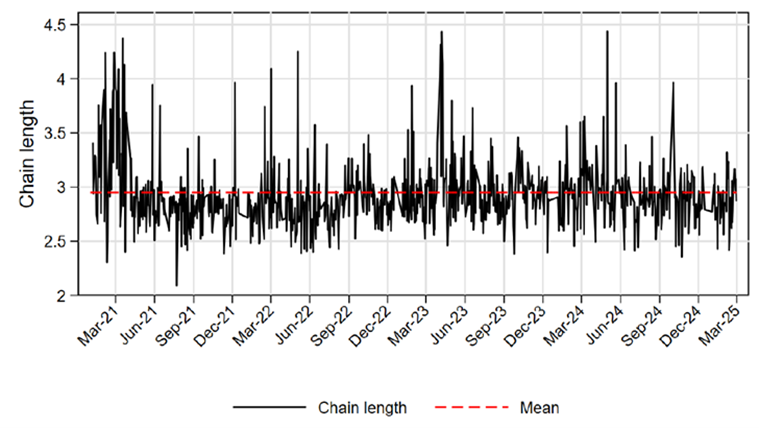
The average chain length is 2.95 (3.05 for sovereign bonds only), stable throughout the sample and never below 2. This is consistent with Singh’s (2011) (pre-crisis) ”collateral velocity” of around 3, suggesting chains have rebounded to pre-Lehman levels.
We identify determinants of collateral reuse across three groups of characteristics: transaction, counterparty, and collateral. On the transaction side, smaller and shorter-maturity deals are more likely to involve reuse, consistent with risk exposure and repurchase date logic. Higher financial instability reduces reuse probability, suggesting agents are wary of collateral chain risks during stress periods. Traditional monetary policy tightening seems to have no meaningful immediate effect on reuse decisions.
Most importantly, counterparty identity proves to be the most powerful explanatory factor, particularly for sovereign repos. In special, market stance and institutional positioning, rather than measurable attributes, drive reuse, highlighting the importance of connections in this market. Collateral characteristics matter relatively little, likely because eligible repo securities already meet high quality standards; German and French bonds are nonetheless less likely to be reused, possibly because they serve better alternative purposes as high-quality safe assets.
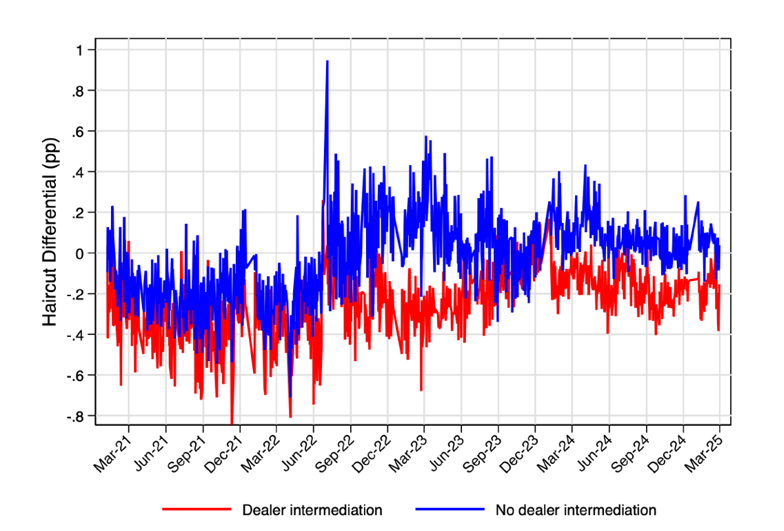
We test whether dealers generate liquidity windfalls by charging higher haircuts when sourcing collateral than when reusing it. The evidence cuts strongly against this hypothesis. Across our approximately 2 million reuse chains, the average haircut differential is negative (–9 bps), meaning that entities reusing collateral actually surrender value rather than pocket a cash buffer. Dealer intermediation makes this worse, not better: when a dealer sits between two non-dealers, the differential drops to –23 bps on average, while direct non-dealer chains show no differential at all.
Figure 9. Average Haircut Differentials – Dealer vs. non-dealer intermediation
Clearing structure turns out to be a key dimension of this result. There is essentially no haircut spread when collateral cycles within bilateral OTC trades, but the gap becomes significantly more negative when a position moves from OTC into central clearing. The opposite direction — CCP-sourced collateral reused bilaterally — is the only setting where we find any hint of a positive differential for dealers, though at just 5 bps it carries little economic weight. CCP-to-CCP rolls command the steepest penalty, at –145 bps. Controlling for self-selection and a rich set of fixed effects, our estimates confirm an average differential of –77 bps, implying a systemic daily liquidity shortfall of around €460 million (considering the average reuse volume of €60 billion). Dealer intermediation remains indistinguishable from zero across virtually all specifications, rejecting the windfall hypothesis. Finally, we find a positive relationship between repo rate differentials and haircut differentials, indicating that there is no trade-off between the two. The broader takeaway is that collateral reuse does not appear to amplify leverage through thinning equity buffers, and that monetary policy transmits through the repo rate channel rather than through margin dynamics, making the system more resilient to collateral-run spirals than theoretical windfall models would suggest.
Figure 10. Average Haircut Differential per Clearing Structure Pair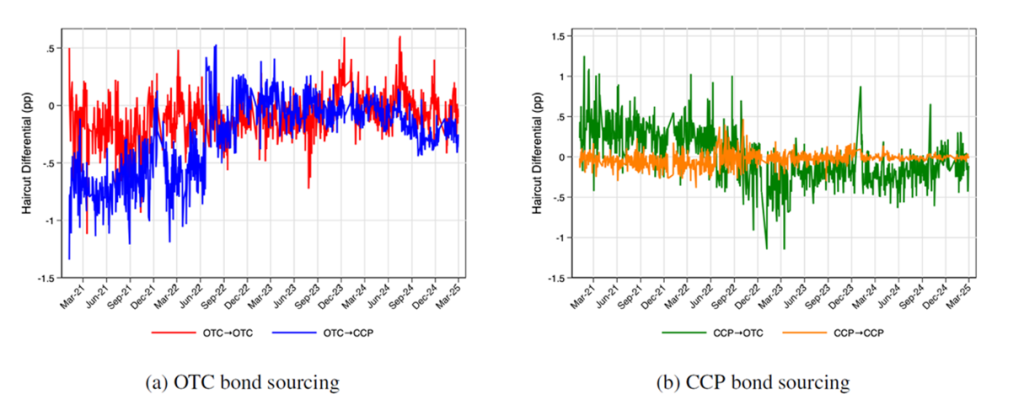
Our findings suggest that the financial stability risks from collateral reuse are different from what theory predicts. Since dealers do not systematically extract haircut advantages when intermediating collateral, the concern that reuse progressively erodes equity buffers and creates conditions for collateral runs is not supported by the data. That said, reuse is widespread: around €49 billion per day moving through chains of roughly three institutions on average. The interconnectedness it creates remains worth monitoring. The key takeaway for regulators is that policies targeting haircut asymmetries would address a mechanism that does not appear to exist in practice, while the more relevant risk lies in the network structure of who is trading with whom. Supervision focused on counterparty relationships and chain exposures is therefore likely to be more effective than collateral-focused regulation.
Adrian, T., Boyarchenko, N., and Shachar, O. (2017). Dealer balance sheets and bond liquidity provision. Journal of Monetary Economics, 89, 92–109.
Barbiero, F., Schepens, G., and Sigaux, J.-D. (2024). Liquidation value and loan pricing. Journal of Finance, 79, 95–128.
Brumm, J., Grill, M., Kubler, F., and Schmedders, K. (2023). Reuse of collateral: Leverage, volatility, and welfare. Review of Economic Dynamics, 47, 19-46.
Carrera de Souza, T., and Hudepohl, T. (2024). Frictions in scaling up central bank balance sheet policies: How Eurosystem asset purchases impact the repo market. Journal of Banking & Finance, 158, 107037.
Copeland, A., Martin, A., and Walker, M. (2014). Repo runs: Evidence from the tri-party repo market. The Journal of Finance, 69(6), 2343-2380.
Du, W., Hébert, B., and Li, W. (2022). Intermediary balance sheets and the treasury yield curve. Journal of Financial Economics.
Eisenschmidt, J., Ma, Y., and Zhang, A. L. (2024). Monetary policy transmission in segmented markets. Journal of Financial Economics, 151, 103738.
Financial Stability Board (FSB) (2017b). Non-Cash Collateral reuse: Measure and Metrics. Report, Financial Stability Board, Basel, Switzerland.
Fuhrer, L. M., Guggenheim, B., and Schumacher, S. (2016). Re-use of collateral in the repo market. Journal of Money, Credit and Banking, 48(6), 1169-1193.
Huh, Y., and Infante, S. (2021). Bond market intermediation and the role of repo. Journal of Banking & Finance, 122, 105999.
ICMA [International Capital Market Association] (2025). European Repo Market Survey Number 49.
Infante, S. (2019). Liquidity windfalls: The consequences of repo rehypothecation. Journal of Financial Economics, 133(1), 42-63.
Infante, S., Press, C., and Saravay, Z. (2020). Understanding collateral reuse in the US financial system. In AEA Papers and Proceedings, Vol. 110, pp. 482-486.
Infante, S., and Vardoulakis, A. P. (2021). Collateral runs. The Review of Financial Studies, 34(6), 2949- 2992.
Inhoffen, J., and van Lelyveld, I. (2024). Safe asset scarcity and reuse in the European repo market. Tinbergen Institute Discussion Paper.
Issa, G., and Jarnecic, E. (2024). Collateral reuse as a direct funding mechanism in repo markets. Pacific- Basin Finance Journal, 86, 102449.
Jank, S., Moench, E., and Schneider, M. (2022). Safe asset shortage and collateral reuse. CEPR Discussion Papers, No. 16439.
Kruttli, M. S., Monin, P. J., and Watugala, S. W. (2022). The life of the counterparty: Shock propagation in hedge fund-prime broker credit networks. Journal of Financial Economics, 146(3), 965-988.
Pelizzon, L., Poinelli, A., Tomio, D., Nguyen, B., & Linzert, T. (2026). Inelastic demand and elastic supply: Pricing in the repo market. Working paper.
Singh, Manmohan (2011). Velocity of pledged collateral: analysis and implications. International Monetary Fund, Working Paper 11/256.