This policy brief is based on ECB Working Paper Series, No 3059. The views expressed in this brief are those of the authors and do not necessarily reflect the position of the ECB or the Eurosystem
Abstract
Climate change is affecting how investors assess and ultimately price commercial real estate (CRE) in the euro area. Using data from 2007–2023, new research finds that buildings exposed to physical climate risks—like floods and heat stress—are penalized in market prices, and that this discount is rising. Yet, overall this repricing does not seem to have harmed market liquidity, indicating an orderly adaption to climate change. However, for older buildings transition risks seem to materialise via falling liquidity in addition to falling prices, suggesting that vulnerable properties may already be in danger of becoming “stranded assets”. These findings have important implications for financial stability and green transition policy. While markets appear to be adapting, policymakers must guard against sudden, disruptive corrections.
Commercial real estate (CRE) is a key element of the European economy. It is an important asset on the balance sheets of firms, insurers and funds, and it backs around 40% of euro area firms’ collateralized loans (Horan et al., 2023). However, many CRE assets are exposed to physical hazards or are built in ways that are incompatible with climate-related regulations. This poses a threat to the financial system as falling asset values have consequences for collateral values, firm solvency, and funds’ and insurers’ balance sheets. In a recent ECB working paper (Foerster et al, 2025), we combine a large data set of euro area office building transactions with data capturing regional differences in physical risks1, enabling us to study CRE climate risk pricing in the euro area for the first time. This in turn allows us to understand if CRE investors’ pricing behaviour points toward a gradual adjustment to such risks or if sudden, disorderly shifts might be looming.
We find clear evidence that investors have been accounting for buildings’ exposure to physical risks since at least 2012 and that the discount applied to risky buildings has increasing significantly over time. We use regression analysis to study the impact of physical risk exposure on building prices – specifically to study changes in the price discount applied to high-risk properties over time. Our model allows us to take into account other – potentially correlated – factors such as regional socio-economic dynamics (e.g. GDP and population growth), country and year-specific effects or price differences that are due to the property being located in central business districts.
Figure 1 shows the change in discount for each year in our sample compared to 2007.2 We find a clear shift in pricing in the run-up to the Paris Agreement and by the end of our studied sample the penalty applied to high-risk buildings has increased by 24 percentage points – so its effects are both economically and statistically significant.
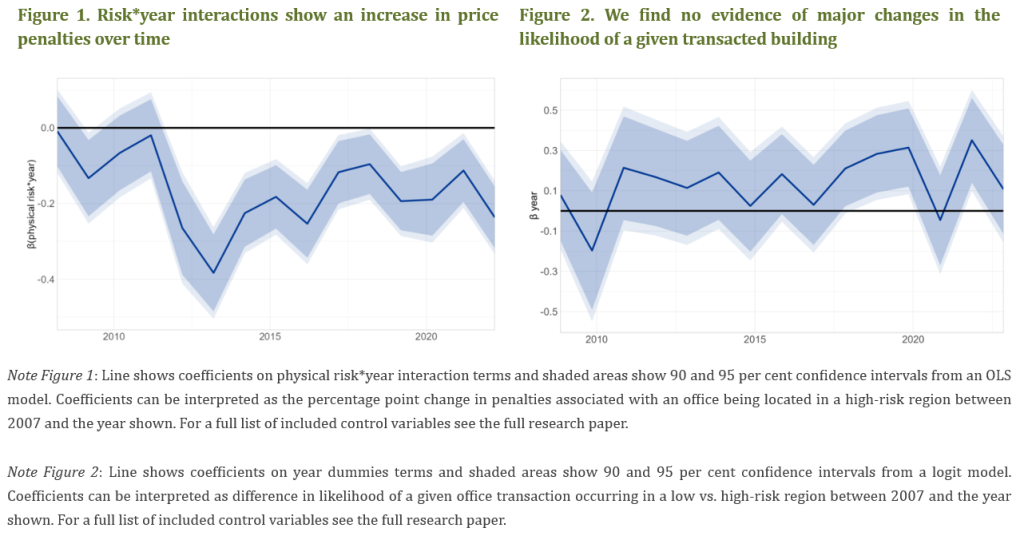
However, this repricing does not seem to impair market functioning. The literature shows us that climate risks simultaneously affect both prices and liquidity in real estate markets (Turnbull et. al., 2013). While typical liquidity indicators like bid-ask spreads are not widely available for CRE markets, we can examine variation in the share of market activity occurring in high-risk areas. In a scenario where there is falling liquidity in the market for high-risk buildings and owners of high-risk buildings are increasingly struggling to find buyers, we would expect to see less high-risk buildings transacted as time goes on. This could be driven by longer selling times or failed attempts to sell buildings. In fact, we find that high risk buildings account for a stable share of transactions over the period we study. This finding is confirmed by a simple logit model which accounts for confounding factors. Figure 2 illustrates findings from this model which shows that – even accounting for confounding factors – the likelihood of a given transacted office being in a high physical risk area has remained unchanged over the period studied.
Combining these insights indicates that rising awareness of physical risks to euro area CRE market plays already out via market prices, but that this is happening in an orderly manner without impairing market liquidity for now.
Buildings also face significant and rising climate transition risks. Direct policies (e.g., energy performance mandates) as well as indirect pressures (e.g., disclosure requirements for firms) are driving demand toward office spaces with low carbon emissions. Unfortunately, our transaction data set does not include data on building energy classifications but previous studies show that building age can be an effective proxy (ONS, 2022).
We repeat our previous exercise, this time examining investors’ pricing of new – and therefore typically more energy efficient buildings – over time. In addition to confounding factors from our physical risk analysis, we take into account further non-climate-change factors which could drive the difference in price between new and old buildings, namely variation in market risk sentiment, variation in building heating costs and variation in aggregate building construction activity.
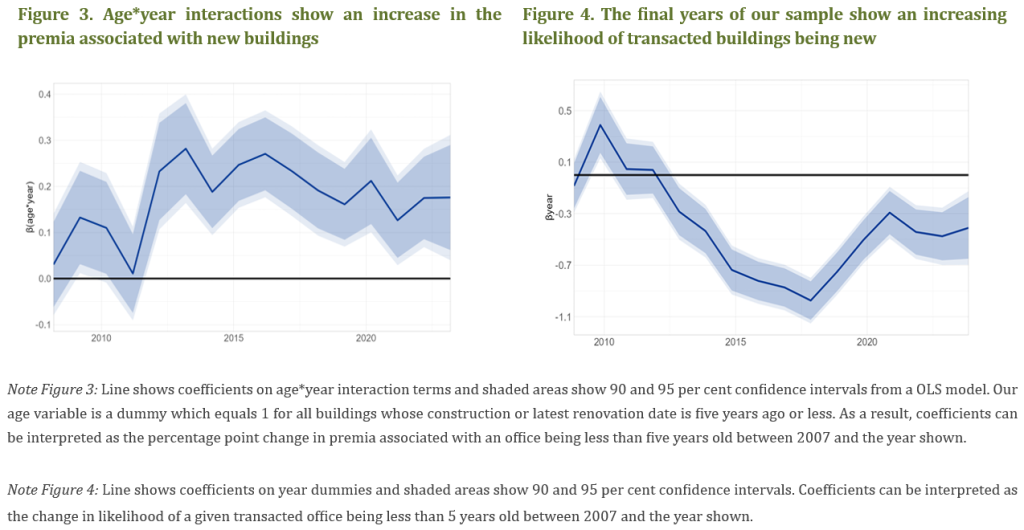
Again, we find evidence that investors have been increasingly accounting for transition risks when pricing buildings since about 2012. In Figure 3 our generally significant, positive results from 2012 onwards indicate that newer buildings increasingly trade at a premium, with the spread between new and old buildings increasing by 18 percentage points over the period studied.
However, we observe a decline in that premium in the final years of the sample, which, in light of the increasing stringency of climate regulation in recent years, is a surprising result. Our liquidity analysis provides an explanation: It suggests that market liquidity conditions for older buildings are becoming increasingly tight. Using again a logit model we can assess the likelihood of a new building being transacted in a given year. As presented in Figure 4, unlike our physical risk analysis, we do find a sharp increase in coefficient size from 2018 onwards, i.e. market activity has shifted towards newer assets in the final years of our sample, even when we hold other factors equal, including accounting for the supply of new buildings via construction activity. This shift suggests that older CRE assets may already be turning into “stranded assets’, i.e. difficult to sell even at a discount.
Regulatory action is required to ensure a timely adjustment to the risks resulting from climate change. Abrupt shocks could cause fire sales of risky assets, widespread investor uncertainty and systemic stress across banks and insurers. Policymakers can create facilitating conditions for a gradual adjustment to these risks by:
The European commercial real estate market is waking up to climate risk. Price discounts for physical risks are applied – and growing. At the same time, transition risk is reducing liquidity for older buildings. As of now, markets are adjusting in an orderly manner, but policy intervention that enables transparency and adequate assessment of exposure is essential to ensure an adequate management of these risks.
Foerster, K., Ryan, E., and Scheid, B. (2025). Pricing or panicking? Commercial real estate markets and climate change. ECB working paper series, (3059).
Horan, A., Jarmulska, B., and Ryan, E. (2023). Asset prices, collateral and bank lending: the case of covid-19 and real estate.
ONS (2022). Age of the property is the biggest single factor in energy efficiency of homes. Technical report, ONS.
Turnbull, G. K., Zahirovic-Herbert, V., and Mothorpe, C. (2013). Flooding and liquidity on the bayou: The capitalization of flood risk into house value and ease-of-sale. Real Estate Economics, 41(1):103–129.
Data on natural hazards is sourced from Moody’s Four Twenty Seven (427) and covers overall six types of risk – Floods, Heat Stress, Earthquakes, Water stress, Sea level rise and Wildfires. The results are based on an indicator that aggregates the risk across hazards and on regional level.
For this and each estimation below we consider a set of alternative specifications, which leave the main findings unchanged. Please refer to the full paper for these robustness checks.