This paper should not be reported as representing the views of the Bank of England. The views expressed are those of the authors and do not necessarily reflect those of the Bank of England. This Brief is based on the paper Covi and Škrinjarić (2025).
Abstract
This paper develops a novel, microstructural model to jointly assess solvency and liquidity risks in the UK banking system, capturing their dynamic interplay and feedback loops. Using granular data from 2015–2024, we estimate capital and liquidity at risk, and derive a systemic default probability indicator. The findings show that, while the average one-year bank default probability is low (0.7%), amplification effects – driven by balance sheet constraints and behavioural responses – account for about one third of default risk. The model demonstrates that policy tools such as dividend restrictions can significantly reduce systemic risk during stress episodes. The UK banking system’s resilience has improved over the past decade, with higher capital and liquidity buffers mitigating the impact of severe shocks, including those experienced during the Covid-19 pandemic.
Liquidity and solvency shocks are treated in stress testing as two distinct yet intertwined risk dimensions of a bank’s balance sheet. However, their interaction, which is triggered by banks’ management actions in response to shocks, may act as an amplifier mechanism, turning a viable bank into an insolvent-illiquid bank.
Recent banking crises (e.g., Silicon Valley Bank, Credit Suisse) have also shown that solvency and liquidity risks are deeply intertwined. A shock in one can quickly trigger or amplify the other, leading to rapid escalation of distress – even in banks with seemingly robust balance sheets. This paper proposes a framework that models these risks jointly, rather than in isolation, to better capture real-world vulnerabilities.
This paper builds on and extends the literature on systemic risk and stress testing (e.g., Elsinger et al., 2006; Montagna et al., 2020; Cont et al., 2020). It is among the first to back-test a microstructural model over a decade and compare its results with market-based default probabilities, finding that market-based models tend to overshoot risk during stress, while microstructural models are more anchored to fundamentals.
We extend the Capital at Risk methodology of Covi et al. (2022) as a policy tool for tail risk monitoring, scenario and sensitivity analysis and capital calibration, by taking into account both solvency and liquidity risks, and their interaction. The tail risk indicator we construct for the UK banking system is the 1-year average default probability of major UK banks weighted by their relative size.
The model simulates shocks to both assets (credit and market risk) and liabilities (funding outflows), using detailed exposure data for the seven largest UK banks. It incorporates endogenous bank reactions, feedback loops (e.g., fire sales, bank runs), and amplification mechanisms. Three main risk metrics are derived: Conditional Capital at Risk (CCaR), Conditional Liquidity at Risk (CLaR), and Systemic Default Probability (1-year average probability of bank default).
We find that the probability of bank default is historically floating around 0.43% (Figure 1, PD), implying 1 bank default every ~ 230 years. Considering the potential impact from banks’ management actions leads the bank default probability (PD PMA – post-management actions) to increase to 0.7% on average, or 1 bank default every ~ 143 years. PD (pre management actions) estimate aligns with market-based estimates during normal times (Market PD), however, we find that market PD tends to overshoot both the PD and PD PMA, whereas our PD PMA indicator is more stable. In this period, credit risk was the largest contributor to average bank default probability, followed by financial amplification mechanisms such as fire sale spillovers. Contrary, liquidity risk seems to contribute the least thanks to the high level of banks’ cash reserves. We find that over time the UK banking system may experience on average with 1% probability (CCaR99) £95 billion of losses within one year horizon, whereas £35 billion with 5% probability tracked by CCaR95 index.
Figure 1. Weighted Average Probability of Default
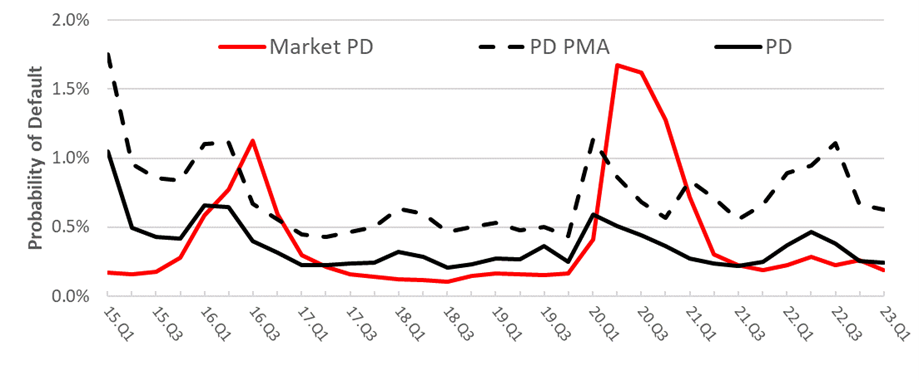
Note: Market PD refers to the weighted average bank default probability based on Starmine Structural Credit Risk Model (Merton model).
Decomposition of the PD (Figure 2) shows that a bank is most commonly in default due to a simultaneous breach of both minimum CET1 ratio and leverage ratio minimum requirements (PD_CET_LEV). We find that CET1 minimum requirements (PD_CET) are more binding in the first part of the sample than the leverage ratio (PD_LEV), where the opposite effect take place in the second part of the sample. We find only a limited contribution from illiquidity-led default (PD_CET_LIQ).
Figure 2. Average Bank Default Probability (PMA) Decomposition by Default Thresholds
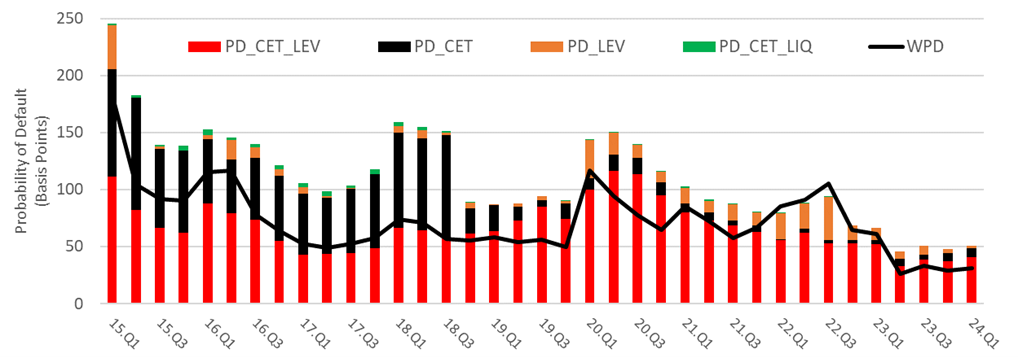
Note: WPD refers to the weighted average default probability.
The framework we developed in this paper can be used as a policy laboratory, to test how output variables change conditional to specific shocks. Specifically, we can change regulatory environment to assess its effects on the stability of the banking system. We show two applications:
This is a tool which has been widely used by central banks (BOE, ECB) during Covid-19 period. We compare the actuals to the counterfactual of not having this tool in place. Figure 3 shows that the average bank default probability without the implementation of dividend restrictions. (PD NO DR and PD PMA NO DR) would have been on average higher by roughly 32 bps over 2020 and 2021. Dividend restrictions, implemented during the Covid-19 crisis, were highly effective in reducing default probabilities and curbing amplification mechanisms. Counterfactual analysis shows that without such restrictions, systemic risk would have been significantly higher.
Figure 3. Impact of Dividend Restrictions on Banks’ Default Probability
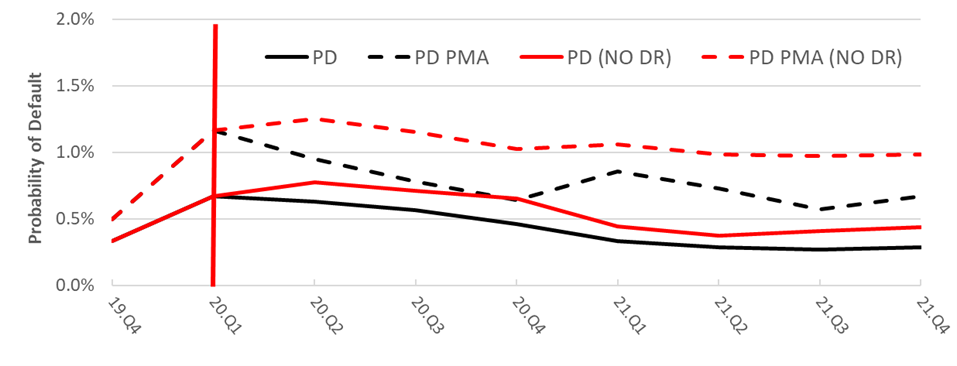
Note: NO DR refers to the counterfactual simulation as if no Dividend Restrictions were implemented.
We perform a stress testing exercise in which macro-financial conditions materially deteriorates over 1-year horizon in line with the Bank of England 2024 desk-based stress test supply shock scenario in which UK GDP declines by 5% and unemployment rises to 8.5%. Figure 4 shows the corresponding PDs for the case of no management (PD ST) and management actions (PD PMA ST). PD would increase from 31 bps in 2024q1 to 2.5% in 2025q1 driven by core PD ST estimates stemming from credit and market risk losses. Amplifying effects from banks’ management actions become material (33 bps increase or 15%) especially at the peak of the stress in Q1-2025. Overall, the estimated increase of PD is not very big, when considering that results are akin to a 1 in 100 outcome from historical data the stress test is calibrated on. Our estimate of CaR99 total losses reaches £160 billion at the peak of the stress. In the 2022 ACS (BoE, 2023), £100 billion of credit risk losses and £36 billion of traded risk losses were estimated, while the 2019 ACS (BoE, 2019) reported even higher total losses, amounting to £39 billion more – specifically, £25 billion for credit risk and £14 billion for traded risk. Although our model indicates a rise in bank default probabilities (PD) under stress, it is important to note that our loss estimates are broadly in line with those from these two official stress tests. Both exercises concluded that banks remain sufficiently capitalised to absorb such shocks, reinforcing the robustness of the sector even in adverse scenarios.
Figure 4. Weighted Average Probability of Default – Adverse Scenario
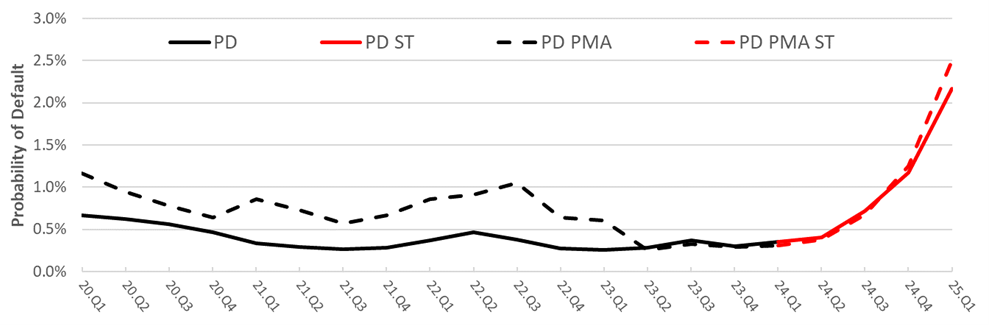
Note: PD ST and PD PMA ST refer to the weighted average bank PD estimates conditional to the adverse scenario.
The joint modelling of solvency and liquidity risks provides a more realistic and policy-relevant assessment of banking system stability. This paper introduces a methodology that integrates both solvency and liquidity risks, along with their interactions, to assess systemic risk in the banking sector. We highlight that funding and solvency risks are closely linked, and that banks’ responses to stress can intensify risk. The analysis covering the UK banking system from 2015 to 2024 finds that increased capital and liquidity buffers, have enhanced banks’ resilience. We conclude this as we found that the bank PD (PD PMA) is historically floating around 0.43% (0.7%), implying 1 bank default every ~ 230 (143) years. We also show that dividend restrictions were effective in maintaining financial stability during periods of heightened risk. Overall, the proposed methodology serves as a valuable tool for monitoring banking system stability and calibrating macroprudential policy based on a regulator’s risk tolerance.
Cont, R., Kotlicki, A., Valderrama, L. (2020), “Liquidity at risk: Joint stress test of solvency and liquidity”, Journal of Banking & Finance 118.
Covi, G., Brookes, J., Raja, C. (2022), “Measuring capital at risk in the UK banking sector”, Staff Working Paper 983, Bank of England.
Covi, G., Škrinjarić, T. (2025), “Measuring the stability of the banking system: capital and liquidity at risk with solvency-liquidity interactions“, Staff Working Paper 1140, Bank of England.
Elsinger H., A. Lehar, and M. Summer (2006), “Risk Assessment for Banking Systems”, Management Science 52(9):1301-1314.
Montagna, M., Covi, G., Torri, G. (2020), “On the origin of systemic risk”, Staff Working Paper 906, Bank of England.
BoE (2023). Stress testing the UK banking system: 2022/23 results | Bank of England
BoE (2019). Stress testing the UK banking system: 2019 results | Bank of England