menu
close

Author(s):

Peter Reusens | National Bank of Belgium
Frank Vastmans | KU Leuven
Sven Damen | University of Antwerp

Keywords:

energy efficiency , house prices , house price index , housing market

JEL Codes:

C43 , Q41 , Q58 , R31

The price difference between energy-efficient and energy-guzzling houses has increased over the past decade in Belgium. And it may even become larger due to the recently elevated energy and construction prices and the future renovation obligations. Although the energy efficiency of the sold homes has improved over the past ten years, it will have to improve substantially more in order to meet the climate targets by 2050. Finally, it is important to take into account this improving energy efficiency when drawing up quality-adjusted house price indices.

Introduction

This policy brief analyses the energy efficiency of Belgian houses and its impact on house prices. It is based on the NBB working paper Reusens, Vastmans and Damen (2022) “The impact of changes in dwelling characteristics and housing preferences on house price indices”.

We use a unique dataset in which the universe of residential real estate transactions from FPS Finance was merged with datasets of energy performance certificates (EPC) from the regional energy authorities. The latter contains the EPC score, which is an overall indicator of the energy efficiency of the house sold and which measures the yearly theoretical primary energy consumption for heating and domestic hot water per square meter of floor space (measured in kWh/m² per year). Our data includes all existing homes sold in Belgium in the period between 2011Q3 and 2021Q2, but excludes new-builds. While apartments are also analyzed in depth in our NBB working paper, this policy brief mostly focuses on houses as their dataset is of better quality.

Price difference between energy-efficient and energy-guzzling houses widens

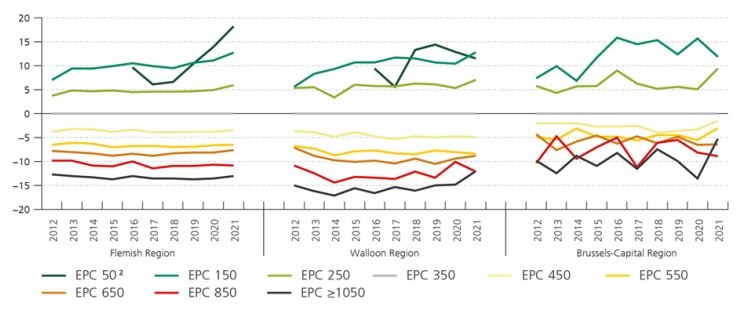
Graph 1 shows that, in the three Belgian regions, the price difference between energy-efficient and energy‑guzzling houses is large and has been increasing over the past ten years. For the period between 2020Q3 and 2021Q2, a house with an EPC score of 150 kWh/m² (energy label B) is about 12% more expensive than a similar house with an EPC score of 350 kWh/m² (energy label D) and 22% more expensive than a similar house with an EPC score of 650 kWh/m² (energy label F). That is a sharp increase compared to ten years ago and it reflects the increased awareness by households of the importance of energy efficiency when buying a house, which is a result of the higher importance of the EPC certificate and the growing environmental consciousness. The surges in energy and building material prices since last autumn are not yet reflected in our estimates and may have widened the price gap in the meantime. Finally, the price difference will also be influenced by the increasingly strict regulations concerning renovation obligations in the future.

Graph 1: Estimated energy efficiency price premium for houses¹
(in %, price difference to a comparable dwelling with an EPC score of 350 kWh/m²)

 width=

Source: Reusens, Vastmans and Damen (2022).
These estimates should be interpreted with caution, because the data do not allow for a precise distinction between the impact of energy efficiency and that of unobserved quality and comfort characteristics. In addition, the estimated additional prices for the Brussels houses and for houses with an EPC of 50 kWh/m² have a larger estimation error due to the small number of transactions. Note also that our years are shifted backwards by two quarters (e.g. our year “2021” corresponds to the period 2020Q3-2021Q2).
The estimated price premium of houses with an EPC score of 50 kWh/m² is omitted for the period before 2016 and for Brussels houses as it was based on too few observations.

The energy efficiency of the sold homes has improved over the past ten years, but needs to improve a lot more to meet the climate targets by 2050

The energy-efficient renovation of existing dwellings (and other buildings as well) is one of the cornerstones of Belgium’s climate policy and the European Green Deal, and it also has many other benefits.1 Specifically, the European Commission’s Energy Performance of Buildings Directive (EPBD) sets the transition to an energy-efficient and climate-neutral building stock by 2050 as a goal for the Member States’ long-term renovation strategies. The three Belgian regions have a similar objective of moving towards an energy-efficient housing stock with an EPC score of 100 kWh/m² on average by 2050.

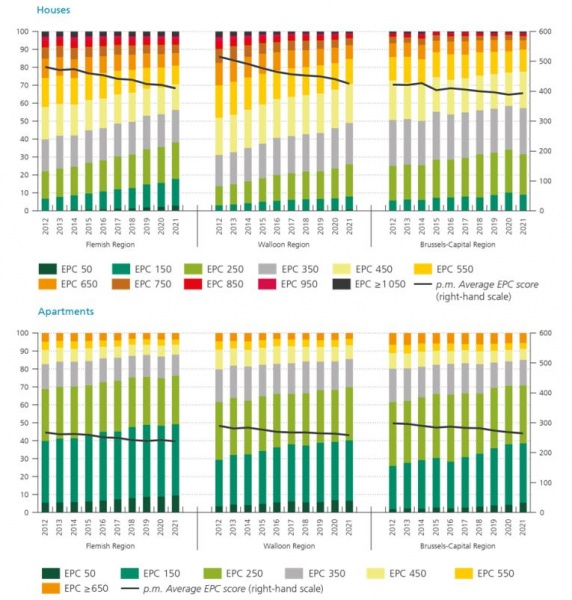
Graph 1 shows the distribution of the energy efficiency EPC scores of houses and apartments sold as well as their average, by year of sale. The average EPC score of houses sold has mainly come down in the Walloon and Flemish Regions, by respectively 90 kWh/m² and 70 kWh/m², and to a lesser extent also in the Brussels-Capital Region (a reduction of 30 kWh/m²). But in levels, the current overall score of about 400 kWh/m² is still a very long way from the 2050 target of an EPC score of 100 kWh/m².2 The average EPC score of the apartments sold of about 250 kWh/m² is lower than that of houses, thanks to their building structure, but it has declined to a lesser extent, by about 30 kWh/m² in all three Regions. Also, when we look at the distribution of the EPC scores, we see that only a small minority of the flats sold and a tiny fraction of the houses sold are already compliant with the 2050 target of an EPC score of 100 kWh/m².3 All actors involved – households, government, financial sector and construction sector – have an important role to play to accelerate the renovation wave and to overcome the existing supply and demand side impediments.

The impact of the improving energy efficiency on the house price index

Reusens, Vastmans and Damen (2022) have developed a new house price index that takes into account the differences in quality of the houses sold. For example, if many large houses are sold in a certain quarter, this will artificially raise the average house price for that quarter. The new house price index corrects for such changes in house quality by taking into account a wide range of housing characteristics, including municipality, house size, age and energy efficiency.

Graph 2: Distribution of the energy efficiency EPC scores of homes sold, by year of sale¹
(in % (left-hand scale); average EPC in kWh/m² (right-hand scale))

 width=

Source: Reusens, Vastmans and Damen (2022).
The years are shifted backwards by two quarters (e.g. “2021” corresponds to the period 2020Q3-2021Q2).

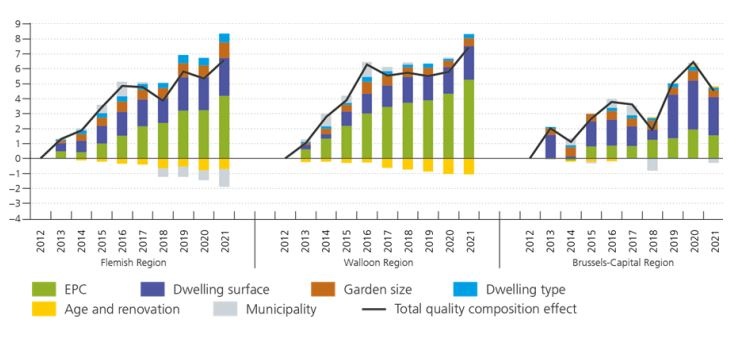
Graph 3 shows the change in quality of houses sold compared to 2012, as well as the breakdown of this change according to the various housing characteristics. Note that quality should be broadly interpreted as the estimated value of the characteristics of these sold houses. The quality of houses sold has gradually increased over the last ten years and is about 7 % in 2021 compared to 2012 in Flanders and Wallonia (and 5% higher in Brussels). In other words, the price of an identical house has risen 5 to 7 % less over the past decade compared to the recorded increase in the average prices of the houses sold. The increase in quality is mainly due to the improved average EPC score over the past decade (see Graph 2).4 Moreover, due to the necessary acceleration of energy renovations to meet the climate targets, it will become even more important in the coming years to take the improving energy quality into account when drawing up quality-adjusted house price indices.

Graph 3: Quality change of the sold houses compared to 2012¹
(in %, 2012=0)

 width=

Source: Reusens, Vastmans and Damen (2022).
1 The years are shifted backwards by two quarters (e.g. “2021” corresponds to the period 2020Q3-2021Q2).

  • 1.
    Energy renovation of homes has many other advantages besides the climate targets. Lower energy consumption obviously also means a reduction in household energy bills, which is especially important in the current context of high energy prices. Moreover, it can make Belgium and the EU less dependent on fossil fuels from other countries and is therefore one of the cornerstones of the European ‘REPowerEU’ strategy. A better insulated home also leads to increased comfort and a healthier indoor climate. Finally, renovating homes can have a positive impact on economic activity and employment.
  • 2.
    It should be noted that the lower average score in the Brussels Capital Region (393 kWh/m²) compared to the Flemish Region (410 kWh/m²) and the Walloon Region (425 kWh/m²) is due to its much higher proportion of terraced houses.
  • 3.
    Note that the average energy performance of the entire housing stock is somewhat better than that of our sample of dwellings sold. Energy renovation often follows a property sale (and in such cases is not yet included in the EPC score of the sold dwellings). Moreover, new builds are not included in our dataset of dwellings sold while older dwellings, which generally have a worse EPC score, are over-represented. 
  • 4.
    Besides the improved EPC score, the increase in quality of the houses sold over the past decade is also explained by an increase in the average dwelling surface and garden size. We note again that new-build homes, for which the average dwelling surface and garden size have decreased, are not part of our dataset of sold homes.

About the authors

Peter Reusens

Peter Reusens is an economist at the National Bank of Belgium, where he analyzes the Belgian business cycle and housing market. He graduated as a business engineer and obtained his PhD in applied economics from KU Leuven.

Frank Vastmans

Frank Vastmans is a senior housing economist researcher at the department of Economics KU Leuven. He is a member of the Flemish Policy Research Centre Housing.

Sven Damen

Sven Damen is Assistant Professor in Finance at the University of Antwerp. His research focuses on real estate economics and household finance.

More on these topics

Tags: