
Our research looks into the relationship between renewable energy (RE) consumption and financial development in the European Union (EU), using a variety of financial indicators such as novel IMF measures, country-specific metrics for renewable pricing, and the OECD Market Based Environmental Policy Stringency Index. Using a system GMM estimator across the 2005-2019 timeframe for a panel of 14 EU advanced nations, the empirical findings show a significant positive relationship with RE consumption, emphasizing the critical role of strong financial markets in promoting renewable energy demand. Furthermore, lower RE prices and stricter environmental policies generate considerable increases in RE consumption, which is consistent with traditional inverted demand dynamics and the regulatory push for sustainability.
Several empirical studies have emphasized the role played by financial factors in accounting for energy consumption, uncovering a significant impact of financial development on the demand for energy when financial development is measured by the traditional financial indicators (see, among others, Sadorsky 2010, 2011). As financial markets and financial institutions become more developed, the mechanisms through which funds are raised can significantly influence energy consumption behaviors.
This study contributes to this ongoing debate by empirically examining the relationship between the consumption of Renewable Energy (RE) and financial development within a sample of advanced European Union (EU) countries. Indeed, RE consumption in the EU has increased considerably over the last two decades as a result of focused policies and measures aimed at decarbonizing the whole EU economy by 2050 (the so-called “European Green Deal”).
We provide a fresh look at the above mentioned relationship by introducing three relevant novelties: i) we employ the financial indexes taken from the IMF’s Financial Development Database (FDD), which focus on the depth, accessibility, and efficiency of the modern and sophisticated design of financial systems, ii) we compute a weighted average of the global levelized cost of electricity to establish country-specific metrics for renewable pricing, iii) we consider the OECD Market Based (MB) Environmental Policy Stringency Index (EPS) to take into account the potential impact of government-related environmental policies on both the deployment of renewable technologies and on RE consumption.
The analysis is carried out over the 2005-2019 period for a strongly balanced dataset of 14 countries, including 13 advanced economies of the EU including the UK.1 We employ a system GMM estimator (Arellano and Bover 1995, and Blundell and Bond 1998), commonly used in the literature studying the relationship between (renewable) energy consumption and financial development.2 To control for current economic factors, we consider a reduced form dynamic panel model of RE demand where RE price, and EPS are also included. As a matter of fact, energy prices, market conditions, and environmental policies may influence the access to renewable technologies. As an additional control measure, we incorporate Real GDP per capita, taken from the World Bank’s World Development Indicators, to capture possible income effects from each country of the sample. Financial development indicators have been included one-at-a-time in the regression models. All variables have been expressed in natural logarithm.
Data on RE consumption have been collected from the World Energy Balances dataset provided by the International Energy Agency and mostly reflect deliveries to consumers.
Financial indicators have been collected from the World Bank’s Global Financial Development Database (GFDD) and from the IMF’s FDD. Financial variables taken from the GFDD are those ones that are commonly used as relevant measures for financial size, depth, and efficiency in the existing literature, i.e., credit provided by banks to the private sector, credit provided by banks and non-banks to the private sector, total value of all listed shares in domestic stock markets, and the value of domestic shares traded on domestic exchanges. Henceforth we will refer to them as “traditional” financial indicators.
Variables taken from FDD consist of nine indicators that consider financial development as a combination of depth (size and liquidity of markets), access (ability of individuals and companies to access financial services), and efficiency (ability to provide efficient financial services). Each indicator is normalized between 0 and 1, thus, higher values indicate greater financial development (Svirydzenka 2016). The FD index captures the degree of development of the whole financial system, i.e., for both financial institutions (FI) and financial markets (FM). Financial institutions include banks, insurance companies, mutual funds, pension funds, and other types of non-bank financial institutions. Financial market indicators focus on bond and stock markets. Each FI and FM index is measured according to depth (D), access (A), and efficiency (E). The resulting six sub-indices, FID, FIA, FIE for financial institutions and FMD, FMA, FME for financial markets, complement the traditional financial indicators related to the banking sector and to stock market. This expansion allows for a more comprehensive assessment of financial development, including the bond markets and part of the non-bank financial intermediation.
To provide a country-specific measure of renewable price, we have computed a weighted average of the levelized cost of RE by technology (2021 USD/KWH) weighted for installed global RE capacity by technology (KWH), then converted by official exchange rates (local currency units per USD) and finally divided by the CPI of each country.
The OECD Environmental Policy Stringency Index (EPS) is a country-specific metric assessing the rigor of environmental policies exerted, whose value ranges from 0 (not stringent) to 6 (highest degree of stringency). Stringency, in this context, refers to the extent to which environmental regulations put an explicit or implicit price on activities that contribute to pollution or environmental harm. In this paper, we use the MB EPS index as it is representative of the prevalent tools commonly adopted by EU countries to address environmental policies and actions aimed at achieving the goals of the European Green Deal.
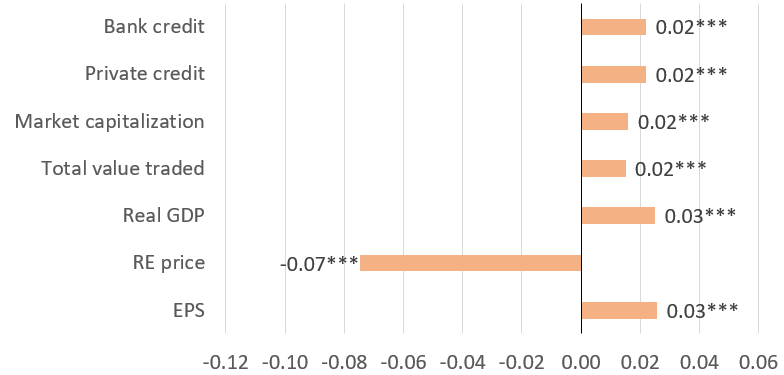
The four traditional financial indicators are positively correlated with RE consumption, showing that larger and more active credit and stock markets support larger demand of renewable energy sources (Figure 1). Specifically, a 1% rise in one of the traditional financial indicators results in about a 0.02% increase in RE consumption. The estimated coefficients on real GDP are positively correlated to RE consumption, while it emerges a negative and statistically significant relationship between RE consumption and RE price, coherent with the existence of a traditional demand function. Estimated coefficients on EPS enter positively each regression model implying a positive relationship with RE consumption.
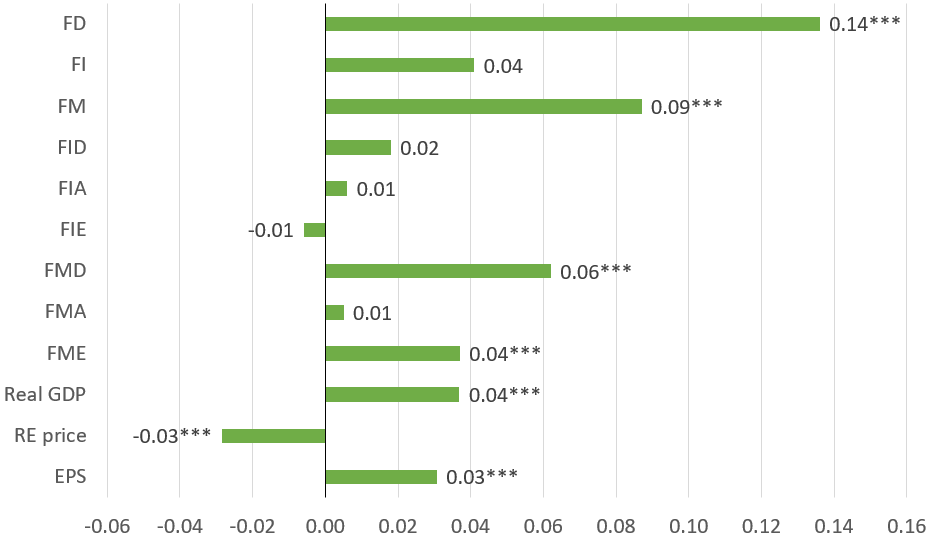
Estimation results related to IMF financial development indicators are illustrated in Figure 2. Four out of the nine financial development indicators emerge to be statistically significant and positively correlated to RE consumption: FD, FM, FMD, and FME. These outcomes are in line with those obtained using traditional financial indicators. In general, more developed financial systems, in particular financial markets (this time both stocks and bonds), support the amount of renewable energy consumption. A 1% increase in FD, FM, FMD, or FME, increases RE consumption by, respectively, 0.14%, 0.09%, 0.06%, or 0.04%. Regarding the control variables, the estimated coefficients associated with real GDP exhibit positive values, conversely, the coefficient for RE price is consistently negative with an average estimated value of -0.03. The policy variable EPS is confirmed to be positively correlated with RE consumption. Notably, a 1% change in EPS is associated with an increase in RE consumption of about 0.03%.
Figure 1: Renewable energy consumption and traditional financial development indicators (% change)

Note: *** denotes statistical significance of the estimated coefficient at the 1% level.
The degree of development of the overall financial system and, in particular, of financial markets (stocks and bonds) fosters RE consumption, in terms of i) larger depth and better quality of the financial services provided, as well as ii) more efficient financial services provided by financial markets.
Figure 2: Renewable energy consumption and IMF financial development indicators (% change)

Note: *** denotes statistical significance of the estimated coefficient at the 1% level.
This research contributes to bridging the gap between financial development and sustainable energy transitions, offering valuable insights for policymakers, practitioners, and researchers alike. By elucidating the mechanisms through which financial factors influence RE consumption, this study provides insights for designing targeted policies and interventions aimed at accelerating the transition towards a greener and more sustainable energy future.
The empirical findings show several key observations. Firstly, the positive correlation between financial development and RE consumption highlights the pivotal role of robust financial institutions and financial markets in supporting renewable energy demand. Whether assessed through traditional financial indicators or the latest IMF indexes, efficient financial markets or institutions are shown to facilitate greater energy demand from renewable sources. This emphasizes the importance to support financial systems in providing easier access to debt and equity financing, particularly for investments that offer environmental benefits. The rise of green finance instruments such as green bonds and market-based tools entails a paradigm shift towards environmentally and climate-friendly financial systems.
Secondly, the inverse relationship between RE consumption and RE price underscores the conventional demand dynamics in the energy sector. Lower prices for renewable energy technologies incentivize greater adoption and consumption, aligning with the objectives of promoting sustainable energy transitions.
Thirdly, the study reveals a positive association between environmental policy stringency and RE consumption, indicating the effectiveness of regulatory measures in encouraging the adoption of renewable technologies. The incorporation of environmental policy instruments, such as feed-in tariffs and carbon taxes, underscores the importance of policy frameworks in shaping energy consumption patterns towards sustainability.
The implications of these findings extend to policy and practice, emphasizing the importance of fostering well-functioning financial markets and instituting environmental policies conducive to renewable energy adoption.
Arellano, M., Bover, O., 1995. Another look at the instrumental variable estimation of error-component models. Journal of Econometrics 68, 29–51.
Blundell, R.W., Bond, S.R., 1998. Initial conditions and moment restrictions in dynamic panel data models. Journal of Econometrics 87, 115–143.
Sadorsky, P., 2010. The impact of financial development on energy consumption in emerging economies. Energy policy, 38(5), 2528-2535.
Sadorsky, P., 2011. Financial development and energy consumption in Central and Eastern European frontier economies. Energy policy, 39(2), 999-1006.
Svirydzenka, K., 2016. Introducing a New Broad-based Index of Financial Development, IMF Working Paper.
We selected those EU countries whose aggregate GDP almost represents the 90% of the total EU GDP. Included countries are Austria, Belgium, Denmark, Finland, France, Germany, Greece, Ireland, Italy, Netherlands, Portugal, Spain, Sweden, United Kingdom. The sample offers a wide range of variation across countries of RE consumption as well as degree of financial development.
We first checked the stationarity of the variables since non-stationarity could lead to spurious regression results. The unit root hypothesis is rejected for all the variables involved in our analysis, however, since some of the variables have roots close to unity it is advisable to employ a system GMM estimator.