The views expressed in this paper are solely the responsibility of the authors and do not necessarily reflect the views of Banka Slovenije or the Eurosystem. An extended technical version of this paper is available on the Banka Slovenije Website.
Abstract
Recent concerns about the German automotive slowdown and related US tariffs pose risks for small open economies. We focus on Slovenian companies integrated into these supply chains. Using comprehensive data-intensive analysis, we define “companies at risk” as companies operating in the automotive sector with at least 10% of revenues from German trade receivables. They account for approximately 2% of total bank exposures, 5.3% of value added, and 5% of operating revenues. At the municipal level, several clusters with higher concentrations of such firms are identified. To address data limitations and the arbitrariness of our classification, we conduct robustness checks. Using input–output tables, we also assess potential spillover effects across supply chains. Our granular company-level approach provides valuable insights for potential policy responses targeting the real economy, banking system, and/or local municipalities.
The automotive industry is a structurally significant segment of the EU economy. According to ACEA (2023), it serves as a major employer that directly and indirectly provides jobs for approximately 13 million Europeans, which accounts for about 7% of total employment in the EU. In recent years, the automotive industry has undergone significant structural changes, driven by several key factors, some of which are discussed in more detail in European Commission report (2024) and ECB (2024):
While the economic significance of the automotive industry varies considerably across regions and EU Member States, Slovenia stands out as a nation heavily reliant on this industry. As noted by Slovenia Business (2023), not a single car produced in Europe is produced without at least one component being manufactured in Slovenia, underscoring the automotive industry’s role as a primary driver of the country’s economy. It contributes approximately 10% to Slovenia’s GDP and constitutes around 20% of Slovenian exports. Germany is Slovenia’s most significant export market, with 33% of Slovenia’s automotive exports directed to Germany (Slovenia Business, 2023). The saying “if Germany sneezes, Slovenian companies catch the flu” underscores the understanding of how exposed Slovenian companies are to challenges within the German automotive industry. Due to the export-driven nature of Slovenian companies, the primary risk faced by those in the automotive industry is a decrease in demand resulting from supply chain disruptions and reduced orders.
It is important to note that the purpose of the analysis was not to assess whether the German automotive industry is in crisis. Rather, the focus was on evaluating how such a crisis could impact Slovenian real economy, companies, banks and municipalities.
Our analysis is performed on the individual company level. In the first step we need to identify potential companies at risk due to disruptions in the German automotive industry.
Initially, we utilize the SloExport database (SloExport, 2024) to pinpoint companies within the automotive industry. This is a database of Slovenian exporters that is updated on a voluntary basis by the companies themselves. In the extended paper (Ortl and Sajinčič, 2025) we assess the dataset’s coverage and determine that it is a reliable and valuable resource for our needs. The database contains information about the industries in which a company operates. We include companies that explicitly identify as part of the automotive industry, have relevant Classification of Products by Activity (CPA), which is also available in the SloExport database and/or have the textual description of the company operations that includes different variations of phrase “automobile industry”. Additionally, we perform some manual checking by checking media mentions of companies in automotive industry-related articles and adding any potentially missing companies.
In the second step, we limit the scope of analysis. First, we narrow down the analysis to the manufacturing sector (C) and ensure that all companies classified under the NACE C29 industry code (Manufacture of motor vehicles, trailers and semi-trailers) are included. We also limit our scope to sector S11 (excluding sole proprietors). Given our central bank’s focus on the banking system, we further restrict our list of companies at risk to companies that have performing status in Slovenian commercial banks.
In the last step, we utilize data from the trade receivables database at the Bank of Slovenia and restrict our analysis to companies where the annual increase in trade receivables constitutes more than 10% of their total operating revenues. Please note that this threshold is arbitrary, hence we provide some robustness tests. Please be aware that the database on trade receivables has certain limitations. Not all companies are required to report to this database and the definition of trade receivables is not the same as accounting definition of operating revenue. We have conducted some coverage checks in Ortl and Sajinčič (2025), and concluded the approximation is valid.
By such procedure we retrieve a list of “performing companies at risk”. The list consists of 77 companies. We want to emphasize that the definition of risk is ambiguous. Our analysis does not imply that all the listed companies will default on their bank exposures or go bankrupt. Rather, it indicates that these companies might face difficulties due to disruptions in the German automotive industry and will require some adjustment of their business models.
After the identification of 77 “performing companies at risk” operating within the automotive industry and generating more than 10% of their operating revenue from trade receivables from Germany we can perform some further analysis of this group. We primarily use data as of 31 December 2023, unless otherwise specified. In addition to the before mentioned databases we utilize also credit register from Bank of Slovenia (monetary financial institutions reporting, PORFI). We also use company accounting data by AJPES (2023). Bank exposures and borrower data include all on-balance and off-balance sheet exposures measured at amortized cost.
3.1. Importance for the economy and the banking system
In terms of economic significance, in 2023 Slovenian companies from all industries had operating revenues of EUR 140.2 bn. As of 31 December 2023, their total exposure at Slovenian commercial banks amounted to EUR 16.6 bn. In our analysis, we focus solely on companies in the manufacturing sector, which account for nearly one-third of all companies in terms of both revenue and exposure (EUR 40.6 bn in operating revenues and EUR 4.9 bn exposure).
Our identified performing companies at risk represent EUR 7.0 bn of operating revenue. Most of it (EUR 6.2 bn) is foreign operating revenue. Those companies have EUR 2.5 bn of trade receivables from Germany and EUR 1.1 bn of bank exposure. We use the given numbers and definitions as our foundation.
In Figure 1, we illustrate the share of the entire Slovenian economy (EUR 140.2 bn of operating revenues) represented by our performing companies at risk (EUR 7.0 bn of operating revenues, which is 5.0%). These companies account for 10% of foreign operating revenues, 27.6% of all trade receivables from Germany and 13.4% of all trade receivables. Smaller shares can be observed in total bank exposures (2%), bank exposures to companies (6.6%), operating revenues of all companies (5.0%), value added (5.3%) and number of employees (5.4%). The number of performing companies at risk is very small compared to the total number of companies (0.1%), which is also due to data limitations.
Figure 1. Importance of performing companies at risk
for the total economy (left) and the manufacturing sector (C) (right)
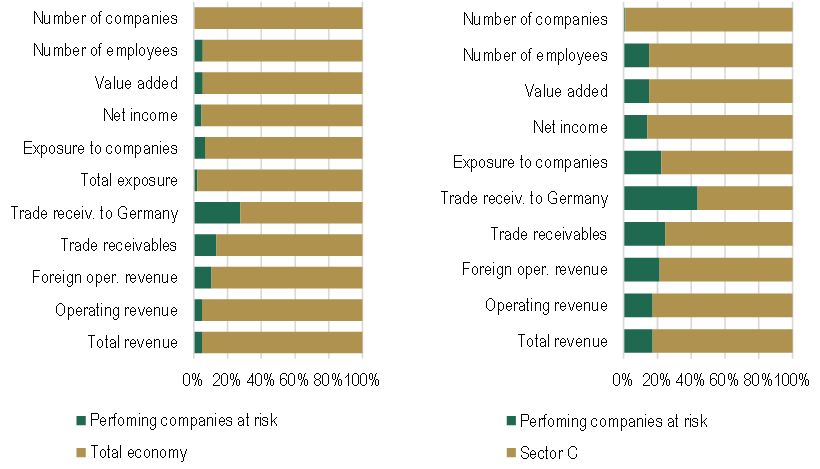
Sources: Bank of Slovenia, AJPES, SloExport, own calculations.
Notes: The total economy in this analysis represents all companies in Slovenia in sector S11. Please note that our analysis primarily focuses on the manufacturing sector. Companies in the wholesale sector are not extensively included, as they are more related to trade liabilities rather than trade receivables within German industry. Due to data limitations, smaller companies might be missing. However, we have tested and confirmed that the overall coverage remains high.
If we look at individual banks, we show in the extended paper that all commercial banks have bank shares of exposure of performing companies at risk relative to the total bank exposure of all companies lower than 10%, while almost half of banks have shares lower than 1%.
3.2. Decomposition by industries
In Figure 2, we show the industry decomposition of the operating revenues and exposures of our performing companies at risk. We see that our identified companies do not come solely from industry C29. The four largest industries in terms of operating revenues and bank exposures are:
Figure 2. Industry decomposition of performing companies at risk,
by operating revenue (left) and by exposure (right)
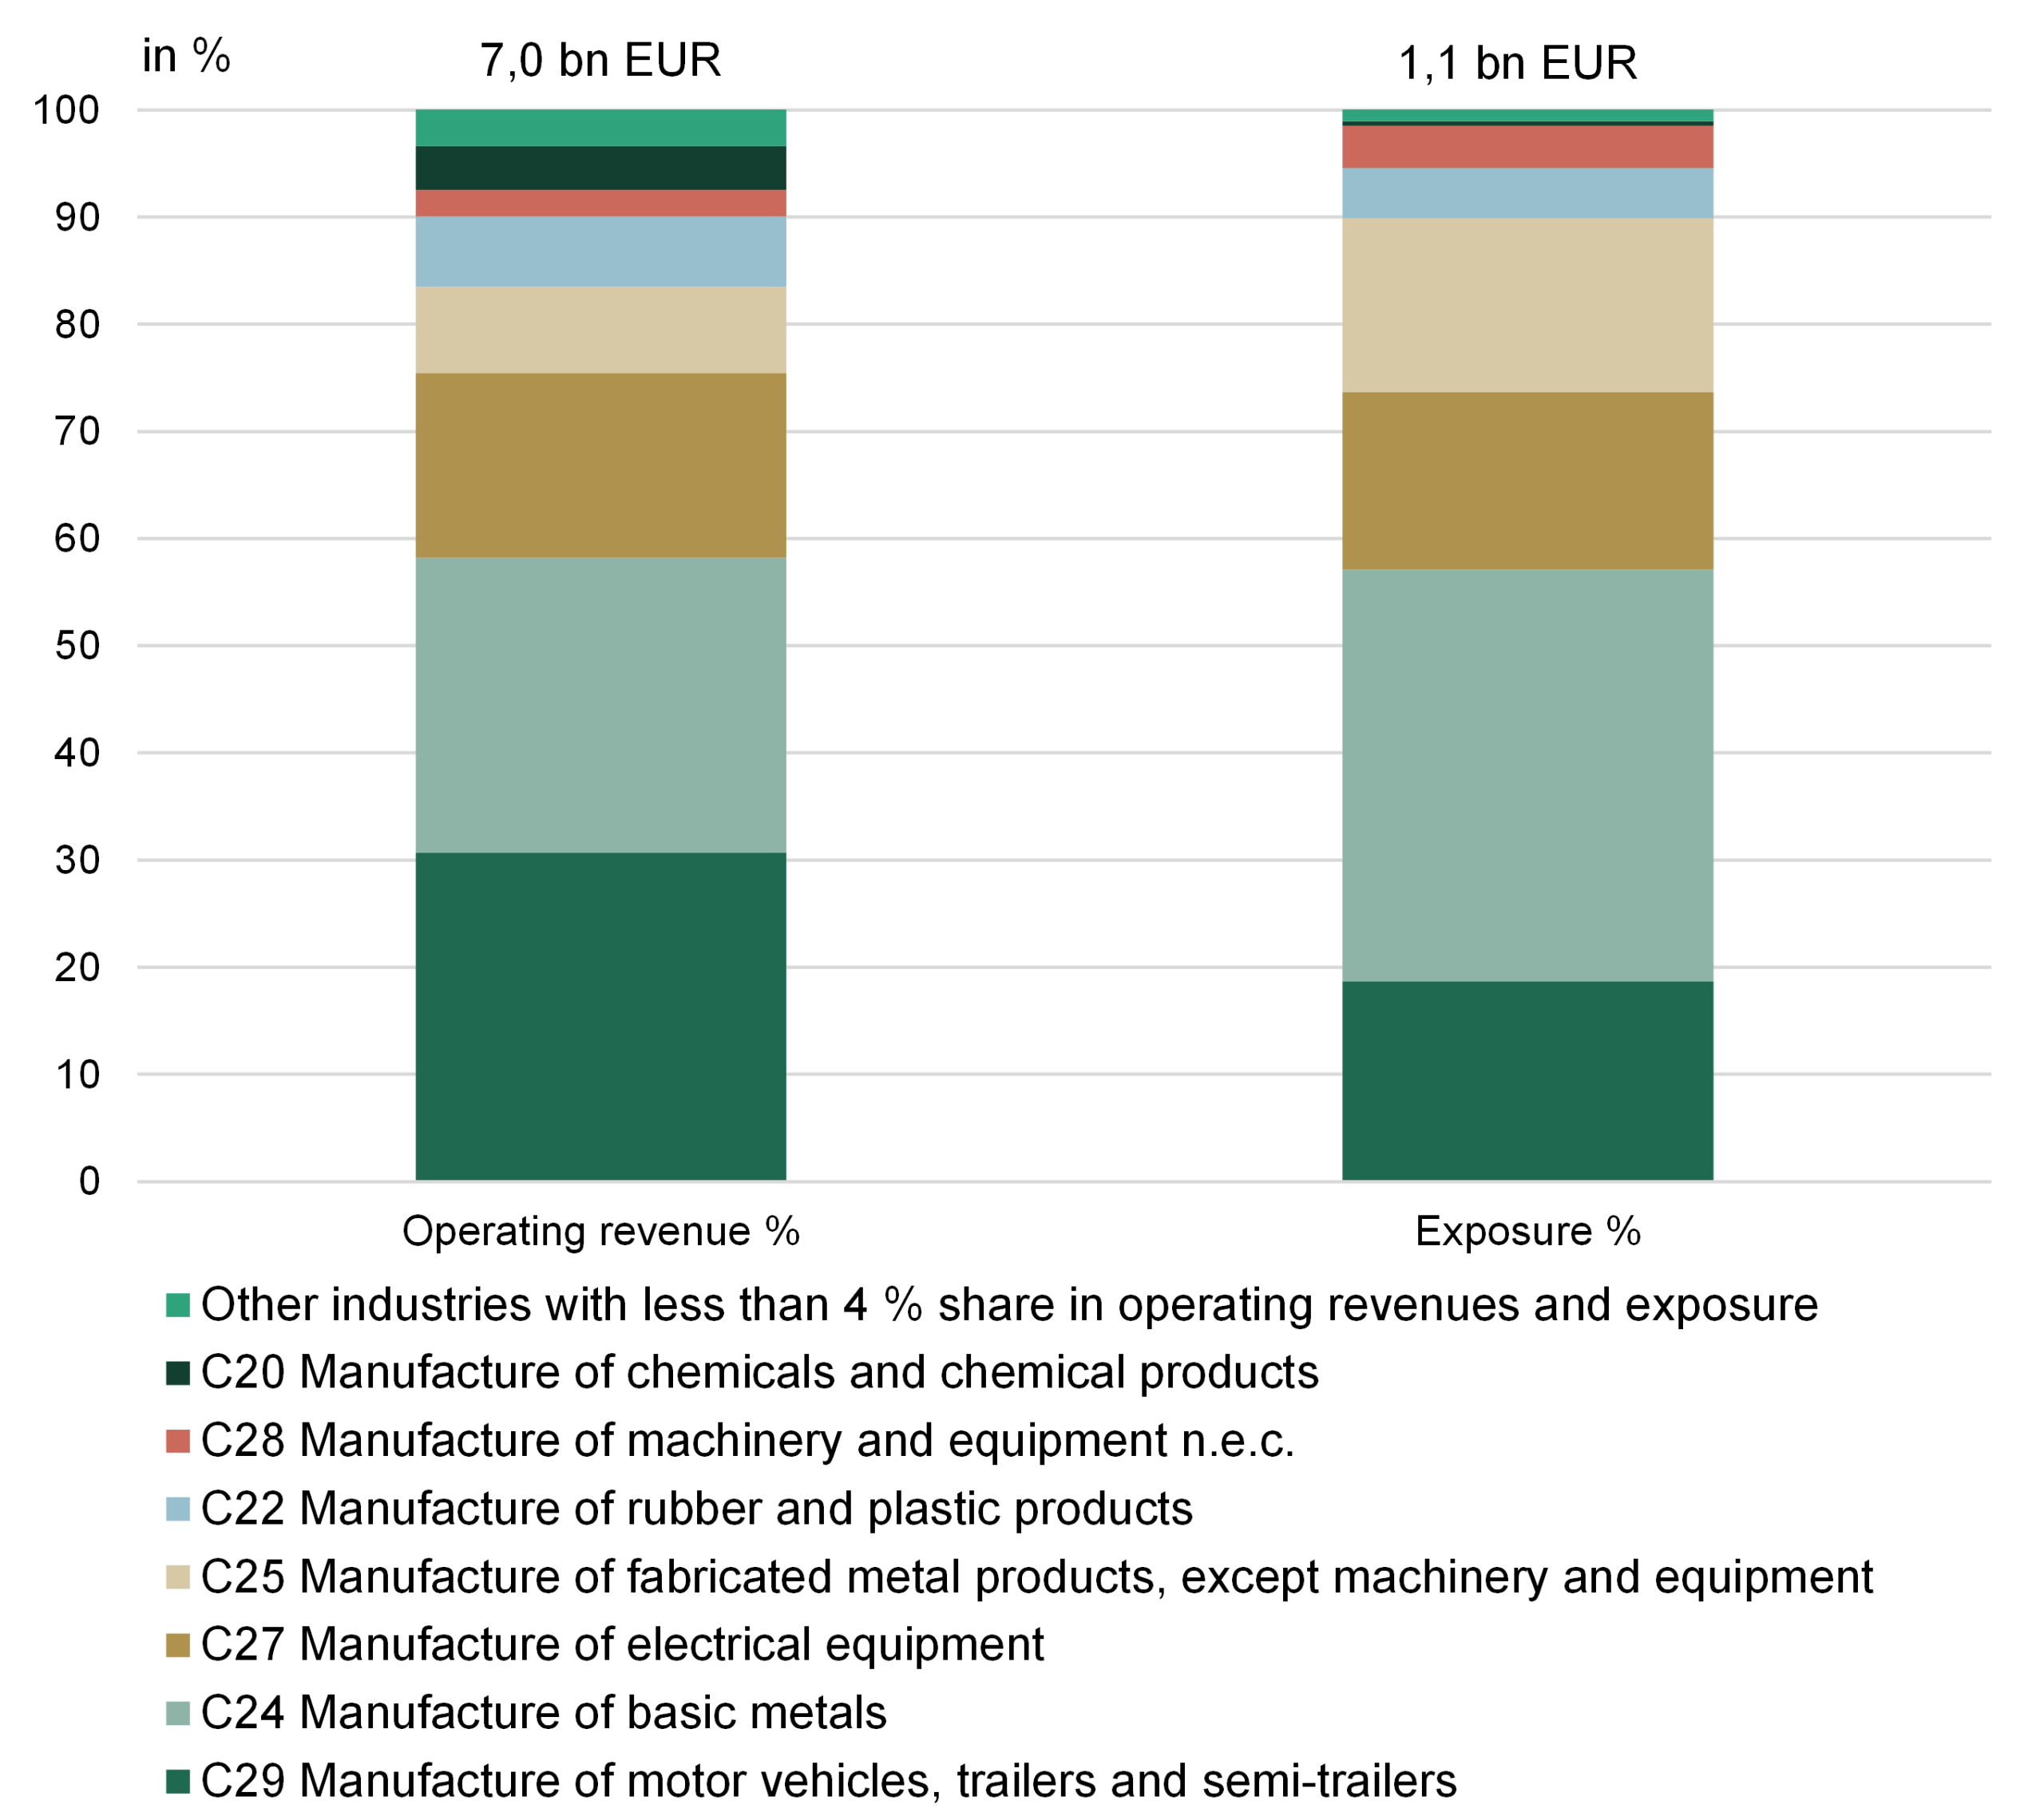
Sources: Bank of Slovenia, AJPES, SloExport, own calculations.
In the extended paper we show the share of each industry represented by our performing companies at risk. We see that the largest shares (over 60%) by both criteria (operating revenue and exposures) are in the following industries:
3.3. Financial performance and risk materialization
We also examined whether the potential risks have already begun to materialize. Almost the entire paper is based on data up to 31 December 2023, so the realization of risks is not yet fully observable.
An analysis of default rates using data up to the end of 2024 shows no major increase in defaults, hence we can conclude that risks have not yet materialized by the end of 2024. This is partly also because the vulnerable companies identified have significantly improved their financial indicators since the global financial crisis, reducing their debt levels and increasing liquidity. We also observed a decline in the relative importance of identified most vulnerable sectors in recent years, measured by their share of total business revenues in the economy.
We checked further whether there has been some dynamics in sales to the German automotive industry as an early indicator of risk. We checked monthly increases in trade receivables from Germany and observed that all companies experienced decline in the last months of 2024. However, there has been an improvement in the first two months of 2025.
Now we focus on the risk concentration in different municipalities. We analysed the industrial facilities owned by companies by municipality. Industrial facilities are not necessarily located only in the municipality where the company is headquartered. We obtain data on the locations of industrial facilities from two sources. First, based on monetary financial institutions’ reporting (PORFI) on cadastral data, we obtain information on the cadastral municipalities in which the company industrial facilities are located. This information is only available if the company has a collateralized loan at the bank. An additional limitation is that this information is only available for new loans that were originated after April 2022, hence coverage of total manufacturing sector with cadastral information on industrial properties is approximately 40 %. Despite the limitations, this approach allows us to obtain some additional locations of industrial properties in various municipalities. For all remaining companies, we use the data on the municipality of the company’s headquarters. In the second step, we supplement the list of locations with a manual review of 37 companies in our database that had at least EUR 150 million in operating revenues in 2023. Using tools like ChatGPT (OpenAI), Google Maps and company websites, we add 34 additional locations of industrial facilities in various municipalities for those 37 companies. It turns out that we can retain the headquarters of all these companies, as there is an industrial facility in every municipality where the company’s headquarters is located. With the manual review we improve the identification process.
One can see from Figure 3 that there are some clusters with elevated risk. In the extended paper we show also the share of operating revenues of performing companies at risk relative to the operating revenues of all companies based/headquartered in a municipality.
Figure 3. Share of number of industrial facilities of performing companies at risk in total, at municipality level
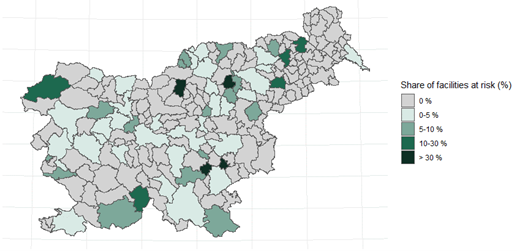
Note: All the maps are based on the GURS database and plotted with “sf” package in R.
Sources: Bank of Slovenia, AJPES, SloExport, GURS, ChatGPT, Google MAPS, company websites, own calculations.
In this chapter we make robustness tests of “performing companies at risk”. Previously, we calculated that our performing companies at risk have approximately EUR 7 bn of operating revenue. Now, we use the numbers and definitions as our foundation and then modify certain assumptions or test various limitations individually one by one, while keeping everything else unchanged.
5.1. Changing the share of receivables to Germany
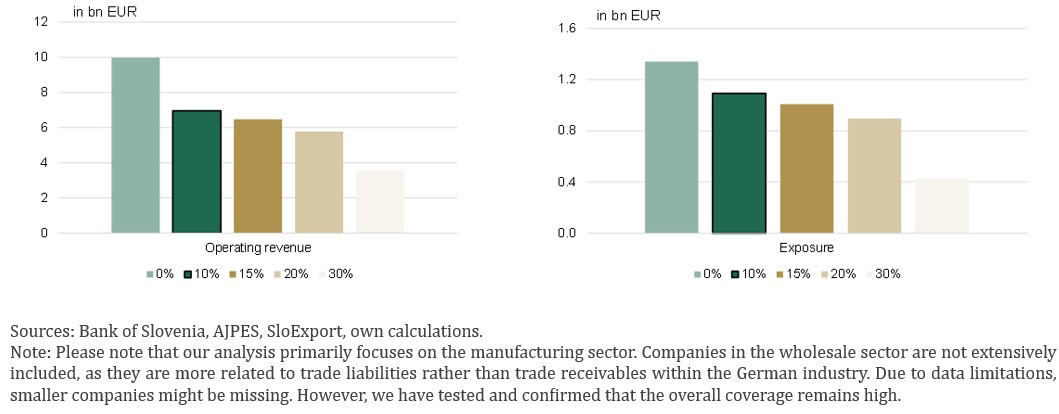
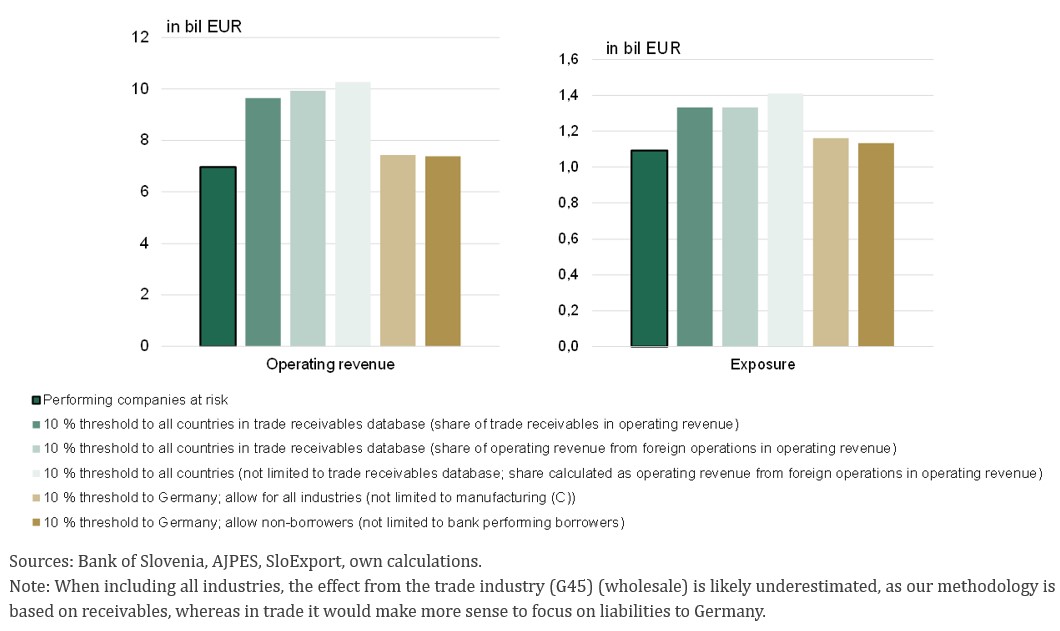
First, we change our assumption regarding the 10% threshold for the share of trade receivables in operating revenue. In the main analysis, we calculated that companies at risk have EUR 7 bn of operating revenue and EUR 1.1 bn of bank exposures. This assumption might be too conservative, as many companies will be able to withstand such pressure, hence we show the impact of setting different thresholds on Figure 4.
We can see that setting the share to 0% substantially increases operating revenues from EUR 7.0 bn to EUR 10.0 bn (increase from 5.0% as share of total economy to 7.1%) and exposures from EUR 1.1 bn to EUR 1.3 bn (increase from 6.6% as share of total economy to 8.1%). On the other hand, increasing the share by 5 percentage points does not have such a dramatic impact. If we set the threshold at 20%, the operating revenue at risk amounts to EUR 5.8 bn, with an exposure of EUR 0.9 bn. Furthermore, increasing the share to 30% substantially lowers the operating revenues and exposures at risk.
Figure 4. Impact of different thresholds for the share of trade receivables to Germany
in operating revenues on operating revenue (left) and exposure (right)
5.2. Including companies at risk from other industries, including non-borrowers, and relaxing the dependence on Germany by including other countries also
Next, we tested several other assumptions. The first column in the Figure 5 presents the core results for companies at risk as identified within manufacturing sector, whose share of trade receivables to Germany is larger than 10 %.
In the second column, we relaxed the restriction to Germany alone. Instead of using a 10% threshold for receivables from Germany, we applied it to receivables from all foreign markets. This allowed us to test how results would change if the issue affected the global automotive industry, not just the German one. The estimated share of at-risk business revenues increased by EUR 2.7 bn (from 5% to 6.9% of total business revenues).
Columns three and four test technical assumptions related to data limitations. As previously noted, increases in trade receivables serve only as a proxy for operating revenue; however, their use enables us to condition the analysis specifically on Germany. Therefore, we test the robustness of this definition by applying a 10% threshold to all countries in the trade receivables database combined, this time calculating it as the share of foreign operating revenue in total operating revenues. We observe that the results do not change substantially (see second and third columns), which assures us that trade receivables can be used as a proxy. In the fourth column, we additionally removed the restriction to include only the companies that report to the database on trade receivables. This led to a slight increase in estimated at-risk revenues. Comparing columns three and four confirms that the issue of smaller companies not reporting to SMO is not significant.
In the fifth column, we compare the main results for our performing companies at risk with the same list of companies, but without restricting ourselves to the manufacturing sector (C). The results do not change significantly. The discussion of these results is provided in the following chapter.
Lastly, in the sixth column, we relax the constraint of including only performing companies that are bank borrowers. Including non-borrowers leads to only a marginal increase in the operating revenue at risk.
Looking at the exposures, the intuition is similar. In the most conservative case, the exposure amounts to EUR 1.4 bn (fifth column) compared to EUR 1.1 bn in the main results.
Figure 5. Robustness checks of various assumptions and data limitations
on operating revenue (left) and exposure (right)
5.3. More conservative estimates
We then adjust multiple assumptions and limitations simultaneously to derive more conservative estimates. By applying a 0% threshold to any country – without restricting the analysis to the trade receivables database and to performing borrowers, while still focusing on the manufacturing sector – the operating revenue at risk increases by EUR 4.2 bn, reaching a total of EUR 11.2 bn. This represents a substantial rise compared to the EUR 7 billion in the main results, with the share of operating revenue at risk relative to the total economy increasing from 5.0% to 7.9%. This is the total operating revenue at risk for all manufacturing companies that we identified to be operating in the automotive industry, irrespective of their country dependence. Looking at the exposures, our estimates for the performing companies at risk were EUR 1.1 bn. If we are more conservative, the numbers could amount to EUR 1.52 bn.
5.4. Limitations of the analysis
Due to data limitations, our analysis has drawbacks. First, our final list of performing companies at risk does not include companies that are not part of the SloExport database or the trade receivables database. However as mentioned, we provide some robustness analysis in the extended paper.
Our identification may be overly conservative. We lack information on the robustness and flexibility of individual companies. For example, we know that the included companies operate in the automotive industry and have more than 10% dependence on the German market according to our definition. However, we cannot determine their exact manufacturing mix and their ability to adapt to the new environment. For some companies, their dependence on the automotive industry might be minimal (only a few percent of their operations). Hence not all risks will materialize for all companies.
Our analysis focuses on the manufacturing sector (C) and companies in the S11 sector (although we provide some robustness checks for other industries), excluding sole proprietors. Another significant industry that will be impacted is motor vehicle sales (for instance sector G45 – wholesale trade of motor vehicles). We do not include this industry, because we would need information on payments to Germany (liabilities) rather than trade receivables from Germany. Note that sole proprietors are completely out of the scope of this analysis, due to lack of data availability.
We do not consider other current risks that could exacerbate the situation for companies, such as geopolitical risks, energy prices and trade tariffs. The manufacturing sector is also very climate-sensitive, as discussed in Sokolovska (2022).
It is also important to note that our methodology can only cover the first-round direct effects. We cannot identify companies that may be in trouble due to risks faced by their foreign parent company or shareholders as a result of a shock in the automotive industry. Additionally, we cannot thoroughly address all the risks that may spill over from the companies we have identified to their associated entities. We discuss those issues in the next chapter.
6.1. Spillover as identified by input-output tables
So far, we identified industries at risk in Slovenia due to a decline in demand from the German automotive industry. Building on this, we now explore potential second-round or spillover effects along supply chains. We try to identify additional industries in Slovenia that could suffer consequences as a result of disruptions in those identified industries at risk in Slovenia. Such analysis can be done on the industry level with the use of FIGARO industry-by-industry input–output tables from the Eurostat database (Eurostat, 2022).
There are two possible channels from which additional industries can be identified. In this policy note we show the effect if our identified industries at risk in Slovenia lower the demand for their inputs and show the results in Figure 6 (downstream value chain). We show the shares of output of indirectly dependent industries/suppliers on the left into identified industries at risk on the right. The industries on the right were identified in the extended paper using input-output tables and were found to largely overlap with those highlighted in the previous chapters. The industries on the left are identified if the share of their total output that goes to one of the previously identified industries at risk on the right is greater than 4%. Using this approach, we can identify the following second-round industries at risk:
Figure 6. Spillover effects from industries at risk to their suppliers (upstream value chain)
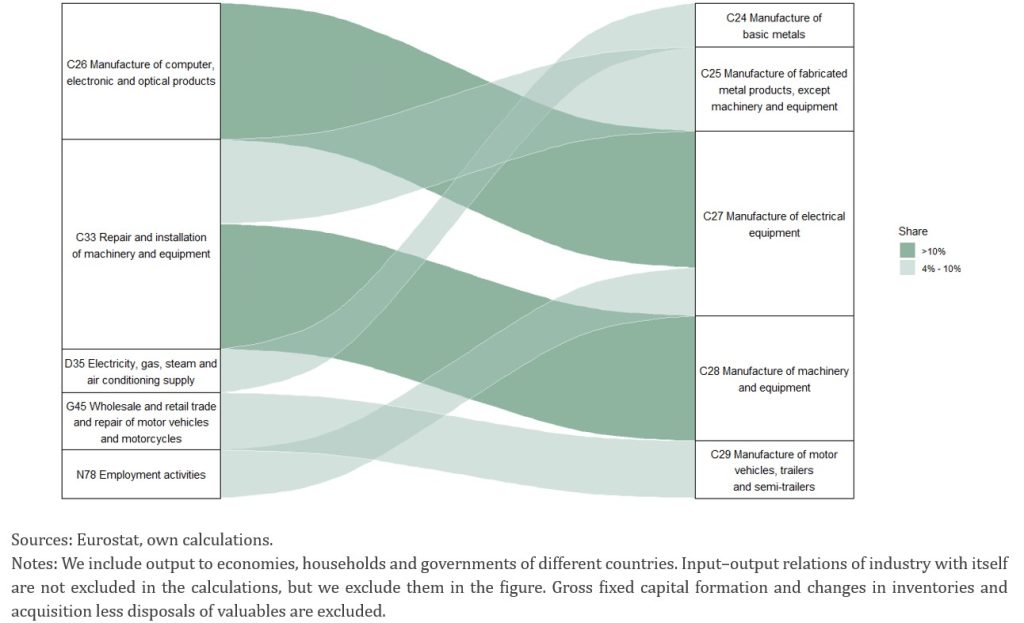
In the extended paper we examine also the effect if our identified industries stop producing their output and consequently do not provide inputs to other industries (downstream value chain).
6.2. Spillover via associated entities
Given the complex ownership structures of many companies, particularly larger ones, issues within one company can often cascade throughout the entire group of associated entities. To account for this, we extended our analysis to include companies with ownership ties to those identified as at risk in the main part. Due to data constraints, we manually identified these related companies.
We examined the associated entities of the five largest of the performing companies at risk based on both operating revenues and exposures.
By such a procedure, we identified 30 additional companies that are related to the original five biggest companies (by operating revenue and by exposure) from the performing companies at risk list. However, adding those companies only slightly increases the operating revenue at risk by 7% and exposure by 2%.
The analysis addressed the importance of exports to the German automotive industry for Slovenia from multiple perspectives. We identified performing companies at risk as those operating within the automotive industry, that are performing bank borrowers and that have at least 10% of their total operating revenues from claims to Germany. These companies have approximately EUR 7 bn of operating revenues and EUR 1.1 bn of bank exposures. Companies under the given definition represent 10% of foreign operating revenues of all companies, 6.6% of bank exposures to companies, 5% of operating revenues of companies, and 5.3% of value added. We identified which industries are most at risk, where C29 – Manufacture of motor vehicles, trailers and semi-trailers, and C24 – Manufacture of basic metals are most exposed. By analysing default rates and trade receivables data, we concluded that the risks have not yet materialized.
Next, we performed risk assessment of municipalities that are exposed to the identified companies at risk. At the municipality level, we found some clusters around a few municipalities with larger shares of industrial facilities or operating revenues at risk.
It is important to emphasize that we arbitrarily set the threshold of the share of trading receivables to operating revenues to Germany to 10%. It definitely is not the case that all those companies will default or become insolvent. Nonetheless, it may happen that many of these companies will need to revise their manufacturing mix or business strategy.
In the analysis, we performed some robustness checks to test other thresholds. First we performed robustness analysis for the share of trade receivables. Next, we changed some other conditions. For instance, we relaxed the limitation of company dependence solely on the German market or to the manufacturing sector. Due to data limitations, our analysis has certain drawbacks. Note that we addressed many of the possible limitations in our various robustness checks. Our list of performing companies at risk does not include companies that are not part of the SloExport database or the trade receivables database (i.e. small companies and sole proprietors). Nevertheless, we have performed tests and concluded that the coverage is adequate. We also addressed other limitations of the analysis. For instance, we do not consider other current risks that could exacerbate the situation for companies, such as geopolitical risks, energy prices, climate risks or US trade tariffs.
The impact on operating revenue, exposure to companies, added value and number of employees appears to be manageable. However, it is important to note that the estimates are based on certain aforementioned assumptions and that this represents only the first-round effects, with potential troubling supply chain spillovers. Hence we provided some analysis of possible spillover effects as well. We utilized input-output tables to assess possible spillover effects along the supply chains.
This research offers valuable guidance for policymakers aiming to mitigate risks and support affected businesses. Identifying vulnerable companies at the company level presents significant advantages over aggregate approaches (such as those based on input-output tables) as it enables more precise targeting of at-risk industries and opens the door to further analytical extensions. For example, one could model default probabilities for these companies and expand the analysis toward stress testing the banking sector or the broader economy. Moreover, examining the economic impact on municipalities with high exposure could yield important insights, including shifts in local employment, tax revenues, and overall economic activity. Although the analysis does not account for the recent US tariffs imposed on the EU, it remains highly pertinent, as these measures are expected to have a direct impact on the European automotive sector.
ACEA. (2023). Facts about the automobile industry. Retrieved from https://www.acea.auto/fact/facts-about-the-automobile-industry/
AJPES. (2023). Company accounting data.
ECB. (2024). Will the euro area car sector recover? Economic Bulletin, Issue 4, 2024. Retrieved from https://www.ecb.europa.eu/press/economic-bulletin/focus/2024/html/ecb.ebbox202404_05~4b16a76f7d.en.html
European Commission. (2024). The future of European competitiveness. In-depth analysis and recommendations.
Retrieved from https://commission.europa.eu/document/download/ec1409c1-d4b4-4882-8bdd-3519f86bbb92_en?filename=The%20future%20of%20European%20competitiveness_%20In-depth%20analysis%20and%20recommendations_0.pdf
Eurostat. (2022). FIGARO input-output tables industry-by-industry. Retrieved from https://ec.europa.eu/eurostat/web/esa-supply-use-input-tables/database
Ortl, A., Sajinčič, M. (2025). Risk Assessment of Slovenian Companies and Banks Exposed to the German Automotive Industry. Prikazi in analize. Banka Slovenije, 8/2025
SloExport (2024). Database of Slovenian Exporters. Retrieved from https://www.sloexport.si/Search
Slovenia Business. (2023). Automotive industry in Slovenia. Retrieved from https://www.sloveniabusiness.eu/industries-and-technologies/automotive-industry
Sokolovska, I. (2022). Poročilo o podnebnih tveganjih v Sloveniji 2021. Prikazi in analize. Banka Slovenije, 3/2022.