menu
close

Author(s):

Alexandre d’Aspremont | CNRS
Jean-Charles Bricongne | Banque de France
Benjamin Lietti | CEPS
Baptiste Meunier | European Central Bank (ECB)

Keywords:

Data science , big data , satellite data , machine learning , nowcasting

JEL Codes:

C51 , C81 , E23 , E37

The Covid-19 crisis has demonstrated the need for alternative data, available in real-time and with global coverage. In that vein, this paper exploits daily infrared images taken from satellites to track economic activity in 42 advanced, emerging and developing countries. In our paper (d’Aspremont et al., 2023), we construct an algorithm based on the laws of physics and machine learning techniques to detect the heat produced by cement plants in activity. This allows us to monitor in near real-time the activity of more than 500 cement plants across 42 countries. Given the predominant role of cement in construction, such satellite data significantly improves the nowcasting of activity in the construction sector compared to other alternative high-frequency indicators (PMI, Google Trends). Finally, empirical results suggest that using neural networks improves nowcasting performances.

Chart 1: Satellite image of a cement plant in China (Before/During Covid-19)
 width=
Source: Sentinel-2, authors. Note: The pixels colored in red are those for which the algorithm detects the heat of the cement kilns.

Cement, an ideal candidate for monitoring economic activity

Cement is the basis of much man-made infrastructure, making it the second most used material in the world after water. This highlights its major role in the global economy. In addition, from production to final consumption, cement has many characteristics allowing the monitoring of its production by satellites as well as its use as an early indicator of the business cycle.

First, in order to produce cement, a key step after the extraction of raw materials (limestone, shale, clay, iron ore, silica sand) is to heat those in rotary kilns (type of thermally insulated chamber, or in non-technical terms, an oven) at a temperature of about 1,450°C. This triggers a chemical reaction ending in the synthesis of clinker, an intermediary product in the manufacture of cement. The important heat emitted during this process can be detected by infrared sensors on satellites: using a sequence of algorithms explained below, we obtain images such as in chart 1. This allows us to detect whether rotary kilns are working (left-hand side) or halted (right-hand side).

Second, the very low cost of cement has advantages. Since the production process requires major energy expenditure, it is reasonable to assume that if an oven is identified as active, it produces its maximum capacity to be profitable. The capacity of each plant being public data implies that the volume of production can be estimated directly from the number of ovens that are working. This guarantees the accuracy of our indicator, as satellite data can only tell whether the kiln is working or not. Moreover, the low price of cement makes it unprofitable to ship it over long distances, thus allowing to draw a clear link between local production and local consumption – or activity in the local construction sector.

Finally, since cement is an unstable material and very sensitive to humidity, it is generally consumed shortly after its production. This makes it possible to draw a link also in time between cement production and activity in the construction sector. All these characteristics therefore allow for the development of an accurate economic indicator in space and time.

Satellite: Global, Uniform, Real-Time Data for Economists

Satellite data offers several advantages, including global and uniform coverage, real-time availability, and being free of charge. These advantages contrast with traditional data, which often have significant delays in publication, and whose quality and reliability can vary from one country to another. Additionally, the increasing number of satellites and their sophistication make satellite data an increasingly promising source for various applications.

While existing literature on exploiting satellite data has primarily focused on nighttime lights (Donaldson and Storeygard, 2016) and more recently air pollution (Bricongne et al., 2021), we use a data source that remains untapped in economics: infrared images. Our ability to leverage infrared images is made possible by the Sentinel-2 satellites launched by the European Space Agency in 2017. Every day, these satellites capture images of Earth showing the intensity of emissions in the infrared spectrum.

Our underlying idea relies on Planck’s law, which characterizes the emission profile of hot bodies among the different infrared bands. Planck’s law postulates that, between two different infrared bands, the emissions are very different at high temperature but similar at low temperature. We then use a sequence of algorithms exploiting the difference of emissions across infrared bands to determine whether an object on the ground is hot or not. Applying this methodology to all cement plant kilns in our sample allows us to discern whether each kiln is operational (“hot”) or not (“cold”) at each point of time.

One challenge in using satellite images is however the interference caused by clouds, which can affect infrared emission measurements. To address this, we employ an artificial intelligence (AI) image recognition algorithm trained to identify clouds on images. This enables us to automatically identify the amount of cloud cover on an image. Observations with excessive cloud cover are excluded to preserve the quality of our indicator.

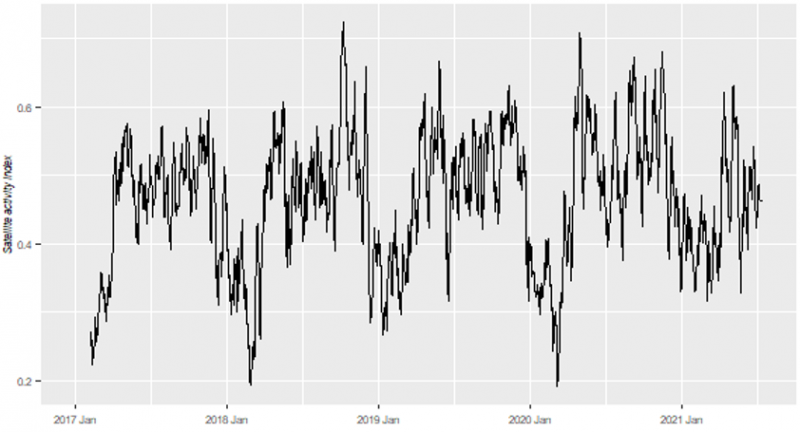
Additionally, given that the satellite revisit period (i.e. the time between two images of the same location) is approximately 4 days on average, we use machine learning algorithms to interpolate the missing data. This step helps us maintain a near real-time index of cement plant activity at daily frequency for all countries, similar to the example shown in chart 2 for China.

Chart 2: Activity index for China (7-day moving average)
 width=
Source: Sentinel-2, authors.

An innovative and more efficient indicator than reference models

We then test the ability of our satellite activity index to forecast cement production and activity in the construction sector. The nowcasting model based on our satellite indicator overperforms all benchmark models, including those based on the usual indicators.

First, we aggregate our daily activity index to the monthly frequency to match the frequency of official data and use a linear model to nowcast cement production and activity in the construction sector. This model based on our satellite index gives more accurate out-of-sample forecasts not only compared with usual benchmark models (random walk and autoregressive model) but also with similar linear models based on usual construction indicators (building permits, Purchasing Managers Index (PMI) surveys, and Google Trends).

In a second step, we try to exploit the time and spatial granularity of our satellite data. To obtain previous results, daily indices of each cement plant were aggregated at national level and to a monthly frequency. We use advanced econometric models to use disaggregated data: (i) a MIDAS model to exploit the time dimension, (ii) a LASSO model to exploit the spatial dimension, and (iii) a LASSO-MIDAS to exploit both dimensions. However, the accuracy of forecasts of models based on disaggregated data is on average similar to the model on aggregated data. This can be explained by the very high number of parameters to be estimated (one for each plant-day pair) compared to the small size of our sample – as our sample goes back only until 2017.

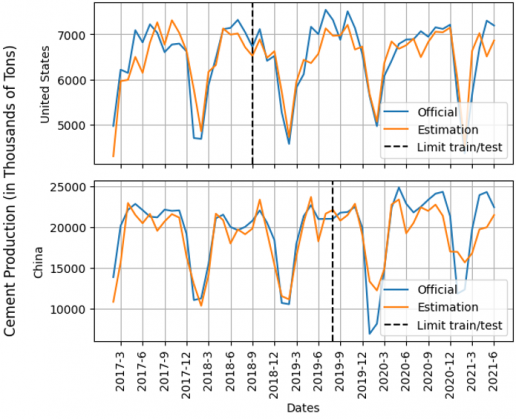
We finally explore non-linear regressions using neural networks. The performance of neural networks is superior to that of the linear model and allows for accurate predictions, as shown in chart 3. This is another contribution of our study: to show that neural networks can be useful for nowcasting (forecasts on the present or the recent past, allowing to have advanced signals compared to the official figures) even for time series in macroeconomics with limited timespan. This confirms recent applications of nowcasting with neural networks for GDP (Woloszko, 2020) and trade (Hopp, 2021).

Chart 3: Cement production forecast in China (L.) and USA (U.) with neural networks
 width=
Source: Sentinel-2, authors. Note: Estimate (in orange) of official cement production (in blue). Data in level and not seasonally adjusted.

In conclusion, this article opens perspectives for the use of satellite data. First, it shows that satellite data can be a useful complement to official statistics, allowing for a high-frequency monitoring of the business cycle, which can be interesting in crisis periods such as the Covid-19 pandemic. This can allow for more granularity than official statistics, as our satellite index can also capture regional cement production and activity in construction – provided that the number of cement plants is sufficient. Second, while our work focuses on cement, it can be extended to other heat-emitting activities such as the production of steel or glass, thus covering a more significant part of industrial activity. Third, satellite data allows coverage of emerging and developing countries, potentially allowing for an unbiased economic monitoring of countries where official statistics are lacking.

About the authors

Alexandre d’Aspremont

Alexandre d’Aspremont, CNRS – ENS Paris. After dual PhDs from Ecole Polytechnique and Stanford University in optimisation and finance, followed by a postdoc at U.C. Berkeley, Alexandre d’Aspremont joined the faculty at Princeton University as an assistant then associate professor with joint appointments at the ORFE department and the Bendheim Center for Finance. He returned to Europe in 2011 thanks to a grant from the European Research Council and is now directeur de recherche at CNRS, and professor at Ecole Normale Supérieure in Paris. He received the SIAM Optimization prize for 2004-2007, a NSF CAREER award, and an ERC starting grant. In 2016, he co-founded Kayrros, an earth observation startup. His research focuses on convex optimization and applications to machine learning, statistics, climate and finance.

Jean-Charles Bricongne

Jean-Charles Bricongne is currently Deputy-Director in the Microeconomic and Structural Analysis Department in Banque de France. He graduated from the Ecole Centrale Paris, from Sciences Po Paris and holds a PhD from the University of Paris I Panthéon-Sorbonne. He previously worked as a seconded national expert on internal imbalances in the European Commission (DG ECFIN), especially on credit and housing. He was before counsellor of the General Director of Economics and Research, Head of a unit in charge of trade and competitiveness in Banque de France, and seconded expert on monetary and financial issues in the French statistical institute (INSEE). He has been a Senior Lecturer at Sciences Po Paris, Professor at Paris Dauphine University and Adjunct Professor in Tours and Orléans Universities. He is an affiliate researcher in LEO (Laboratoire d’Economie d’Orléans) and LIEPP (Laboratoire Interdisciplinaire d’Evaluation des Politiques Publiques, connected to Sciences Po Paris). He has written on various topics in applied trade analysis, globalization statistics, financial macroeconomics, housing, migrations and the links between financial and real economy.

Benjamin Lietti

Benjamin Lietti is a PhD student at the Center for Economics at Paris-Saclay (CEPS). He holds a Master of Science degree in Economics (with a focus on Macroeconomics and Quantitative Economics) from the University of Lausanne in Switzerland. His current research focuses on utilizing Satellite Data and Machine Learning techniques applied to Economics.

Baptiste Meunier

Baptiste Meunier is an economist at the External Developments division of the European Central Bank (on leave from Banque de France). He holds a Master’s degree in Economics and Public Policies from Sciences Po Paris, is a former student of the Ecole Polytechnique, and has studied data science at the ENSAE. His research covers the use of alternative high-frequency data and machine learning in macroeconomics, while also focusing on trade flows. He currently pursues a PhD at the Aix-Marseille School of Economics.

More on these topics

Tags: