We present a general equilibrium sectoral model designed to produce macroeconomic scenarios that incorporate transition risks associated with green policies. The model is calibrated to the Spanish economy, and it can simulate the impact of shocks to the price and coverage of greenhouse gas emission allowances, with particular attention to sectoral asymmetries arising from (i) the energy intensity of each industry, (ii) the source of that energy, and (iii) the interdependencies with other industries. We show that for an increase in the price of emission allowances similar to that observed in recent years (from approximately €25 per tonne of CO2 in 2019 to almost €100 per tonne in 2022) the model predicts a cumulative decline in Spanish GDP after three years of 0.37%. The loss in value added is heterogeneous across industries, ranging from 4% in the most severely affected industries to virtually no impact in the least affected industries.
Cross-sector differences in greenhouse gas (GHG) emission volume and intensity suggest that the green transition poses a highly uneven challenge for the different industries. An individual sector’s exposure to the transition risks of climate change depends not only on its direct GHG emissions but also on the links with other sectors. In this note we propose a framework to account for this and quantify at a more granular level the transitional impact of green policies.
We develop a general equilibrium sectoral model à la Baqaee-Fahri to assess the implications of industries’ asymmetrical exposure to the green transition process. The CATS1 model is calibrated to the Spanish economy, and it can be used to generate short- and medium-term scenarios related to the transitions risks or policies taken to mitigate climate change. We use this model to assess the degree of exposure of different productive sectors in the event of an increase in the price of emission allowances or an extension of EU-ETS coverage.
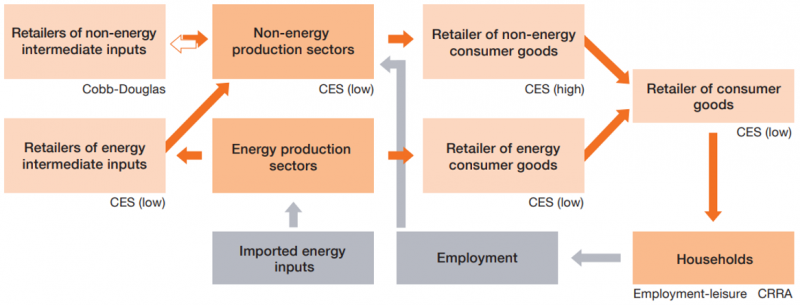
The model has a highly granular structure, with 51 non-energy sectors and two energy sectors (fuel and electricity), and includes the cross-sectoral relationships contained in the input-output matrix. Figure 1 shows the different relationships in this economy: There is a final good that is produced combining the energy and non-energy final goods under a CES technology with low elasticity of substitution. Each of these two goods comes from a different retailer. The energy retailer aggregates the two energy inputs using a CES technology with low elasticity from the energy producers into a homogenous good. Likewise, the non-energy retailer aggregates the non-energy goods under a CES technology, with high elasticity of substitution in this case, coming from the 51 non-energy producer sectors. The production in this sector combines energy, labor and intermediate-inputs from the rest of the non-energy sectors under a CES function with low elasticity. The energy producer imports basic energy inputs from the rest of the world and sells to the non-energy and energy retailer. Finally, households consume the final good and work in the 51 non-energy sectors.
Figure 1: Summary representation of the model structure
With this model we can identify the general equilibrium effects stemming from changes in the relative prices of the different economic sectors’ products in response to different shocks, together with the magnitude of the potential substitution processes between different intermediate inputs and consumer goods in the economy. The characterization of the model is designed to be capable of capturing the different shares of energy in the production functions of the various industries, their emissions intensities, and the interrelations between them. The model calibration for Spain replicates the share of each sector in household consumption, the share of energy in the inputs of the various non-energy sectors, and the relative size of the various industries in terms of emissions and output.
Figure 2 shows the impact of an increase in the price of emission allowances or an extension of EU-ETS coverage. In particular, in the event of an increase in the price of emission allowances similar to that observed in recent years (from approximately €25 per tonne of CO2 in 2019 to almost €100 per tonne in early February 2022), the model predicts a cumulative decline of 0.6% in Spanish GDP after three years. If an extension of ETS coverage to include all productive sectors’ emissions is added, the model predicts a fall of 1.3% in GDP after three years.2
Figure 2: Sectoral impact of environmental emission policies after 3 years
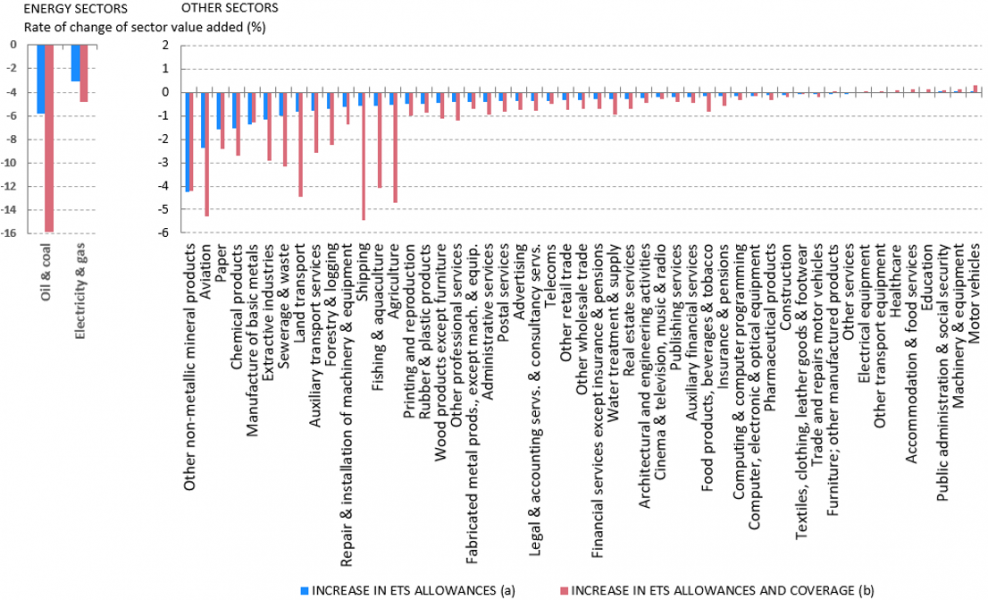
Source: See Aguilar et al (2022).
a. Increase in price of CO2 emissions, from €25 to €100 per tonne
b. Increase in price of CO2 emissions, from €25 to €100 per tonne, and extension of coverage of EU-ETS to include all the emissions from all the productive sectors
The CATS model is particularly useful for a qualitative assessment of the potential sectoral asymmetries resulting from these policies. As shown in Figure 2, an increase in the price of ETS emissions reduces activity in non-energy sectors such as building materials and other non-metal mineral products, aviation, paper and chemical products. The impact is not necessarily higher in those generating larger emissions, but those that were covered by the ETS, or those trading heavily with sectors that are directly affected. This is the case, for example, of printing and recorded media, that buys a lot of inputs from paper manufacturers, and of repair and installation of machinery and equipment, that sells a lot of their products and services to various chemical and metal manufacturing sectors. On the other hand, sectors such as agriculture and fishing, that have relatively high emissions intensity, are not particularly affected by this shock, since their regulatory ETS coverage is low. On the other hand, in the simulation where ETS coverage is also extended, agriculture and fishing is one of the sectors most affected, together with transport sectors. As in the first simulation, some industries are indirectly hit through their commercial relations with other highly-affected sectors (warehousing and support for transportation, repair and installation of machinery and equipment, water collection and supply). In both scenarios there would be a significant reduction in energy use, which would be most acute in the case of fuels: the model predicts that higher emission prices and ETS coverage would accelerate the electrification of the economy.
As a conclusion, the heterogeneous impact of green policies may pose potential risks for financial stability and evidences the importance of the right diversification for banks to diminish their exposure to transition risks. We propose a framework to account for these effects that can be useful for building stress testing scenarios.
Aguilar, P., B. Gonzalez, S. Hurtado (2022). “Carbon tax model (CATS): A sectoral model for energy transition stress test scenarios”, Bank of Spain Ocassional Papers, 2218.
Baqaee, D. R., and E. Farhi (2019). “The macroeconomic impact of microeconomic shocks: beyond Hulten’s theorem”, Econometrica, 87 (4), pp. 1155-1203.
Commission, E. (2020). “Climate change impacts and adaptation in Europe”, JRC PESETA IV final reports.
Nordhaus, W. D. (2017). “Revisiting the social cost of carbon”, Proceedings of the National Academy of OECD (2015). The Economic Consequences of Climate Change.
This paper was previously circulated under “Carbon Tax Sectoral Model” as published in https://www.bde.es/f/webbde/SES/Secciones/Publicaciones/PublicacionesSeriadas/DocumentosOcasionales/22/Files/do2218e.pdf. We maintain the short-name of CATS for its simplicity.
In any event, the scale of these aggregate impacts must be interpreted with the utmost caution. In particular, the model does not include certain aspects that could be critical for a quantitative determination of the implications of the green transition for the economy overall; for instance, the possibility of a non-linear acceleration in technological change or in the implementation of short-term energy efficiency measures in response to large shocks Also, as with other models, the results of the CATS model are sensitive to certain assumptions and to the calibration of key parameters, such as the different economic sectors’ capacity to substitute their inputs, and how the tax revenue stemming from the ETS is used.