A fact of the modern global economy is that services generate more than two-thirds of global economic output, attract over two-third of foreign direct investment, and provide almost two-thirds of jobs in developing countries, four-fifths in developed ones.
Another fact of the modern global economy is that services still only account for a fifth of world trade. But there is every indication that this gap will narrow in the coming decades – and perhaps more quickly than many realize – as technology creates a new global marketplace for medical, education, business, and information services, as well as for finance, communications, entertainment, and many others.
Services are already the fastest growing sector of world trade. While merchandise exports have increased at a modest 3% annually since 2008 (see Figure 1), services exports have expanded at almost double that pace, 5.1%. Services share of world trade has grown from just 9% in 1970 to over 20% today – and at this rate, it is forecast that services could make up well over a third of world-trade by 2030. This would represent a doubling of global services trade volumes in just over a decade – from roughly US$5.4 trillion today to over $11 trillion in 2030.
A common perception is that globalization has slowed down. But if the coming wave of services trade is factored in – not just the modest increases in goods trade – then globalization seems poised to accelerate.
Figure 1: Goods and services trade growth, 2008=100
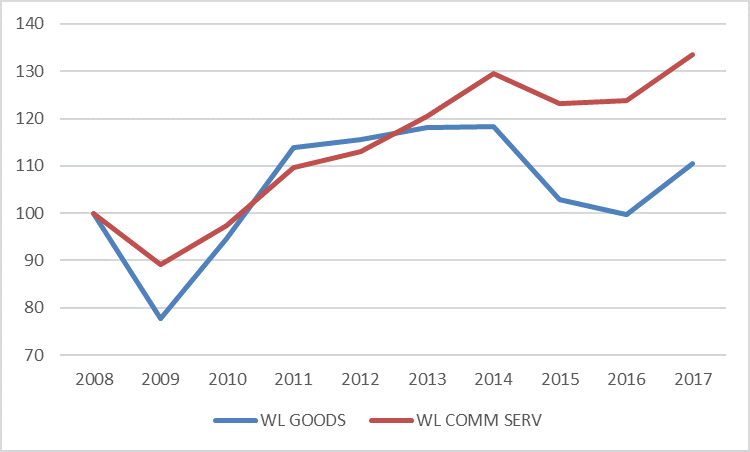
Notes: The graph shows goods and commercial services trade growth indexed at year 2008. Trade in services reacts less to shocks in the economy than trade in goods, and trade in services is growing more than trade in goods.
The growing role of services in the global economy is a delayed reflection of services already dominant role in national economies. During the 19th century, more and more economies evolved from agrarian to industrial; a transformation so profound it is termed the “industrial revolution”. And during the 20th century, even more economies evolved from industrial to services-based; an equally profound – and even more rapid – transformation that could be termed the “services revolution”.
Services and manufacturing have become so intertwined that the boundary between them is now blurred across many sectors. Automakers, for example, are now service providers – routinely offering financing, product customization, and after-market care. Likewise, on-line retailers are now manufacturers – producing the computer hardware to access their networks, as well as many of the goods they in turn sell. Meanwhile, new products, like 3-D printing, cannot be classified as either goods or services and are instead a blended hybrid of the two.
Services already account for 75% of GDP in advanced economies today – up from 40% in 1950 – and this share seems likely to rise. In Japan, for example, services represent 68% of GDP; in New Zealand, 72%; and in the US, almost 80%. But because economies have been expanding at an even faster rate, services rising share of GDP has not come at the expense of manufacturing. On the contrary, in the US manufacturing output doubled between 1980 and 2015 even though its share of employment fell from over 40% to less than 10%. “Deindustrialization” – the shift from manufacturing to services employment – is a sign, not of economic decline, but of economic progress.
Distribution services and financial services are the largest traded services globally, with $2,636 billion and $2,464 billion respectively, and accounting for 19.5% and 18.6% of total services trade in 2017 (Figure 2).
Figure 2: World trade in commercial services by sector, 2005 and 2017
(Billion dollars and percentage)
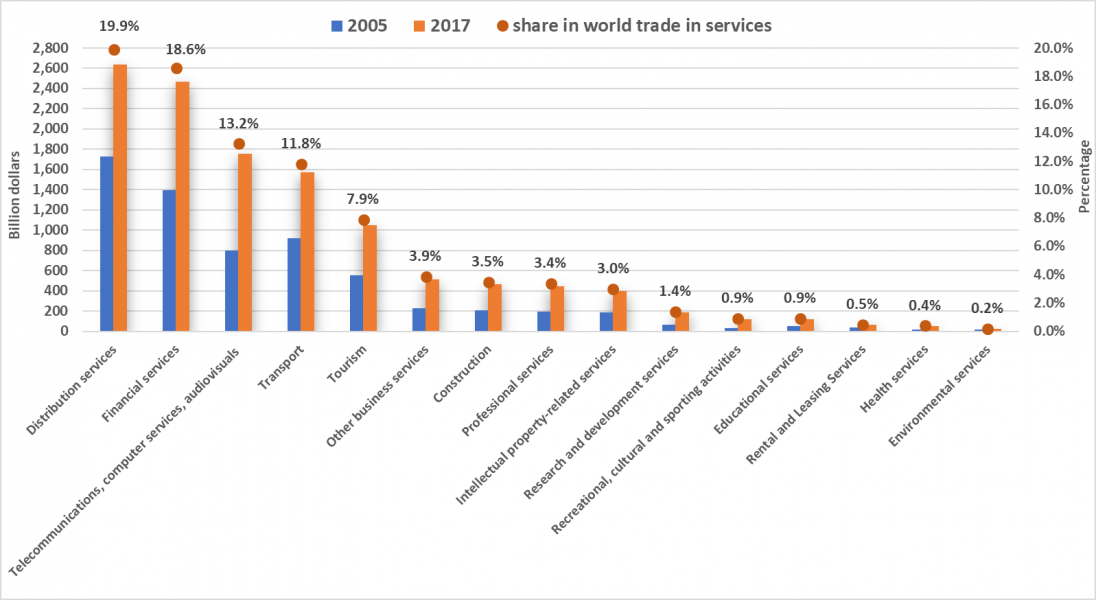
Note: World trade is calculated as the average of world exports and world imports.
Source: WTO estimates.
According to estimates, world trade in financial services and in distribution services takes place predominantly through the establishment of a commercial presence in other countries (mode 3 – see below for discussion). In 2017, around 77% of financial services, or some $1,942 billion, and over 70% of distribution services, some $1,853 billion, were traded worldwide through foreign affiliates.
Technological change is – and will continue to be – the main cause of the growing tradability of services. Just as the transport and communications revolution (containerization, airfreight, fibre optics) drove down the cost of trading tangible goods in recent decades – giving rise to globalized manufacturing – so too is the digital revolution (the internet, big data, artificial intelligence) driving down the cost of trading intangible services – giving rise to a globalized services market.
Services that were once among the least tradable products are becoming the most tradable today – causing a fundamental shift in a 60-year-old economic paradigm about tradable versus non-tradable sectors. Not too long ago, only local doctors and hospitals provided medical services. Accessibility was limited by geography, competition was constrained, and quality could vary dramatically across countries, regions, even neighbourhoods.
However, increased digitalization, e-banking, mobile banking, and online sales are reshaping the business models for the finance and distribution sectors. Although banks and other financial services institutions maintain affiliates abroad for operations, they have adapted to changes in consumers’ preferences offering an increasing number of services online, from credit card transactions to finance management. Insurance companies provide online underwriting and claim submission, a fraction of online cross-border services that digitalization is expected to bring in the industry in near future.
As a result, the share of services exports through branches and subsidiaries established in other countries, is declining in leading developed traders. For example, in the European Union, this trend started in the financial sector after the 2009 global financial crisis, along with the banking system’s post-crisis structural transformation. In 2017, the share of financial services exported by EU controlled affiliates was 6 percentage points lower than in 2005, matching development in the United States. At the same time, the United States’ financial services exports through cross-border transactions almost tripled compared with 2005, reaching $109.6 billion.
But while technology is necessary for expanding services trade, it is not sufficient. More liberal and enabling policies – and greater cross-border regulatory cooperation – will be equally critical. While the world trading system has proved highly successful in opening up goods trade – helping to drive 20th century globalization – it has so far proved much less successful at opening up (or keeping open) trade in services – the new driver of 21st century globalization. Six decades of trade negotiations – bilateral, regional, and multilateral – have thus resulted in a global economy in which trade in goods is far freer than trade in services. The tariff equivalents of aggregate services barriers in developed markets can be as high as 20%, and in developing markets as high as 60%.
This imbalance partly reflects the historical importance of merchandise trade, and the tendency of countries to focus their negotiating efforts on lowering barriers to agricultural and manufactured exports. But it also reflects the reality that many of the barriers to goods trade – such as tariffs or quotas – are simpler and easier to reduce than the equivalent barriers to services trade – such professional standards, licensing requirements, or work visas – which are more complex, more politically sensitive, and more linked to other policy concerns besides trade.
Liberalizing services will not only require governments to devote more attention to this new trade frontier, but to develop new policy tools and approaches. If past negotiations to liberalize good trade were driven mainly by tariff bargaining – the exchange of one market access ’concession’ for another – future negotiations to liberalize services trade will be driven more by regulatory cooperation – the effort to harmonize standards, improve information exchanges, or advancing shared policy objectives. Goods-centred trade agreements will need to increasingly become services-centred trade agreements.
And since services cross over into other policy areas beside trade – from health, to education, to immigration – advancing services negotiations will also require deeper cooperation – and more policy coherence – with non-trade actors. This is particularly true in the area of investment, since over two-third of global FDI flows into service sectors.
The many ways that services can be traded, which are referred to as “modes of supply”, can also be a source of misunderstanding. The WTO General Agreement on Trade in Services (GATS) categorizes services trade according to four modes of supply:
Supply of services through mode 1 is perhaps most easily recognized as international trade. Examples include consultancy services over the phone or legal services provided in one country to clients in other countries by e-mail or video. Spending by tourists in other economies or students studying abroad are two common examples of mode 2. When a foreign-owned retailer or bank supplies services to local consumers such a transaction would be classified as mode 3, while their services production would be counted towards this economy’s GDP. Finally, an architect or an engineer moving abroad temporarily to provide their services would be an example of mode 4. There are many other examples too numerous to list here.
Statisticians face various challenges in categorizing and measuring international trade in services. In some cases, the distinction between goods and services trade is unclear. For example, streaming a movie from a digital platform in another country is counted as trade in services, but if the movie is stored on an imported DVD, it is considered as trade in goods. In Figure 3 below we report recent estimates generated by WTO statisticians in an effort to measure services by modes of supply. By estimating mode 3, foreign affiliate sales, we can provide a more complete picture of cross border connections for global service sectors. Growth in all modes of supply has been substantial, but even more important is to note the very large role that commercial presence (mode 3) plays in global commerce.
Figure 3: World trade in commercial services by mode of supply, 2017
(Trillion dollars and percentage)
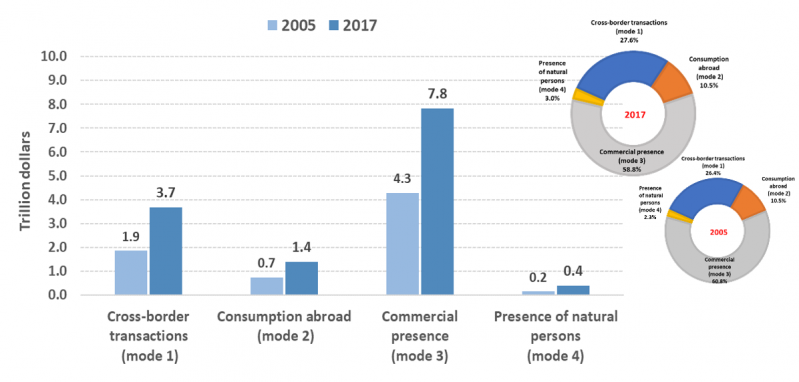
Source: WTO estimates. World trade is calculated as the average of world exports and world imports.
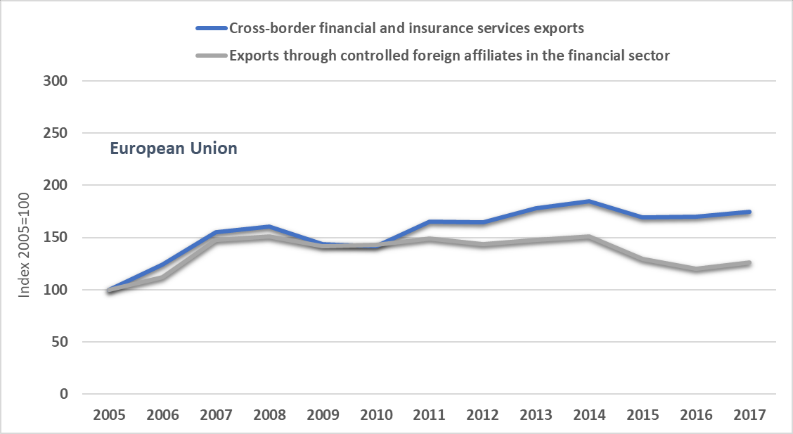
Another interesting trend is the declining or slowing growth of exports through controlled foreign affiliate sales for the European Union and the United States for financial and insurance sectors (Figure 4) while direct cross border exports for these sectors have increased. Likely due to technological change and increased digital penetration in these business models.
Figure 4: European Union and the United States: cross-border financial and insurance services exports and exports through controlled affiliates abroad (mode 3), 2005-2017
(Index 2005=100)
 |
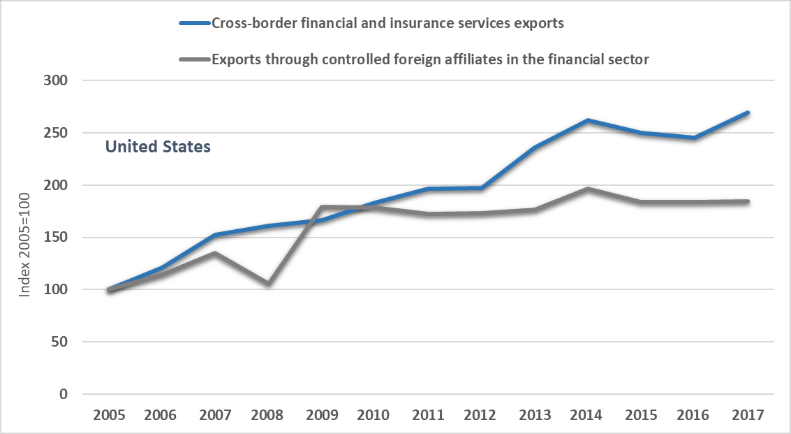 |
Note: The European Union is calculated as the sum of the European Union member states and includes intra-EU trade. Source: WTO estimates.
In distribution services, electronic payments, innovative software, and the rise of mobile technology have enabled consumers to order goods online from anywhere in the world. This has resulted in a boom of cross-border sales online with many wholesalers and retailers, especially in developed economies, closing physical stores and choosing to sell online, or blending physical presence with online ordering and delivery options.2 Brick and mortar distributors face fierce competition on the web and, to satisfy consumers’ expectations for fast delivery, they need to rely on reliable transport operators.
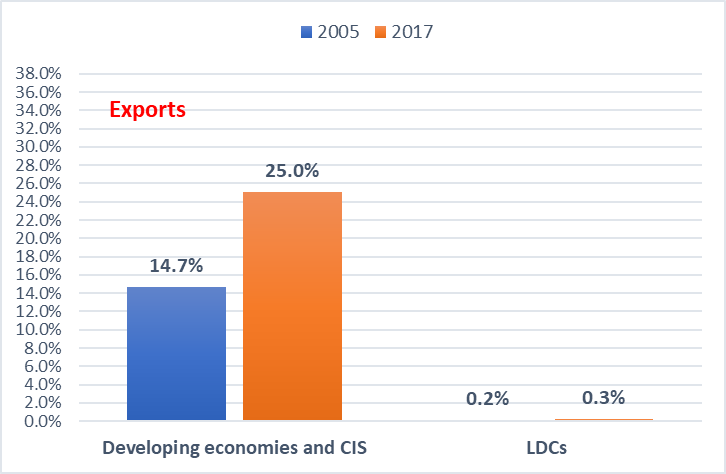
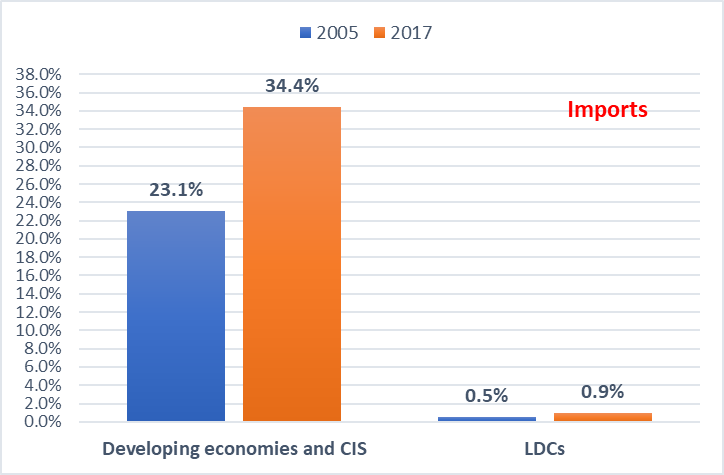
In 2017, developing economies and the CIS exported and imported services for $3.4 trillion and $4.5 trillion respectively, with a 25% share of world services exports and 34.4% of global services imports (Figure 5). This represented a gain of almost 1 percentage point of share in trade per year since 2005. Such an impressive result is the outcome of a process of structural economic transformation and successful trade diversification from goods to services in several developing economies, in Asia in particular, and the emergence of new services traders and new ways to trade services.
By contrast, in twelve years, LDCs increased their share in global services exports by a negligible 0.1 percentage point. In 2017, LDCs accounted for only 0.3% of world services exports, or $38.6 billion and, on imports, their participation was at less than 1%, with services imports totalling $124.4 billion. Commercial services production in LDCs is on average at 40% of GDP, well below middle-income economies (over 50%) and high-income economies (generally above 70%).
Figure 5: Share in world trade in commercial services by group of economies, 2005 and 2017
(Percentage)
 |
 |
Source: WTO estimates.
In fact, income plays a role. More than half of the ten leading developing services and CIS traders are high-income economies from Asia and the Middle East, the remainder classified as upper middle-income, with only one economy as lower middle-income.3
Developing economies’ participation in services trade is not yet inclusive. A close look reveals that trade is very concentrated with the same five economies ranking both as leading services exporters and importers, although in different order. In 2017, China was the global services trader, followed by Hong Kong, China, Singapore, the Republic of Korea, and India.
These five Asian economies accounted for 56.3% of developing economies and CIS’ exports and 50.1% of imports. They are the main drivers of developing economies’ impressing trade performance, with services exports rising by over 12% on annual average since 2005, almost three times faster than in developed economies. From R&D and IP-related services to ICT services, professional services, or finance, these five economies are penetrating also the highest segments of services trade.
Services are a growing share of global economic growth and global trade growth. Financial services remains a fast growing services sector, and it appears to be a sector heavily affected by technological change. Developing countries are increasing their role in the global services market, and with global services trade expected to increase more rapidly than goods trade in the future one might expect their role to continue to grow. World trade rules for services are well established in the WTO’s General Agreement on Trade in Services, but a rapidly changing world might mean that WTO member countries, and their stakeholders, may want to ensure the GATS continues to be fit for purpose.
With contributions from John Hancock, Emmanuelle Ganne, and others. This note draws from the World Trade Organization’s World Trade Report 2019: The Future of Services Trade. Many contributors produced the report – for a full list please see the acknowledgements section on page 3 of the report. Any and all errors in this extract and rework are mine.
At present, the value of international trade in goods through e-commerce is not yet known. The international statistical community is actively engaged in the development of a measure.
According to the World Bank income classification based on GNI per capita. Hong Kong, China, Singapore, the Republic of Korea, Chinese Taipei, the United Arab Emirates and Israel are classified as high-income economies, China, the Russian Federation, Brazil, and Mexico, as upper middle-income, and India as lower middle-income.