Assessing the relative importance of supply and demand shocks in driving the inflation cycle is key to set the appropriate monetary policy stance. In this article, we evaluate the role of energy in driving inflation in the euro area since mid-2021. We use different empirical models and show that shocks to energy prices have exerted considerable (direct and indirect) effects on inflation. The contribution of these shocks to headline inflation is estimated to be around 60 per cent in the fourth quarter of 2022. There is also evidence of an increase in the pass-through of energy prices to euro-area core inflation as a consequence of this large unprecedented shock. Looking forward, the impact of the fall of energy prices from the peaks reached in 2022 and that of the sharp tightening of the ECB’s monetary policy should support the return of inflation to the 2 per cent symmetric target.
In mid-2021, energy prices started rising in global markets, reaching historically maxima in 2022. While the initial increase reflected a host of factors, including the rebound of real activity across the globe after the most acute phase of the Covid-19 pandemic and the below target production of oil by OPEC+, the economic consequences of the Russian invasion of Ukraine further fueled the prices of energy commodities, especially gas, in Europe. The magnitude of these increases was unprecedented. By August 2022, the monthly average spot price for gas and electricity had increased by more than 400 per cent compared with one year before.
Headline inflation in the euro area reached double digits in October 2022 (to a historical record of 10.6 per cent; Figure 1 panel a). The energy component increased by more than 40 per cent year-on-year (Figure 1 panel b), directly contributing by about 4 percentage points (p.p., henceforth) to the rise of the headline consumer price index. Core inflation reached also unprecedented levels (with a peak of 5.7 per cent in March 2023), reflecting almost equally the contributions of non-energy industrial goods and services.
Figure 1: Decomposition of headline and energy inflation in the euro area
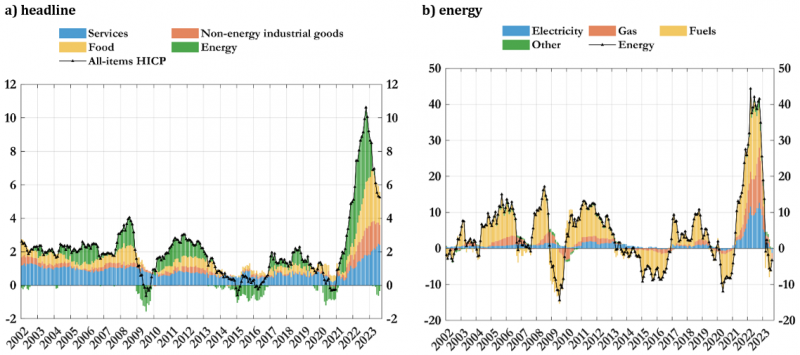
Source: authors’ calculations on Eurostat data. Note: the black solid line represents headline (panel a) and energy (panel b) inflation, while the bars show the contributions of the main components.
In a recent paper (Neri et al., 2023), we have provided empirical evidence on the role of the surge in energy prices for inflation in the euro area using different econometric models (structural VARs, time varying Phillips curve, dynamic factor models) and identifying assumptions. As summarized in Table 1, the contribution of energy shocks to headline inflation is estimated at roughly 60 per cent, on average, in 2022, while for core inflation it ranged between 20 and 30 per cent depending on the model. The peak contribution is reached in the final quarter of the year when energy shocks indirectly accounted for up to nearly half of the level of 5.1 per cent reached by core inflation. Some details for these results are provided below. An update of this analysis shows that also in the first half of 2023 the indirect effects of the energy shock have continued to provide significant contributions to headline and core inflation in the euro area.
Table 1: Percentage contribution of energy prices to euro area inflation in 2022 (per cent)
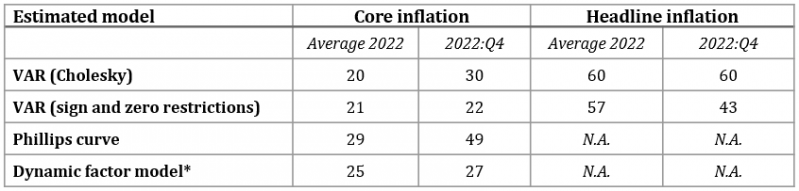
(*) DFM contributions of energy prices are computed using the common component of core inflation.
In a first exercise, we employ a structural VAR model (as in Corsello and Tagliabracci, 2023) to quantify how these large shocks to energy prices propagated to the other inflation components and to provide counterfactual estimates of core and food inflation absent the effects of such shocks. Figure 2 shows the main results depicting the overall effects to headline inflation. The negative energy shock at the beginning of the pandemic period exerted a downward pressure on headline inflation, which lasted until the first half of 2021. The direct effects start to bite in the second part of 2021, and indirect effects turned positive in 2022, with a gradual and rising upward pressures. Overall, headline inflation was directly affected by the energy component by almost 4 p.p. in the fourth quarter of 2022, while indirect effects contributed by more than 2 p.p., accounting for around 60 per cent of headline inflation.
Figure 2: Contributions of energy components to headline inflation
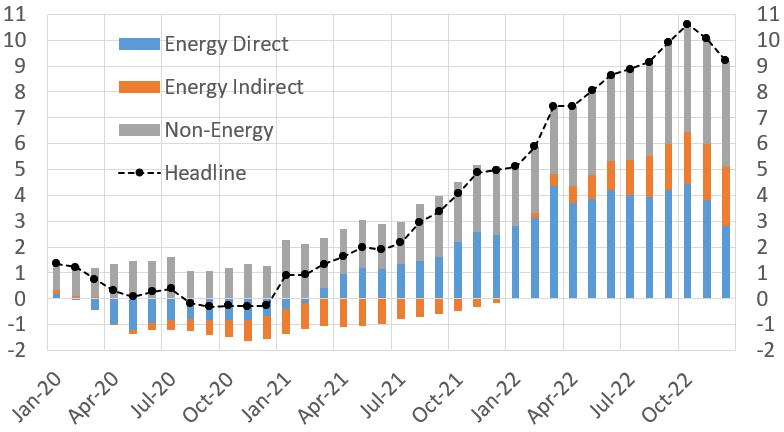
Source: authors’ calculations on Eurostat data. Note: the black solid line represents headline inflation, while the bars show the (direct and indirect) effects of energy components.
As for core inflation, the contribution of energy shocks accounts for about 1.5 p.p. of the 5.1 per cent value reached by core inflation; in the average of 2022, core inflation would have been 0.8 p.p. lower than the official figure (3.9 per cent) absent the energy shock. The results are qualitatively similar for food inflation, with energy shocks being responsible for roughly 5.5 p.p. out of the total 13.5 of food inflation in 2022Q4.
In a further exercise, we exploit a panel of consumer price indicators and use a dynamic factor and VAR
models (as in Conflitti and Luciani, 2019) to assess the different effects on core inflation coming from the shocks to oil and gas prices, which could in principle have a different transmission on non-energy prices. The model, which is estimated separately with oil and gas prices, allows us to distinguish between the direct (idiosyncratic) effect that each commodity price changes might have on each disaggregate price, and the indirect (common/macroeconomic) effect that the commodity price changes might have since they contribute to macroeconomic fluctuations. Overall, we find that the effects of a gas price shock are slightly more persistent. In 2022, gas prices would have explained roughly 0.3 p.p., on average, of common core inflation, while oil would have explained roughly 0.2 p.p.1 Also Alessandri and Gazzani (2023) find that core prices respond more to gas shocks than to oil shocks, and the response to a gas shock is somewhat more important in the medium term.
Using a structural VAR specification (estimated using quarterly data for inflation, inflation expectations, GDP and the policy rate), we have also studied the role of demand, supply and monetary policy shocks. The empirical evidence shows that inflation in 2021-2023 have been sustained by a sequence of supply and demand shocks. The ECB responded forcefully to these shocks and brought its monetary policy stance in contractionary territory in the second half of 2022. Overall, adverse shocks to energy prices and to aggregate supply played an important role in driving developments in inflation and economic activity in 2021 and 2022.
Finally, using a Phillips curve model with time-varying parameters, we investigate whether the exceptional nature of the energy shock implied a change in the pass-through to core inflation. The results indicate that in the latest part of the sample (2020-2022) the persistence parameter and the slope of the Phillips curve has broadly remained within the confidence bands constructed estimating the model up to 2019. By contrast, the estimated coefficient of energy prices has sharply increased (roughly doubling), suggesting a break in the relationship with core inflation; see Cavallo, Lippi and Miyahara (2023) for a model-based economic rationale for this break. We also document a rise in the time-varying intercept in core inflation (to values around 2%, compared with an historical average of about 1.4 per cent) which interestingly mirrors similar developments in inflation expectations based on experts’ opinion, e.g. in the ECB Survey of Professional Forecasters.
Figure 3 shows the estimated contribution of the different drivers of core inflation in this Philips curve setup. The sharp rise in 2022 is mostly accounted for by the energy price pressures and, to a minor extent by the underlying intercept, which can be rationalized as an inflation expectation term. The contribution of the economic slack has turned to positive although it remains modest.
Figure 3: Contribution of different drivers to core inflation developments (percentage point)
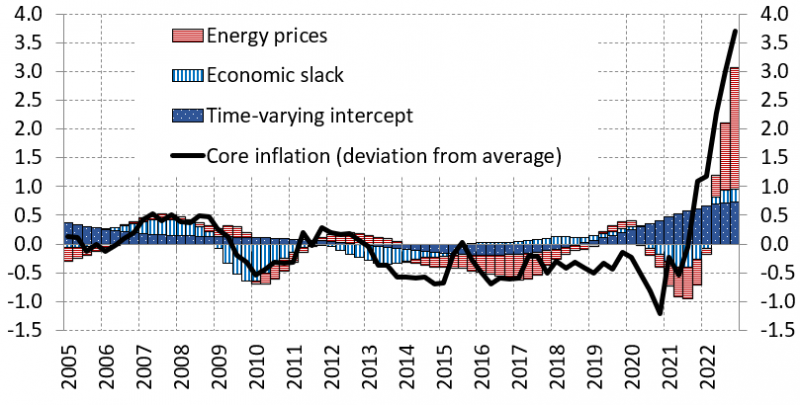
Notes: the figure shows the contribution of the different drivers of core inflation computed using the TV-PC. Both the data of core inflation and time-varying intercept are represented in deviation from the sample average of 1.4 per cent.
From a macroeconomic perspective, assessing the relative importance of supply vs. demand shocks in driving inflation is key to set the appropriate monetary policy stance. Contrary to the case of demand shocks, when the economy is hit by aggregate supply or energy price (cost-push) shocks, the central bank faces a tradeoff, as countering the impact on inflation would amplify the negative effects on economic activity. In such cases, the central bank could be more flexible and extend the horizon at which inflation is expected to reach the target, provided that long-term inflation expectations remain anchored and there is no risk of a wage-price spiral.
Looking forward, the impact of the large fall of energy prices from the peaks reached in 2022 and that of the unprecedented tightening of the ECB’s monetary policy should support the return of inflation to the 2 per cent symmetric target. The decrease of intermediate and energy costs will help firms to accommodate the expected recovery in real wages, in a context of slowing demand, without excessive pressures on their product prices.
Alessandri, P. and A. Gazzani (2023). “The impact of gas supply shocks in Europe”, VoxEU column, 25 July 2023, https://cepr.org/voxeu/columns/impact-gas-supply-shocks-europe.
Cavallo, A., F. Lippi and K. Miyahara, (2023). “Large shocks travel fast”, NBER Working paper 31659.
Conflitti, C. and M. Luciani, (2019). “Oil price pass-through into core inflation”, The Energy Journal, International Association for Energy Economics 40, 221-247.
Corsello, F. and A. Tagliabracci, (2023). “Assessing the pass-through of energy prices to inflation in the euro area”, Banca d’Italia Occasional paper 745.
Neri, S., F. Busetti, C. Conflitti, F. Corsello, D. Delle Monache and A. Tagliabracci, (2023). “Energy price shocks and inflation in the euro area”, Banca d’Italia Occasional paper 792.
The effect of all energy prices included in the HICP (e.g. electricity, gas, fuels, coal, solid fuels, heating energy etc.) contributes to roughly 0.8 p.p. to common core inflation in 2022.