The views expressed here are those of the authors and do not necessarily represent those of Banco de España, the Eurosystem, or Bloomberg.
This Policy Brief provides an analysis and discussion of the main characteristics and limitations of the climate mitigation scenarios co-developed by the Central Banks and Financial Regulators’ Network for Greening the Financial System (NGFS) for climate-financial risk assessment. Our analysis focuses on the following key elements: key uncertainties in NGFS scenarios; the role of Representative Concentration Pathways (RCPs) and Shared Socioeconomic Pathways (SSPs) in shaping the scenario narratives, and their shortcomings; the interpretation and sensitivities of carbon price pathways; the comparison of the results of process-based Integrated Assessment Models (IAM) across NGFS scenarios; and the comparison with other climate mitigation scenario providers (e.g. those of the International Energy Agency). Then, we draw lessons on how to increase the relevance of the NGFS scenarios for climate finance. Our recommendations include: (i) updating the SSP narratives by embedding finance and technology; (ii) considering the potential trade-offs between different types of climate policies; (iii) strengthening the assessment of physical risks and their compounding; (iv) integrating physical risks within transition scenarios; and, (v) embedding the role of investors’ expectations and climate sentiments in the scenarios’ trajectories.
Climate mitigation scenarios have become a relevant tool for climate financial risk assessment and climate stress-testing for investors, central banks and financial regulators. In this regard, the reference scenarios are those developed by the Central Banks and Financial Regulators’ Network for Greening the Financial System (NGFS) in partnership with an expert group of climate scientists and economists of the process-based Integrated Assessment Models (IAM) community (NGFS, 2021b). These scenarios provide future trajectories for economic activities, energy consumption and carbon capture technologies, considering the laws of physics, the carbon budget (i.e. the remaining Greenhouse Gases (GHG) that can be emitted before exceeding a certain target of temperature increase, e.g. the Paris Agreement’s “well below 2°C by 2100”), technological change and climate policies. The combinations of these factors lead to three groups of scenarios: “orderly” (early and credible introduction of carbon pricing), “disorderly” (late and sudden introduction of carbon pricing), and “hot house world” (current climate policies).
The NGFS scenarios provide a common reference for understanding how climate change and climate policy could evolve and are used by both financial authorities and financial institutions in their climate stress test exercises. Nevertheless, the understanding of the conceptual underpinnings, characteristics, applicability, and current limitations of NGFS scenarios is still limited. Our paper contributes to fill this gap. First, we discuss two key drivers of uncertainty, i.e. the Representative Concentration Pathways and Shared Socioeconomic Pathways, and the limitations of the socio-economic narratives of the reference scenarios. Second, we discuss the scenarios’ relation to process-based IAM, and the characteristics and current limitations of transition and physical risks in NGFS scenarios. Third, we highlight the differences between the NGFS transition scenarios and other relevant scenarios, such as those produced by the International Energy Agency and those published by the International Panel for Climate Change. Finally, we discuss the implications of current scenarios’ characteristics for the analysis of climate financial risks and opportunities, and we provide recommendations for improvement.
The key uncertainties in NGFS scenarios emerge from the Shared Socioeconomic Pathways (SSPs) and the Representative Concentration Pathways (RCPs)1. Jointly, SSPs and RCPs define the framework to explore future mitigation pathways by standardizing fundamental assumptions across climate scenarios.
The SSPs describe pathways of projected socioeconomic global changes up to 2100, including: sustainable development (SSP1), the middle-of-the road (SSP2), regional rivalry (SSP3), inequality (SSP4), and fossil–fuel led development (SSP5) (O’Neill et al. 2017; Riahi et al. 2017). In contrast, RCPs standardize the temperature outcomes estimated by process-based IAM and are measured in terms of radiative forcing levels.2 They are “representative” because each RCP provides only one of many possible scenarios that would lead to the specific radiative forcing characteristics captured by the RCP.
The SSPs complement the RCPs by defining the socioeconomic challenges to adaptation and mitigation given the specific climate change outcome specified through the RCP (Kriegler et al. 2012; O’Neill et al. 2014). Note, however, that SSP assumptions, which include projections for GDP and population, can have a considerable impact on transition and physical risks, because they inform projections of energy demand and countries’ ability to absorb adverse shocks. Moreover, modellers exercise discretion with regard to assumptions about technological development, and as a result, two scenarios that are built around the same SSP and RCP combination can yield very different results. This can be due, for instance, to differences in the projected deployment of Carbon Capture Utilization and Storage technologies (CCUS). In order to enhance comparability of scenarios, increased standardization of technological assumptions is needed.
SSPs and RCPs in the NGFS scenarios
The NGFS scenarios consider two RCPs (NGFS, 2021b):
All NGFS scenarios are based on SSP2, which assumes that society evolves broadly in line with past trends, global population peaks around 2070, and – when not accounting for the impacts from climate change – GDP would continue to grow in line with historical trends.
Limitations
The SSP narratives have limitations, including in their use by the NGFS, which have become increasingly relevant in the aftermath of recent geopolitical events:
Transition risk is represented by the introduction of carbon pricing aimed at internalizing negative externalities of GHG emissions such as damages to crops, human health or infrastructures. The carbon price can be interpreted as a proxy for the stringency of climate mitigation policies.
Carbon price and marginal abatement cost
Process-based IAM define the carbon price as the marginal abatement cost of an incremental tonne of GHG emissions, which implies that, when this cost is internalized by producers, it creates an incentive to mitigate GHG emissions. The marginal abatement cost curve is upward sloping, such that the easiest (i.e. the cheapest) opportunities to abate emissions are the ones that are addressed first. Sectors with relatively high marginal abatement costs will only be incentivized to decarbonize their production when the carbon price is high enough to match abatement costs. As a result, the pace of decarbonization differs across sectors. Indeed, if the marginal abatement cost is not high enough to incentivize emissions reduction in a given sector, but it is high enough to lead to financial losses, the sector may reduce its supply in order to restore profit margins. Hence, carbon prices and environmental regulation can have economic impacts through their impacts on production costs and prices, as well as on production volumes.
The climate ambition, policy timing and technology assumptions in each NGFS scenario determine how swiftly and by how much carbon prices need to increase. Marginal abatement costs differ across regions, with regional differences reflecting how advanced the region is in terms of abatement as well as the local cost and opportunities for deploying low-carbon technologies.
Physical risks are referred to as either chronic (i.e. persistent economic losses brought about by climate change, such as reduced labor and capital productivity and agricultural yields) and acute (i.e. the costs led by extreme weather events, which generally increase in frequency and magnitude as a result of climate change). In NGFS scenarios the macroeconomic impacts from chronic physical risk are derived with a damage function based on Kalkuhl and Wenz (2020) that establishes a relationship between climate variables (i.e. temperature and precipitation) and regional GDP and is used to inform the implications of higher temperatures for GDP losses. Importantly, these estimates are based on the historic relationship between temperature and GDP (using data at the subnational level for the years 1900–2014), and they primarily capture impacts on labor productivity, land productivity (i.e. agricultural yields) and depreciation of capital.
Regarding acute risks, the NGFS scenarios provide data on specific climate hazards at the subnational level based on (i) open access databases produced by the ISIMIP, which consider the impact of climate-related hazards on agricultural yields; and (ii) the CLIMADA disaster risk model, which considers the impact of river floods and tropical cyclones on the aggregate GDP of regions and countries.
Physical risks are most pronounced in the NGFS current policies scenario, which assumes that no further climate policies are implemented from 2020 – leading to a rise in global mean temperatures of circa 3°C by the end of the century relative to pre-industrial levels, with significant tail risk (i.e. the 95th percentile of warming is between 4.5°C-5°C).
Limitations:
Besides the NGFS scenarios, financial institutions and authorities sometimes draw on scenarios by the International Energy Agency (IEA) or IPCC for the purpose of climate scenario analysis.3,4 However, the key differences and similarities between these various “brands” of scenarios have not been analyzed so far. As such, it can be difficult to know which scenario to use, and to compare outcomes of scenario analyses from across these brands. Here we provide some initial points of comparison.
Table 1 summarizes the differences among brands in terms of audience, underlying models, and scope across transition risk, physical risk and macroeconomic variables. NGFS scenarios cover transition risk extensively but their coverage of physical risk is limited.
Table 1: A comparison of IPCC, NGFS and IEA scenarios by target audience, underlying models, and scopes
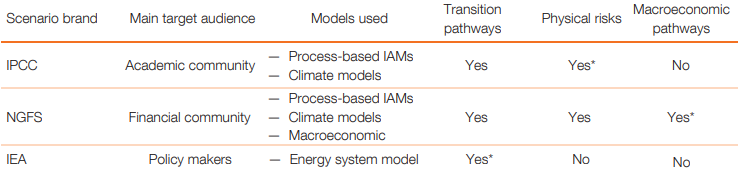
Source: Monasterolo et al. (2023), NGFS (2021a) and Huppmann et al. (2019). *Indicates the scenario brand with the highest granularity in a given category.
Despite these differences, the NGFS, IEA and IPCC scenario pathways often align fairly closely. Figure 1 shows results from the NGFS Net Zero 2050 (NZ2050) scenario alongside the IEA Net Zero Emissions by 2050 (NZE2050) scenario and the full distribution of results of the ‘1.5°C with no or limited overshoot’ scenarios used for the IPCC Special Report on 1.5°C (2018).
Final energy demand: the three IAM sit within the IPCC range, with GCAM and MESSAGEix-GLOBIOM projecting final energy demand in 2050 to be just below the IPCC median.
Solar and wind derived energy: in 2050, all three IAM project a high share for these renewables, implying that these technologies are assumed to be relatively cost-efficient in the NGFS scenarios.
Role of CCUS: projections are more varied, ranging from an extraction of about 4 Gigatonnes of CO2 through CCUS in 2050 in the MESSAGEix-GLOBIOM model (i.e. less than the 25th percentile given by the IPCC models), to about 11 Gigatonnes of CO2 in the GCAM model (i.e. more than the median). The IEA NZE2050 scenario sits centrally between the IAM results in terms of wind and solar derived energy and bioenergy. For CCUS, the IEA NZE2050 scenario sits just above the 25th percentile given by the IPCC and falls within the range provided by the NGFS
scenarios.
Figure 1: Comparison of the NGFS Net Zero 2050 scenario, the IEA NZE2050 and the projections for “1.5 degrees C with no or limited overshoot” used for the IPCC special report on 1.5°C, across selected variables
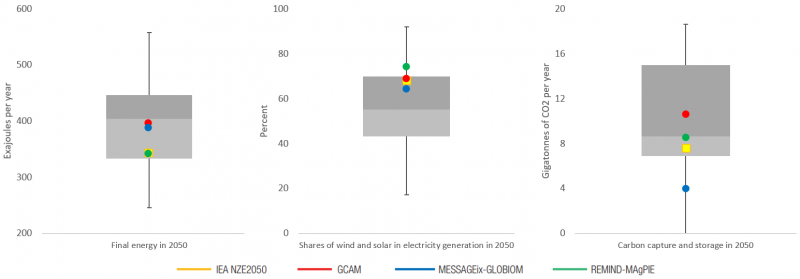
Source: Monasterolo et al. (2023).
Figure 2 compares the NGFS NZ2050 scenario and the IEA NZE2050 scenario with regard to the projections for the phasing out of fossil fuels.
Coal: the demand for coal rapidly declines across all three IAM and is virtually negligible by 2050 in the MESSAGEix-GLOBIOM and REMIND-MAgPIE projections. The IEA NZE2050 scenario sits between these projections.
Gas: a more gradual decline is projected than for coal. The IEA NZE2050 projects a higher demand for gas in the short term than the NGFS scenarios, but this is followed by a rapid decline from about 2030 onwards. REMIND-MAgPIE is the only IAM that projects a lower demand for gas than the IEA NZE2050 scenario across the full time horizon.
Oil: the IEA NZE2050 scenario projects an immediate and consistent decline in the demand for oil, while two of the IAM used by the NGFS (GCAM and REMIND-MAgPIE) assume that oil demand is stable in the short run and declines only from 2030 onwards. The MESSAGEix-GLOBIOM model, however, is roughly aligned with the IEA NZE2050 scenario in terms of its projection of oil demand.
Figure 2: Fossil fuels volumes in the NGFS Net Zero 2050 and in the IEA NZE2050 scenarios
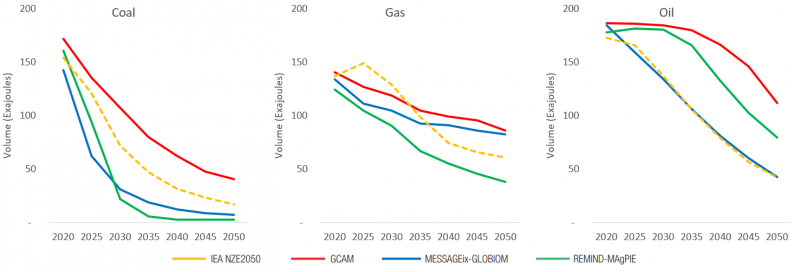
Source: NGFS 2021b, IEA (2021), authors’ own elaborations.
Our analysis identifies five ways to strengthen the development of climate mitigation scenarios for climate financial risk assessment:
Battiston S. Monasterolo, I., Riahi, K., and van Rujiven, B. (2021). Accounting for finance is key for climate mitigation pathways. Science, 372(6545), 918-920.
Huppmann, D., E. Kriegler, V. Krey, K. Riahi, J. Rogelj, K. Calvin, F. Humpenoeder, A. Popp and R. Zhang. (2019). IAMC 1.5°C Scenario Explorer and Data hosted by IIASA. Integrated Assessment Modeling Consortium & International Institute for Applied Systems Analysis.
Intergovernmental Panel on Climate Change. (2018). Global Warming of 1.5°C. https://www.ipcc.ch/sr15/.
International Energy Agency. (2021). Net Zero by 2050. https://www.iea.org/reports/net-zero-by-2050.
Kalkuhl, M., and L. Wenz. (2020). The impact of climate conditions on economic production. Evidence from a global panel of regions. Journal of Environmental Economics and Management, 103.
Kriegler, E., B. C. O’Neill, S. Hallegatte, T. Kram, R. J. Lempert, R. H. Moss and T. Wilbanks. (2012). The need for and use of socio-economic scenarios for climate change analysis: A new approach based on shared socio-economic pathways. Global Environmental Change, 22(4), pp. 807-822.
Monasterolo, I., Nieto, Maria J. and Schets, E. (2023). The Good, the Bad and the Hot House World: Conceptual Underpinnings of the NGFS Scenarios and Suggestions for Improvement. Banco de España Documento Ocasional No. 2302.
Network for Greening the Financial System. (2021a). NGFS Climate Scenarios Database: Technical Documentation V2.2.
Network for Greening the Financial System. (2021b). NGFS Climate Scenarios for central banks and supervisors.
O’Neill, B., C. E. Kriegler, K. L. Ebi, E. Kemp-Benedict, K. Riahi, D. S. Rothman, B. J. van Ruijven, D. P. van Vuuren, J. Birkmann, K. Kok, M. Levy and W. Solecki. (2017). The Roads Ahead: Narratives for Shared Socioeconomic Pathways describing World Futures in the 21st Century. Global Environmental Change, 42, pp. 169-180.
Ranger, N., Mahul, O., Monasterolo, I. (2022). Assessing Financial Risks from Physical Climate Shock: A Framework for Scenario Generation. The World Bank, Equitable Growth, Finance & Institutions Insight. Washington, DC: World Bank.
Riahi, K., D. P. van Vuuren, E Kriegler, J. Edmonds, B. C. O’Neill, S. Fujimori, N. Bauer, K. Calvin, R. Dellink, O. Fricko, W. Lutz, A. Popp, J. Crespo Cuaresma, S. KC, M. Leimbach, L. Jiang, T. Kram, S. Rao, J. Emmerling, K. Ebi, T. Hasegawa, P. Havlik, F. Humpenöder, L. Aleluia Da Silva, S. Smith, E. Stehfest, V. Bosetti, J. Eom, D. Gernaat, T. Masui, J. Rogelj, J. Strefler, L. Drouet, V. Krey, G. Luderer, M. Harmsen, K. Takahashi, L. Baumstark, J. C. Doelman, M. Kainuma, Z. Klimont, G. Marangoni, H. Lotze-Campen, M. Obersteiner, A. Tabeau and M. Tavoni. (2017). The Shared Socioeconomic Pathways and their energy, land use, and greenhouse gas emissions implications: An overview. Global Environmental Change, 42, pp. 153-168.
SSPs and RCPs are central in the scenario-based literature informing the Assessment Reports of the IPCC, including the current sixth assessment cycle (AR6).
Expressed in Watts per square metre, W/m2.
For example, the IEA Net Zero Emissions by 2050 scenario is mandated by the European Banking Authority as a benchmark for emissions reduction targets in the Final draft implementing technical standards on prudential disclosures on ESG risks in accordance with Article 449a CRR.
A third set of scenarios sometimes used in this context are the New Energy Outlook transition scenarios produced by BloombergNEF. These scenarios are similar in scope to those produced by the IEA and incorporate state-of-the-art modelling of key transition technologies such as solar energy, CCUS, etc. Due to the proprietary nature of these scenarios they are not included here.
See also Ranger et al. (2022).
See also Battiston et al. (2021).