
The views expressed represent the author’s personal opinions and do not necessarily reflect the views of the Deutsche Bundesbank or the Eurosystem.
Using data on the dynamic ownership structure of euro area equity mutual funds, we develop a framework to study how different investors contribute to the negative performance externality after large outflows. Intuitively, investors add to the externality based on their contribution to large outflows, while they absorb the externality proportionately to their fund ownership share. Our key finding is that investment funds, as holders of other funds, are the main source of the externality, whereas insurers and households are on the receiving end. We highlight marked differences in the fund trading behaviour both across retail and institutional investors, but also within the institutional segment. In particular, investment funds react more strongly on past performance and display a more pro-cyclical investment behaviour compared to households and insurers. Our results raise consumer protection and financial stability concerns due to the trading activity of short-term oriented investors.
Investors in open-ended mutual funds can redeem their shares on any given day at the fund’s closing net asset value. While this mechanism provides liquidity to redeeming fund investors, it may create a negative externality for investors remaining in the fund: when faced with large outflows, fund managers need to liquidate parts of their asset portfolios, which puts downward pressure on these assets’ market prices (e.g., Coval and Stafford, 2007; Manconi, Massa, and Yasuda, 2012; Antón and Polk, 2014; Fricke and Wilke, 2022). Since fund managers typically spread these portfolio adjustments over multiple business days following the redemption, the corresponding adjustment costs (trading costs and valuation losses) induced by redeeming investors are borne by those investors remaining in the fund (Jin, Kacperczyk, Kahraman, and Suntheim, 2021). Such flow-driven externalities give rise to first-mover advantages and run risks in mutual funds. Prior work provides robust evidence on the existence of such negative externalities from large outflows in mutual funds (Edelen, 1999; Chen, Goldstein, and Jiang, 2010; Goldstein, Jiang, and Ng, 2017).
This policy brief summarizes recent research (Fricke, Jank and Wilke, 2022), which assesses the sources and the receivers of the fund flow externality. To this end, we develop an empirical framework that reveals how much each investor sector contributes to and absorbs from the negative externality emanating from large outflows.
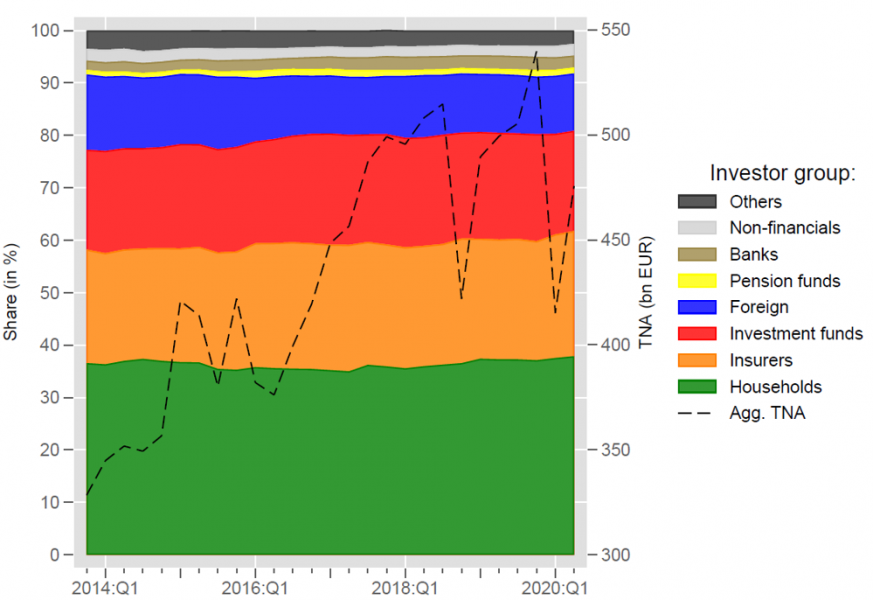
Figure 1: Mutual fund holdings by investor sector, over time.

Notes: Figure 1 shows the ownership composition of our sample mutual funds by investor sector, over time. The dashed line (corresponding to the right-hand y-axis) shows the aggregate TNA of funds in our sample. The sample period is 2013:Q4 until 2020:Q2.
Our analysis is based on a representative sample of euro area equity mutual funds over the years 2013-2020, including the COVID-19 crisis period in March 2020. Figure 1 shows the ownership composition of our sample funds by investor group over time. Households are the largest investor group, followed by insurers and investment funds. The dashed black line shows the aggregate total net assets (TNA) of the funds in our sample, which reflects the last decade’s substantial growth in the equity mutual fund segment and indicates that our sample funds issued fund shares worth about €500 bn at the end of the sample period.
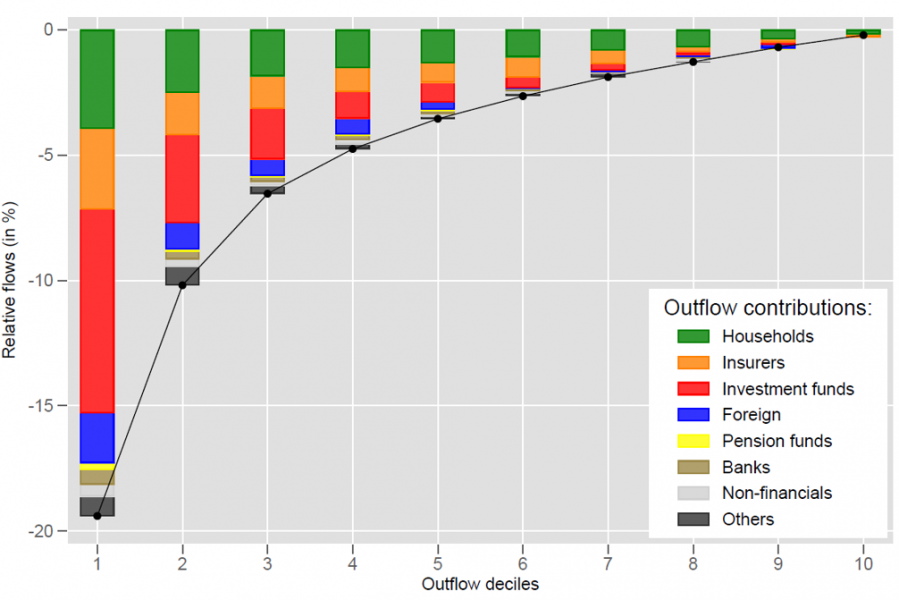
Figure 2: Outflow contributions by investor sector.

Notes: Figure 2 shows the contribution of each investor sector to our sample funds’ TNA-weighted outflows. Provided are deciles of the (relative) outflow distribution. The sample period is 2013:Q4 until 2020:Q2.
Having established that households, insurers and investment funds are the main investors in our sample funds, we look into who drives large outflows from these funds. In figure 2, we plot outflow deciles of our sample funds, decomposed by investor group. Due to their sheer size, households contribute most to small and medium size outflows (deciles 5 to 10). Strikingly however, the largest outflows (deciles 1 and 2) are disproportionally driven by investment funds (as investors in other mutual funds). This highlights substantial differences in fund trading behaviour – not only between retail and institutional investors but also within the segment of institutional investors (as insurers’ contribution to large outflows is small despite their substantial fund holdings).
Now that we know that investment funds tend to drive large outflows, does this mean that they must be the source of the flow externality for other investors? Not necessarily, as for this within-fund externality, the different investor groups must be invested in the same funds to negatively affect each other via their flows. In fact, assuming perfect segmentation (i.e., all investor groups are invested in different funds), they would create and receive losses only for themselves and their respective net externality (losses received minus losses created) would be zero.
Intuitively, how much a sector contributes to the within-fund externality is equal to its relative contribution to a fund’s large outflows. How much a sector absorbs of the same externality is equal to its relative holdings share after the outflows occurred.1 We define the net externality of a given investor sector as the difference between the externality received and the externality originated. Aggregated across all investor sectors, the net externality must be zero, but individual sectors can display non-zero values.
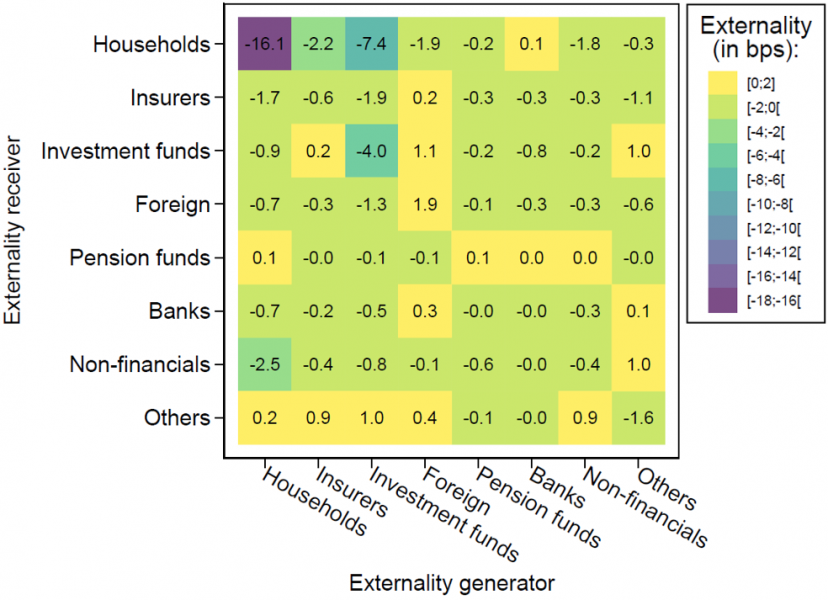
We quantify the net externality of different investor sectors in relatively illiquid equity mutual funds (small-/mid-cap holdings in the top 25% across the full sample) in the presence of large outflows (quarterly net outflows of at least 10%). For these funds, we estimate an economically sizeable flow externality of –45 basis points on their performance in the following quarter. Based on our framework, figure 3 displays the investor-sector specific component of these overall losses generated/received. We find that investment funds are the main drivers of the flow externality; the fund sector originates a flow externality of –15 bps and receives only –4 bps. This results in a net externality (received minus originated) of +11 bps of the investment fund sector.
Figure 3: Contagion between different investor groups in mutual funds.

Notes: Figure 3 decomposes the overall flow externality in mutual funds simultaneously by generator and receiver. The heatmap shows the contribution of different investor sectors (columns) to the externalities received by different investor sectors (rows). The decomposition is based on the overall flow externality which yields an estimated reduction in quarterly fund performance of -45 bps following outflows of more than 10% in the previous quarter for illiquid funds.
The main receivers of the flow externality are households and insurers. Representing the largest holder group, households originate –22 bps of the externality, but absorb –30 bps. Consequently, their net externality amounts to –8 bps. Our network analysis corroborates strong linkages between investment funds and households: more than 40% of the excess externality originating from investment funds is absorbed by the household sector. Interestingly, insurers, the second largest holder group, also tend to be at the receiving end of the flow externality. They originate only –3 bps of the externality, but receive –6 bps, which results in a net externality of –3. In relative terms, the amount of externality originated by insurers is only half of what would be expected given their economic size. Comparing insurers and investment funds also highlights important behavioural heterogeneities within the group of institutional investors: even though insurers and investment funds display roughly similar aggregate mutual fund holdings, investment funds’ contribution to the flow externality is about five times larger than the contribution of insurers (–15 bps versus –3 bps). This illustrates substantial behavioural heterogeneity across institutional sectors.
Our findings highlight negative effects arising from the trading activity of short-term institutional investors. The documented patterns are consistent with the existence of clientele effects in mutual funds and reveal potential contagion risks that can arise whenever different investor groups meet in the same fund. Additionally, we document striking differences in the trading behaviour across sectors. Investment funds – the main originators of the flow externality – are relatively short-term oriented investors, reshuffling their fund holdings very actively. Moreover, they exhibit a strong and concave flow-performance relationship. The investment fund sector displays particularly large redemptions during market distress periods, such as the COVID-19 market crash, when funds’ portfolio liquidity tends to be low and, hence, flow externalities tend to be large. In contrast, households and insurers – the main receivers of the flow externality – are more long-term oriented. Both sectors’ flow-performance relationship is weaker and convex in shape. They show considerably less cyclical flow behaviour and their outflows were limited even during the COVID-19 episode.
Taken together, our findings raise consumer protection and financial stability concerns regarding open-ended mutual funds. While their open-ended structure caters to the liquidity preferences of certain institutional investors, investors remaining in mutual funds when large outflows occur (involuntarily) provide this liquidity. Financial stability issues may arise when investment funds’ redemption patterns exert pressure on insurers’ fund investments, especially so during periods of distress. Hence, these results underline the need for integrated analyses of financial vulnerabilities across different sectors and echo recent findings that cross-fund investments may have a detrimental effect on financial stability (e.g., Fricke and Wilke, 2022). Lastly, our study shows that retail investors, in particular less financially sophisticated ones, involuntarily provide the liquidity absorbed by investment funds, highlighting potential consumer protection concerns.
Antón, M. and C. Polk (2014). Connected stocks. Journal of Finance 69, 1099–1127.
Chen, Q., I. Goldstein, and H. Jiang (2010). Payoff complementarities and financial fragility: Evidence from mutual fund outflows. Journal of Financial Economics 97, 239–262.
Coval, J. and E. Stafford (2007). Asset fire sales (and purchases) in equity markets. Journal of Financial Economics 86, 479–512.
Edelen, R. M. (1999). Investor flows and the assessed performance of open-end mutual funds. Journal of Financial Economics 53 (3), 439–466.
Fricke, D. and Jank, S. and Wilke, H. (2022). Who Creates and Who Bears Flow Externalities in Mutual Funds? Deutsche Bundesbank Discussion Paper No. 41/2022 (SSRN-Link: https://ssrn.com/abstract=4285852)
Fricke, D. and H. Wilke (2022). Connected Funds. (SSRN-Link: https://ssrn.com/abstract=3685223)
Goldstein, I., H. Jiang, and D. Ng (2017). Investor flows and fragility in corporate bond funds. Journal of Financial Economics 126 (3), 592–613.
Jin, D., M. T. Kacperczyk, B. Kahraman, and F. Suntheim (2021). Swing pricing and fragility in open-end mutual funds. Review of Financial Studies (forthcoming).
Manconi, A., M. Massa, and A. Yasuda (2012). The role of institutional investors in propagating the crisis of 2007–2008. Journal of Financial Economics 104 (3), 491–518.
To assess whether an investor sector – on net – originates or receives the flow externality over and beyond what is to be expected given its relative size, we also compare it against a simple null hypothesis of uniform flow behaviour across all investor sectors. If all sectors redeemed their fund shares proportional to their holdings, the net externality of each sector, defined as the difference between the externality received and the externality originated, is zero. We test the estimated net externality of each investor sector against this null hypothesis.