menu
close

Author(s):

Carlos Moreno Pérez | Pablo de Olavide University
Marco Minozzo | University of Verona

Keywords:

COVID-19 , EGARCH , Latent Dirichlet Allocation , Investor attention , Uncertainty indices , Word Embedding

JEL Codes:

C45 , C58 , D81 , G15

The material presented here is based on “Moreno Pe rez, C., Minozzo, M. (2022). Natural language processing and financial markets: semi-supervised modelling of coronavirus and economic news. Documentos de Trabajo, Banco de España, 2228.” The opinions and analyses in this Policy Brief are the responsibility of the authors and, therefore, do not necessarily coincide with those of the Banco de España or the Eurosystem.

This paper investigates the reactions of US financial markets to press news from January 2019 to 1 May 2020. To this end, we deduce the content (topic) and sentiment (uncertainty) of the news by developing apposite indices from the headlines and snippets of The New York Times, using unsupervised machine learning techniques. In particular, we arrive at the definition of a set of daily topic-specific uncertainty indices. These indices are then used to find explanations for the behaviour of the US financial markets. In substance, we find that two topic-specific uncertainty indices, one related to COVID-19 news and the other to trade war news, explain the bulk of the movements in the financial markets from the beginning of 2019 to end-April 2020. Moreover, we see that the volatility of the returns of the S&P 500 is positively affected by an increase in the ‘coronavirus’ and ‘trade war’ uncertainty indices.

Introduction

During 2019, US financial markets rose steadily despite the growing concern about a possible trade war between the US and China, and a non-deal Brexit. At the beginning of 2020, in particular on 19 February 2020, the S&P 500 index reached an historic peak. Then, the spread of COVID-19 in European countries and in Asia led to a memorable collapse of the financial markets, followed by a quick recovery due to the interventions of the Fed and of the US government’s fiscal packages.
To investigate the relationship between financial markets and newspaper articles, in a recent paper (Moreno Pérez and Minozzo, 2022), we create text measures to quantify the content and sentiment (uncertainty) of US news, related in particular to COVID-19 pandemic and trade war, using unsupervised machine learning algorithms. We construct these measures from the headlines and snippets of articles in the English version of The New York Times from 2 January 2019 to 1 May 2020. To complete the analysis, we investigate, using an EGARCH model, the relationship between these topic-specific uncertainty indices and the returns of several US financial indices.

Topic and sentiment analysis of newspaper text data

To extract the topics (the subjects, the themes) of the articles, we use Latent Dirichlet Allocation (LDA), an unsupervised machine learning technique introduced by Blei, Ng and Jordan (2003) for text mining. The power of LDA resides in its ability to automatically identify the topics in the articles without the need of human intervention, that is, without the need to read them by an experienced reader. LDA assumes that each document, which is a newspaper article in our case (or, more precisely, the headline and the snippet of the article), is made up of various words, and that the set of all documents form what we call the corpus. Actually, to carry out our analysis, the words in the newspaper are stemmed to their base root. For instance, the words ‘inflationary’, ‘inflation’, ‘consolidate’ and ‘consolidating’ are converted into their stems, which are ‘inflat’ and ‘consolid’, respectively. In this setting, topics are latent (non observable) probability distributions over words (stems), and words with the highest weights are normally used to assign meaningful names to the topics. Of course, this somehow subjective labelling of the topics does not affect in any way the analysis and is used to help in the interpretation of the results. LDA supplies the most probable topics related to each article.
Table 1 shows for each of the 5 topics of interest in our analysis (out of a total of 60 topics) the first eight words (stems) with the highest (posterior) probability. That is, for each topic, word 1 is the word (stem) with the highest probability in that topic, word 2 is the word (stem) with the second highest probability in that topic, and so on. On the basis of the probability distribution of words in a topic, we are able to somehow interpret it and then to assign it a tag. For instance, we assigned the tag ‘coronavirus’ to topic 29 since, for this topic, the words (stems) with the highest probability are ‘coronaviru’, which has a probability of 0.217, ‘test’, which has a probability of 0.057, ‘pandem’, which has a probability of 0.053, and ‘viru’, which has a probability of 0.051.
Table 1: Topic descriptions for the LDA analysis. The table shows the first eight words (stems) with the highest (posterior) probability for each of the five selected topics. 
 width=
In addition to the above probability distributions of words characterizing each topic, the LDA analysis also provides the topic distribution for each document in the corpus, that is, it supplies the most probable topics associated with each article of The New York Times. These distributions will be used to obtain the daily distributions of topics over the period under scrutiny.
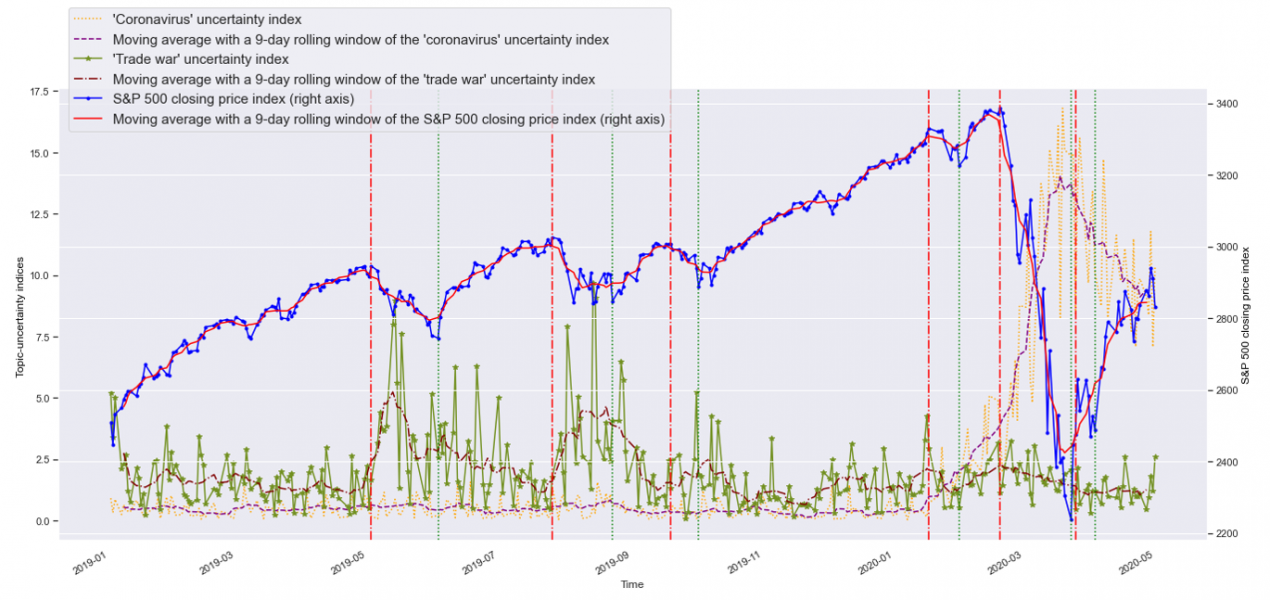
To create uncertainty measures, we resort to Word Embedding (using the Skip-gram model) introduced by Mikolov et al. (2013) and K-Means following Soto (2021). With these, we come out with a list of words having a meaning similar to the word ‘uncertainty’. Actually, we consider in this list all the words that are in the same clusters of the words ‘uncertain’, ‘uncertainty’, ‘fears’, ‘fears’ and ‘worries’, since they share a similar semantic meaning. This list is then used as an uncertainty dictionary to construct a daily uncertainty index by counting the frequency of its words present in all the articles of a given day. To create topic-specific uncertainty indices, we then combine the daily LDA probabilities of each topic with the uncertainty index obtained with Word Embedding and K-Means. In this way, we come out with uncertainty indices for specific topics such as, in particular, ‘coronavirus’, ‘trade war’, ‘climate change’, ‘economic-Fed’ and ‘Brexit’. Figure 1 shows the evolution of two topic-specific uncertainty indices, specifically of the ‘coronavirus’ and ‘trade war’ uncertainty indices.
Figure 1: Temporal evolution of the ‘coronavirus’ and ‘trade war’ uncertainty indices. 
  width=
Notes: The yellow line represents the ‘coronavirus’ uncertainty index; the purple line is the moving average with a 9-day rolling window. The green line represents the ‘trade war’ uncertainty index; the brown line is the moving average with a 9-day rolling window. The blue line represents the S&P 500 closing price index; the red line is the moving average with a 9-day rolling window. The vertical dash-dotted red lines indicate some of the local maxima of the S&P 500 closing price index, whereas the vertical dotted green lines represent some of the local minima of the S&P 500 closing price index. 
From these behaviours it is immediate to notice that the peaks of the ‘trade war’ uncertainty index during 2019 correspond to drops in the S&P 500 closing price index, whereas the huge increase of the ‘coronavirus’ uncertainty index in the first months of 2020 corresponds to an historic drop in the S&P 500 index.

Uncertainty in news and in financial markets

To quantify how much of the behaviour of the S&P 500 index can be explained by uncertainty in the news, we estimated an EGARCH(1,1) model for each of our five topic-specific uncertainty indices. We verify that the ‘coronavirus’ and ‘trade war’ uncertainty indices are negatively associated with the mean, and positively associated with the volatility, of the returns of the S&P 500. Also, we find that the ‘climate change’ and ‘economic-Fed’ uncertainty indices are negatively and positively, respectively, associated with the mean of the S&P 500 returns. This suggests that news about economic measures of the Fed and the US government has a positive effect on the S&P 500 in days of uncertainty. Overall, we can argue that the ‘trade war’ uncertainty index explains much of the behavior of the S&P 500 returns during 2019, whereas the ‘coronavirus’ uncertainty index explains most of the movements of the S&P 500 index during the first four months of 2020.
To further investigate how much these two uncertainty indices explain the behaviour of the US financial markets, we estimated, using these two indices as explanatory variables, some other EGARCH(1,1) models, one for each of the following financial indices (as dependent variable): the S&P 500, the Nasdaq, the Dow Jones, the VIX and the US 10-year Treasury bond yields. As expected, we see that both the ‘coronavirus’ and ‘trade war’ uncertainty indices have a negative effect on the mean, and a positive effect on the volatility, of the returns of the S&P 500. In particular, we notice that an increase in the ‘trade war’ uncertainty index has a greater negative effect on the mean returns of the S&P 500 than an increase in the ‘coronavirus’ uncertainty index. Let us also observe that the ‘coronavirus’ uncertainty index has a negative effect on the mean returns of the Nasdaq, but not on that of the Dow Jones, and vice-versa for the ‘trade war’ uncertainty index. Moreover, we see that the mean returns of the VIX is positively affected by the ‘coronavirus’ and ‘trade war’ uncertainty indices. Lastly, as far as the 10-year US Treasury bond yields are concerned, the results show that an increase in the ‘coronavirus’ and ‘trade war’ uncertainty indices leads to a decrease in their mean returns. In line with common opinion, we can reasonably argue that investors may see US bonds as a safe refuge during periods of high uncertainty.

Conclusions

We use unsupervised machine learning techniques to construct text measures able to explain recent past movements in US financial markets. Our raw text data are the headlines and snippets of the articles of The New York Times from 2 January 2019 to 1 May 2020. We first use LDA to infer the content (topics) of the articles and to obtain daily indices on the presence of these topics in The New York Times. Then we use Word Embedding (implemented with the Skip-gram model) and K-Means to construct a daily uncertainty measure, that we combine with the previous indices to obtain daily topic-specific uncertainty indices. In particular, we obtain five uncertainty indices related to news about ‘coronavirus’, ‘trade war’, ‘Brexit’, ‘economic-Fed’ and ‘climate change’, capturing the daily degree of uncertainty in these topics.
These indices are then used to find explanations for the behaviour of the US financial markets by implementing a batch of EGARCH models. Overall, we can argue that the ‘trade war’ uncertainty index explains much of the behavior of the S&P 500 returns during 2019, whereas the ‘coronavirus’ uncertainty index explains most of the movements of the S&P 500 index during the first four months of 2020.
From a methodological point of view, we might also explore the use of other machine learning methods for the construction of text measures, such as Dynamic Topic Models (Blei and Lafferty, 2006) and Support Vector Machines. Similarly, more sophisticated GARCH-MIDAS models could be used to incorporate, as explanatory variables, macroeconomic and other variables sampled at different frequency.

References

Blei, D.M., Lafferty, J.D. (2006). Dynamic topic models. In ICML ’06: Proceedings of the 23rd International Conference on Machine Learning, p. 113–120, https://doi.org/10.1145/1143844.1143859
Blei, D.M., Ng, A.Y., Jordan, M.I. (2003). Latent Dirichlet Allocation. The Journal of Machine Learning Research 3:993–1022. https://dl.acm.org/doi/10.5555/944919.944937
Mikolov, .T, Chen, K., Corrado, G., et al. (2013). Efficient estimation of word representations in vector space. arXiv preprint arXiv: 1301.3781. https://arxiv.org/abs/1301.3781
Moreno Pérez, C., Minozzo, M. (2022). Natural language processing and financial markets: semi-supervised modelling of coronavirus and economic news. Documentos de Trabajo, Banco de España, 2228. https://repositorio.bde.es/handle/123456789/22926?locale=en
Soto, P.E. (2021). Breaking the word bank: measurement and effects of bank level uncertainty. Journal of Financial Services Research 59(1):1–45. https://doi.org/10.1007/s10693-020-00338-5

About the authors

Carlos Moreno Pérez

Carlos Moreno Pérez is a Postdoctoral Researcher at the Pablo de Olavide University (Spain). Previously, he worked as a Research Assistant at the Bank of Spain in the ‘European and Global Policies Unit’. He received a Ph.D. in Economics at the University of Verona, completed the Advanced Studies Program in International Economic Policy Research at the Kiel Institute for the World Economy, and holds a M.Sc. in International Economics from the Autonomous University of Madrid and a B.Sc. in Economics from the University of Seville.

Marco Minozzo

Marco Minozzo is associate professor of Statistics at the University of Verona. He was previously Researcher in Statistics at the University of Perugia. He earned a degree in Statistics and Economics from the University of Padova and received a Ph.D. in Statistics from University College London. He is the President of the Bachelor’s Degree in Economics and Business of the University of Verona.

More on these topics

Tags: