This policy brief is based on Banco de España, Documentos de Trabajo N.º 2542. The views expressed are those of the author and not necessarily those of the institutions the author is affiliated with.
Abstract
We study how major natural disasters affect regional economies using weekly data for U.S. states over the past forty years. We find that large, unexpected events trigger an immediate but temporary drop in economic activity that appears in the first week and mostly fades within a year, driven by disruptions to mobility, spending, exports, sentiment and local labour markets, while inflation barely moves and national aggregates remain largely unaffected. The size and persistence of these downturns scale with the initial severity of the disaster. Crucially, states with wider property insurance coverage experience smaller losses and faster recoveries, highlighting the key role of insurance in cushioning local economies.
Most of the existing literature on the economic impact of natural disasters has relied on either cross-country comparisons or low-frequency data, which makes it difficult to capture the short-run dynamics and regional heterogeneity of these events. Moreover, when these effects are temporary and localized, aggregating across time and geography can easily mask their true impact. In this paper, we combine regional, high-frequency data for U.S. states over the past forty years with detailed information on natural disasters to trace their effects on economic activity and inflation.
Figure 1. Dynamic Response of Economic Activity to a Natural Disaster
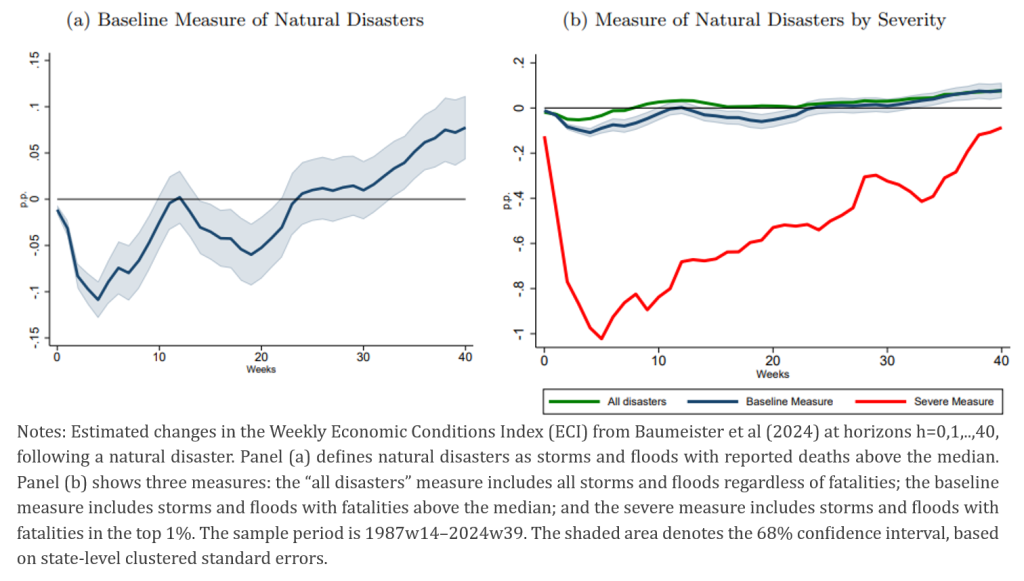
Panel (a) of Figure 1 shows how weekly economic conditions evolve in a state after a typical natural disaster. On average, activity weakens immediately and reaches its lowest point about four weeks after the event. The economy then grows more slowly for a period, but gradually returns to its pre-disaster average growth rate within five or six months. When we cumulate these weekly changes, the level of activity returns to its pre-disaster path within about a year, indicating that most disasters leave a clear but temporary impact rather than a permanent scar.
Panel (b) of Figure 1 shows that this impact varies widely with disaster severity. When we consider all storms and floods, including relatively minor events, the decline in activity is smaller and fades within a few months. By contrast, the most extreme disasters—those in the top 1% by fatalities—generate much larger and more persistent disruptions.
Overall, the message is that regional effects are usually short-lived but can be very large for severe events—and that high-frequency regional data are essential to capture these dynamics.
These results underscore why high-frequency regional data is crucial for identifying the impact of natural disasters. The downturn in activity unfolds over a few months and largely dissipates within a year, so analyses based on annual or low-frequency data would tend to smooth out much of the short-run damage and understate both the depth and the timing of the economic costs.
Figure 2. Dynamic Response of Labor Market, New Business Applications, Household Spending, and Mobility to Natural Disasters
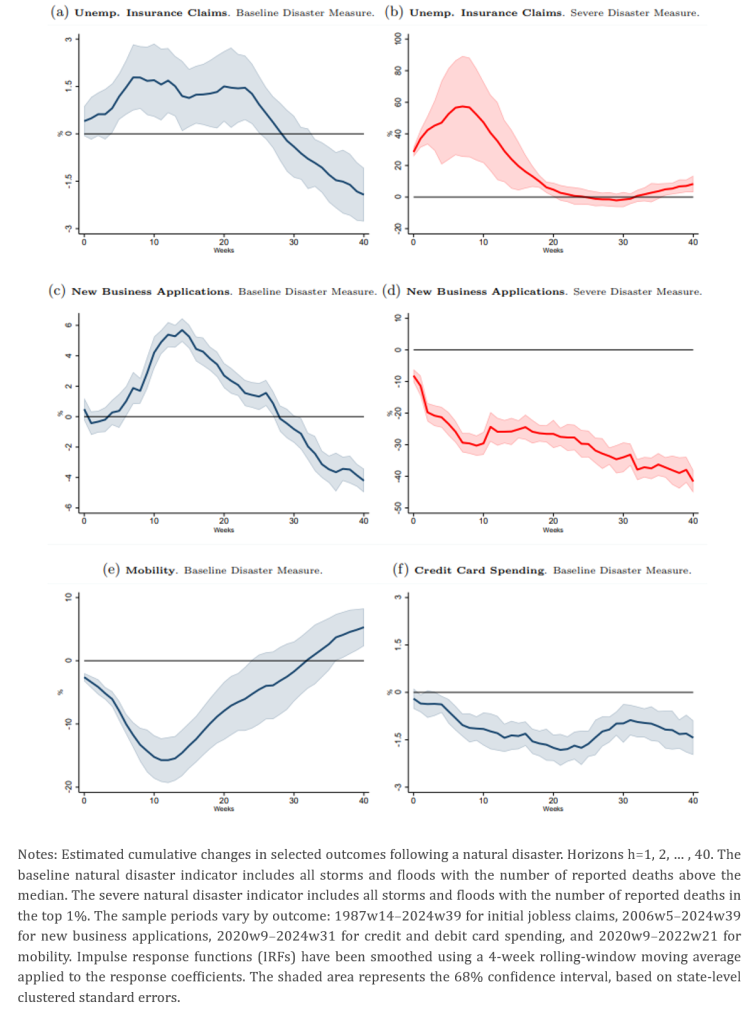
Figure 3. Dynamic Response of Exports and Manufacturing Sentiment to Natural Disasters
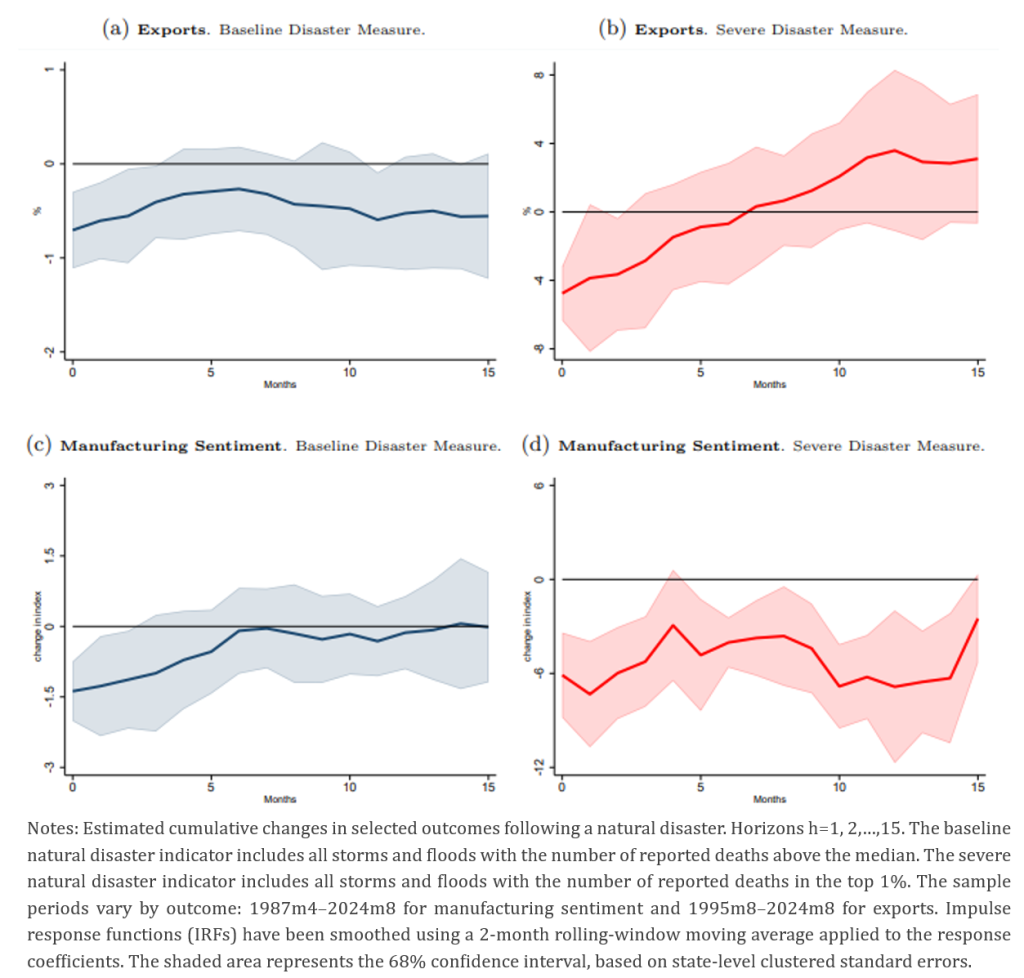
Figures 2 and 3 show that natural disasters disrupt several key parts of regional economies, and that the scale of the event matters a lot. In the labour market, typical disasters are followed by only a modest, short-lived increase in unemployment claims, whereas the most severe events trigger much larger—though still temporary—spikes in job losses. After typical disasters, new business applications are largely unaffected, while mobility, exports, and manufacturing sentiment decline but tend to recover relatively quickly. Severe disasters, however, lead to a pronounced and persistent drop in new firm creation and a more prolonged weakening of exports and manufacturing sentiment.
Household spending also falls after disasters and tends to remain subdued for longer than other economic indicators, suggesting that affected households become more cautious in their consumption even after broader activity begins to normalise.
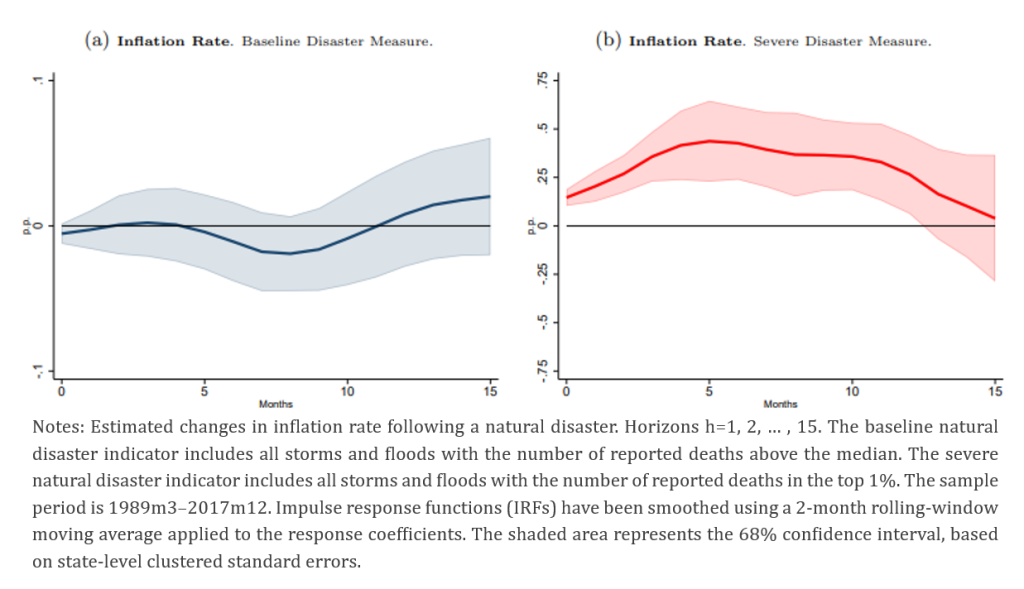
Figure 4 shows that, by contrast, the overall impact on prices is generally muted. For most disasters, we observe clear negative effects on activity—through weaker spending, investment, exports and confidence—yet inflation barely moves, and estimated changes are small and statistically uncertain. This pattern is consistent with natural disasters operating as a mix of demand and supply shocks: they depress demand while simultaneously disrupting production and supply chains, so their effects on prices largely offset one another. Only in the most extreme events do we see a different picture, with severe disasters followed by a noticeable and more persistent increase in inflation, suggesting that supply-side pressures dominate when destruction is very large.
Overall, natural disasters mainly show up in quantities while their effects on inflation remain muted except in truly catastrophic cases.
Figure 4. Dynamic Response of Inflation Rate to Natural Disasters
Panels (a) and (b) of Figure 5 show that most natural disasters leave barely any mark on aggregate U.S. economic activity. When we use a national indicator that turns on whenever at least one qualifying disaster occurs anywhere in the country, the estimated effects on weekly U.S. activity are very small and statistically weak at all horizons. This muted reaction reflects the fact that a typical disaster only hits a limited set of states, while activity in the rest of the country continues largely unaffected and offsets the local losses.
Instead, when we focus on disasters hitting one of the four largest states, or on unusually widespread events that affect a large majority of states at once, we find a temporary decline in national activity in the weeks immediately following the disaster, followed by a recovery that takes roughly 20 to 30 weeks.
These results highlight how easily the economic impact of natural disasters can be missed when looking only at national data. Disasters are highly localized and, as our state-level analysis shows, their effects unfold over a few months and mostly fade within a year. When these short-lived, regional disruptions are averaged together at the national level, they largely wash out and become hard to detect. High-frequency, disaggregated regional data are therefore essential to measure the true economic cost of natural disasters and to design policies that respond to where the damage actually occurs.
Figure 5. Dynamic Response of US Economic Activity to a Natural Disaster
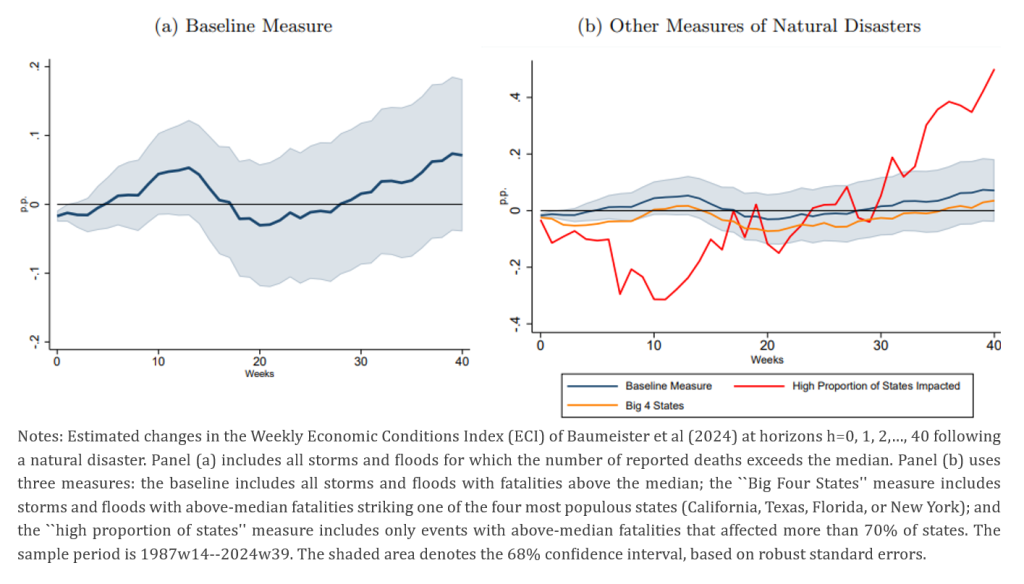
Figure 6 shows that the economic impact of natural disasters depends crucially on how well insured a state is before the shock hits. When property insurance coverage per capita is above the median in the week prior to a disaster, the negative effect of each additional disaster-related death on economic activity is clearly dampened: downturns are smaller and recoveries are faster. By contrast, in states with below-median insurance coverage, the same disaster leads to a larger and more persistent deterioration in local economic conditions. Taken together, these results suggest that property insurance acts as an important buffer against the economic fallout of natural disasters.
Figure 6. Dynamic Response of Weekly Economic Activity to Natural Disasters: The Role of Property Insurance Coverage
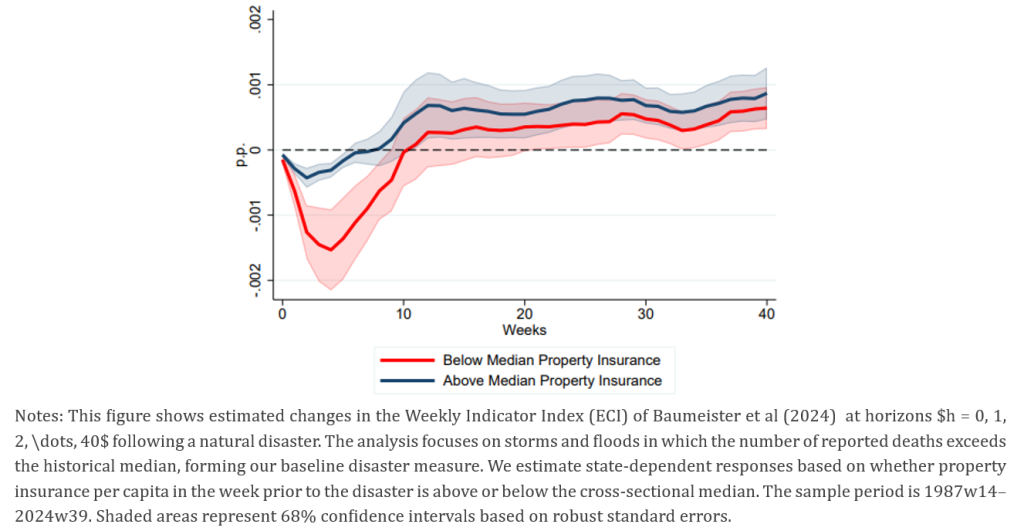
Natural disasters cause clear but temporary declines in regional economic activity. Using high-frequency data on U.S. states, we show that large, plausibly unexpected events trigger downturns that fade within about a year. The size and duration of these downturns depend strongly on disaster severity and operate mainly through short-run disruptions to mobility, manufacturing sentiment, household spending, and labour markets, while inflation barely reacts. Property insurance plays a central cushioning role. States with higher pre-disaster insurance coverage experience noticeably milder and shorter downturns, highlighting insurance as a key financial buffer.
Baumeister, Christiane, Danilo Leiva-León and Eric Sims. (2024). “Tracking weekly state-level economic conditions”. The Review of Economics and Statistics, 106(2), pp. 483-504.