The second ECB economy-wide climate stress test assesses the short- to medium-term impact of three potential net-zero transition pathways on the euro area economy and financial system. It provides a comprehensive analysis on investment needs, economic costs and financial risks for corporates, households and financial institutions, using a granular dataset that combines climate, energy-related and financial information for millions of firms within the euro area credit and securities register, and country-level data on households. The results of the exercise show that acting immediately and decisively would provide significant benefits by limiting financial risk and by maintaining the optimal net-zero emissions pathway, therefore reducing the future impact of climate change. An accelerated transition would not generate financial stability concerns, provided that the financial system supports the realization of green investments. However, the heterogeneous results across economic sectors and banks suggest the need for a more careful monitoring of certain entities and subsets of exposures.
We have designed a new climate stress test exercise to study the short- to medium-term vulnerabilities of the euro area economy and financial system to three potential net-zero transition pathways. Leveraging the framework developed for the first ECB economy-wide climate stress test (Alogoskoufis et al., 2021), this exercise contributes to the literature on climate stress testing by i) designing three plausible short-term transition risk scenarios that account for recent euro area macroeconomic and energy-related developments, particularly the increase in energy prices triggered by Russia’s invasion of Ukraine, based on the latest macroeconomic projections and the climate scenarios of the Network for Greening the Financial System (NGFS, 2022); ii) developing new climate risk models that incorporate granular developments in the European energy sector; and iii) a granular and bottom-up calculation of green investments needed for the euro area to successfully transition towards net-zero emissions.
We developed three novel scenarios to assess the impact of the green transition. The scenarios differ in the timing and ambition of transitioning towards net-zero emissions (Chart 1, panel a). The “accelerated transition” scenario assumes a jumpstart of the transition with rapid and severe increases in energy prices. Investments in renewable energy sources and carbon mitigation activities in the short term lead to a reduction in emissions by 2030. This would be compatible with the long-term temperature targets of the Paris Agreement (+1.5°C increase relative to pre-industrial levels). In the other two scenarios, current macroeconomic and geopolitical conditions lead to a delay in green transition efforts until the end of 2025. In the “late-push transition” scenario, the green transition starts in 2026 and is intense enough to achieve emission reductions by 2030. The expected results are comparable to those in the accelerated transition, but they come at a higher cost, as the policies needed to achieve them are more ambitious and abrupt. In the “delayed transition” scenario, the transition also starts in 2026 but is more gradual and slower than in the late-push transition. It is therefore not ambitious enough to achieve emission targets in line with the Paris Agreement goals by 2030.
Small changes in the timing and ambition of the green transition in the short-term lead to substantial differences in terms of temperature increase until 2050. It is only under the accelerated and late-push transition scenario that emissions reductions would be on a path to limit temperature increases to +1.5°C by the end of the century (Chart 1, panel b). The delayed transition scenario has a less ambitious decrease in aggregate GHG emissions, implying slower technological changes and milder policies compared with the accelerated and late-push transitions. This scenario brings the economy onto the same track as under the NGFS Nationally Determined Contributions (NDCs) scenario, under which only energy and emissions targets currently pledged would be pursued and reached in all countries. If global climate policy action were to mirror that of the EU,1 the impact of long-term temperature increases and physical risks under the delayed transition scenario would be much more severe compared with the accelerated and late-push transition scenarios.
Chart 1: The three green transition scenarios
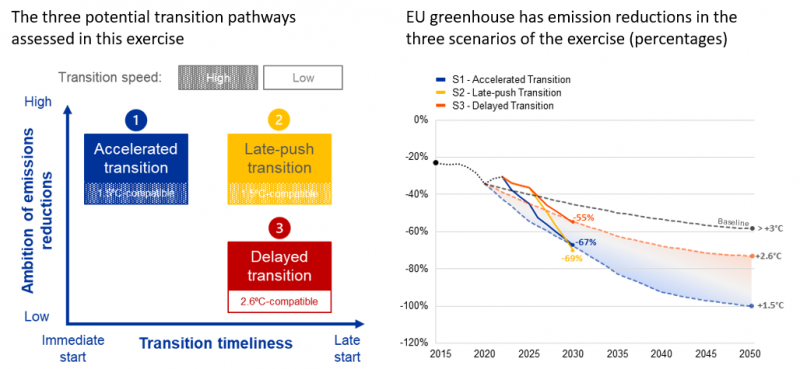
Source: ECB calculation based on Orbis, Urgentem, Eurostat, NGFS and International Renewable Energy Agency (IRENA; 2021). Notes: In panel b, historical aggregated data on emissions are provided by the European Environment Agency and are available until 2020. Quarterly emissions data for 2021 and 2022 are taken from Eurostat and aggregated at yearly frequency to complete the timeseries. Temperature increases refer to the year 2100. Emission pathways until 2050 correspond to the NGFS’s Net Zero 2050 (+1.5°C), the nationally determined contributions (NDC) scenario (+2.6°C) and current policy scenario (>+3°C).
During the transition, energy consumption would shift from carbon-intensive sources to electricity and renewable sources. Firms with a high consumption of fossil fuels are incentivized to green their energy mix to reduce their exposure to carbon prices and to short-term shocks in gas and oil markets. The greening of the aggregate euro area energy mix is largely driven by the reduction of firms’ Scope 2 emissions2 through higher consumption of renewable-based electricity (Chart 2, panel a). By 2030 electricity would represent around 42% of the energy mix of final consumers under the accelerated and late-push transition scenario, of which 70% would be generated from renewables. Under the delayed transition, the share of electricity in the energy mix would remain constant, with only 54% being generated from renewables until 2030. In addition, the share of renewables directly consumed by non-energy sectors, such as solar and wind, would increase between 2022 and 2030 by up to 20 percentage points in the accelerated and late-push transition and by 15 percentage points in the delayed transition.
The accelerated and late-push transition scenarios would generate the largest green investments due to their more ambitious emission targets and more favourable investment costs.3 While green investments enable firms to reduce their carbon footprint and be less exposed to rising carbon prices and shocks in gas and oil prices, it increases their indebtedness in the short- to medium-term. Based on bottom-up estimates, an accelerated or late-push transition would require companies and households to invest significant funds from the very start of the transition, with green investment adding up to around €3 trillion by 2030 (Chart 2, panel b). Under the delayed transition, the reduced efforts made until 2030 would result in a smaller increase in the funds needed. However, emission reductions would be lower and accompanied by heightened physical risk in the long-term owing to the failure to meet the net-zero target of the Paris Agreement.
Chart 2: Energy mix developments and green investments required in the three transition scenarios
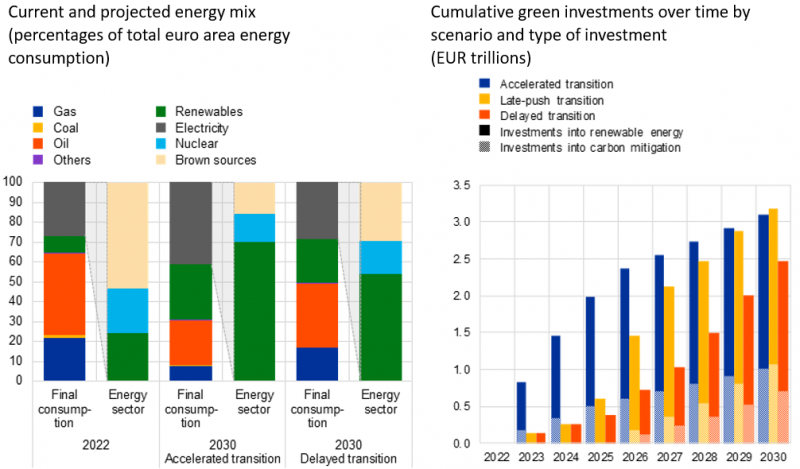
Source: ECB calculation based on Orbis, Urgentem, Eurostat, NGFS and International Renewable Energy Agency (IRENA; 2021). Notes: In panel a, brown sources for the energy sector include gas, coal and oil. In panel b, green investment consists of investment in: i) renewable-based energy, and ii) carbon mitigation activities. Cumulated green investment is based on bottom-up estimates for the 2.9 million European non-financial corporations covered in the climate stress test exercise.
The transition impact would be most severe under the late-push scenario and largely heterogeneous across sectors, with the strongest increases in credit risk being experienced in the electricity, mining and manufacturing sectors. The impact of the green transition on firms’ profitability and leverage was combined to project their credit risk until 2030. Firms’ probabilities of default (PDs) would increase due to higher energy expenses and lower profits from energy price shocks, and due to higher indebtedness from green investments. The largest increase in sector-level PDs until 2030 would be seen in the mining and manufacturing sectors, where the increase in the median firm PD is double as high as the increase in the median PDs across all sectors (Chart 3, panel a). Looking at the tails of the mining and manufacturing sectors, the 75th percentile increase in corporate PDs would be around two to three times higher than for the median firm within these sectors.
Banks’ credit risk would increase in the transition process and banks exposed to more vulnerable firms would be disproportionately more affected. The aggregate PDs of corporate loan portfolios would rise higher at the start of the transition period under the accelerated transition scenario but would be outpaced from 2026 onwards under the late-push transition scenario (Chart 3, panel b). The increase would be higher for significant institutions compared with other banks due to lower collateral coverage and the relatively larger share of exposure to energy-intensive sectors.4 Credit risk would start to recover in the second half of the time horizon under the accelerated and late-push transition scenarios given that the peak of the transition would have been reached by then. In contrast, under the delayed transition scenario there would be a continuous increase in credit risk until 2030. This would be expected to impose additional credit risk for banks after 2030 given the lower emissions reductions until 2050 under that scenario, resulting in higher long-term temperature increases and greater physical risk. In addition, PDs would not yet have started recovering by 2030 under the delayed transition scenario. Transition risk, and thus credit risk, would be expected to continue to increase after 2030 under a delayed transition scenario.
Chart 3: Accelerated transition leads to lower credit risk and is aligned with the Paris Agreement goals
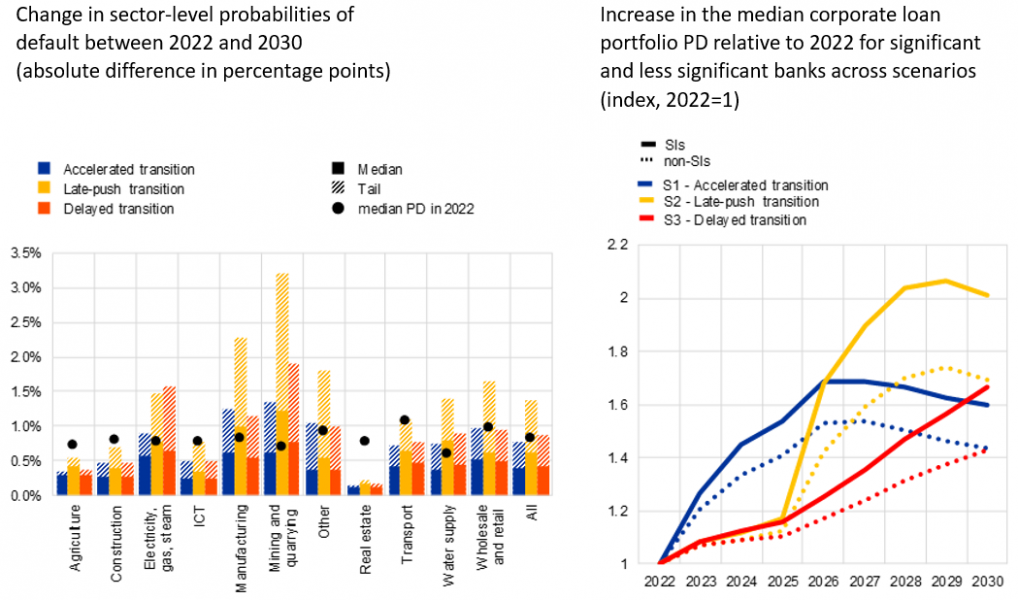
Source: ECB calculations based on Orbis, Urgentem, Eurostat, NGFS, International Renewable Energy Agency (IRENA; 2021) and Intergovernmental Panel on Climate Change (2022). Notes: In panel a, tail changes represent percentage point changes in borrower-level PDs for the 75th percentile firm in each sector and scenario. ICT stands for the Information and Communication Technology sector. Panel b shows the median probabilities of default (PDs) of corporate loan portfolios by type of euro area bank. Corporate loan portfolio PDs are calculated as the average borrower-level PD, weighted by their loan size. SI stands for significant institution.
The highest expected losses would be concentrated in a few banks. Focusing on significant institutions, 1-year expected losses as a fraction of total loan exposures for the median bank would be around 0.7% to 0.9% in 2030 under the three transition scenarios and close to the losses projected for the median bank under a current-policy baseline scenario (Chart 4, panel a). At 2.1%, the expected losses’ ratio for the banks most vulnerable to transition risk would be double the median under the late-push scenario and also double the expected losses’ ratio under a current-policy scenario. Expected losses on bank portfolios are covered by provisions, and the provision coverage for International Financial Reporting Standards (IFRS) stage 1 loans5 was 0.69% in 2022. Banks’ provision coverage would be expected to increase by 25 basis points until 2030 due to macroeconomic and current-policy effects (Chart 4, panel b).6 If the transition scenarios were to materialise, the provision coverage for such loans would increase by an additional 37 basis points and 61 basis points during the peak of the accelerated and late-push transition scenarios in 2027 and 2029 respectively. Given that the reduction in emissions during a delayed transition would be less ambitious, the increase in provision coverage until 2030 due to transition risk would be smaller in this scenario. However, provisions are expected to increase more strongly in the delayed transition after 2030 due to ongoing transition efforts and the stronger impact of physical risk in the long-term.
Chart 4: Accelerated transition leads to lower credit risk and is aligned with the Paris Agreement goals
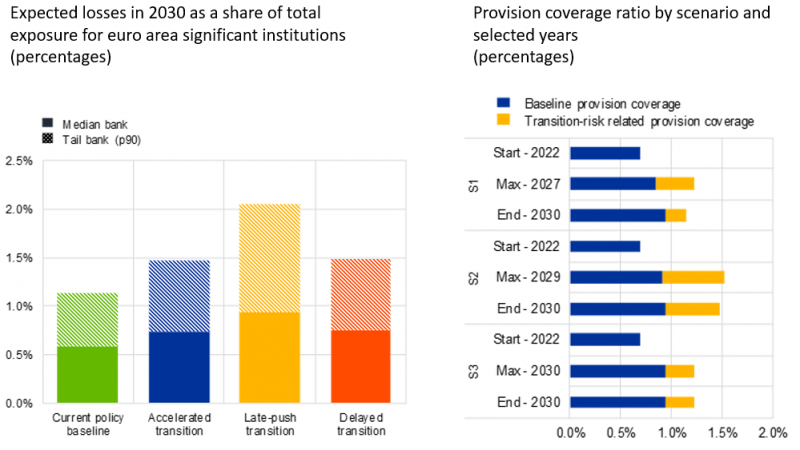
Source: ECB calculations based on Orbis, Urgentem, Eurostat, NGFS, International Renewable Energy Agency (IRENA; 2021) and Intergovernmental Panel on Climate Change (2022). Notes: In panel a, the baseline scenario comprises NGFS current policies only, with no additional transition risk, and serves as a benchmark scenario. Tail bank is defined as the 90th percentile bank in terms of expected losses relative to total loan exposures in 2030.In panel b, aggregated provisions and expected losses as a fraction of total outstanding loan volume based on a subsample of IFRS stage 1 loans are shown.
Our results show that an accelerated transition would provide significant benefits for firms, households, and the financial system, compared with a late-push transition scenario. Credit risk would increase during the transition under all scenarios, and particularly in the event of late and abrupt actions as envisaged under the late-push transition scenario. While the accelerated transition would lead to greater costs for households and firms in the short term, due to rapid increases in energy prices and the immediate need for investments, it would lower the financial risks in the medium term. At the same time, an early start of the transition would allow banks to benefit from both lower credit risk and larger investment needs, thereby improving their income positions. The scenarios entail substantially different long-term implications for physical risks. In the event of a delayed transition, firms and households might be more vulnerable to physical risk in the long-term, as well as potentially to the compounding effects of transition and physical risks combined.
Alogoskoufis, S., Dunz, N., Emambakhsh, E., Hennig, T., Kaijser, M., Kouratzoglou, C., Muñoz, M. A., Parisi, L. and Salleo, C. (2021), “ECB economy-wide climate stress test. Methodology and results”, Occasional Paper Series, No 281, European Central Bank, Frankfurt am Main, September.
Emambakhsh, T., Fuchs, M., Kördel, S., Kouratzoglou, C., Lelli, C., Pizzeghello, R., Salleo, C., Spaggiari, M. (2023), “The Road to Paris: stress testing the transition towards a net-zero economy”, Occasional Paper Series, No 328, European Central Bank, Frankfurt am Main, September.
Network for Greening the Financial System (2022), “NGFS Climate Scenarios for central banks and supervisors”, Paris, September.
Given that temperature increases and physical risk levels would depend on the action taken at global level, these considerations would hold true only on the assumption that all global economies reduced their emissions as envisaged under their respective (front-loaded) NGFS scenario.
Scope 2 Co2 emissions are indirect emissions generated by the consumption of electricity. In contrast, Scope 1 emissions are direct emissions produced by the direct consumption of brown energy sources and fossil fuels.
Under an accelerated transition scenario, firms would benefit from lower investment costs and cost-efficiencies driven by a rapid increase in renewable energy capacity. Average investment costs would drop from around USD 1,200 per KWh in 2022 to close to USD 380 per KWh in 2025 under the accelerated transition scenario. Under the late-push transition scenario, investment costs would drop substantially in 2026 as the transition speeded up. In the delayed transition scenario would have a much slower and linear decrease in investment costs given that renewable energy capacity would increase only gradually. While average investment costs would converge at around USD 300 per KWh in all scenarios at the end of 2030, the higher funding costs throughout the decade under the late-push and delayed transition scenarios would put more pressure on firms’ indebtedness and make investments in renewable energy less attractive.
The total secured and unsecured loan exposure of the euro area banking system to energy intensive sectors (electricity, wholesale and retail trade, manufacturing, mining and quarrying, and transportation sectors corresponding to NACE level 1 codes B, C, D, G and H) is around 40% of the total portfolio and greater for significant institutions (SI) relative to other banks (42% of the total loan volume for SIs). See Emambakhsh et al. (2023) for further details.
Provisions for IFRS stage 1 loans account for one-year expected losses, allowing direct comparison with the expected annual losses considered in this study.
To isolate the impact of transition risk from other macroeconomic developments, expected losses were first calculated for a baseline scenario which comprised NGFS current policies only and no additional transition risk. Expected losses due to transitional risk were defined as annual expected losses under each transition scenario in excess of annual expected losses under the baseline scenario. The sum of baseline and excess transition risk losses equate to the total expected losses per year and scenario.