The views expressed in this policy brief are those of the authors and do not necessarily reflect those of the Eurosystem or the Oesterreichische Nationalbank.
This circumstance has contributed to the development of a weekly GDP indicator by the Oesterreichische Nationalbank (OeNB), the National Bank of Austria, based on payment data, truck journeys and the like. This data is available swiftly and thus allows a much quicker picture of the current economic situation. An additional instrument is the Kiel Trade Indicator (KTI), which is aimed specifically at estimating international trade flows based on data from the container shipping network.
The KTI was developed in 2021 at the Kiel Institute for the World Economy (Stamer, 2021). It estimates the imports and exports of 75 countries and regions using real-time ship movement data with the help of artificial intelligence algorithms. To measure trade volumes as accurately as possible in an inflationary environment, the indicators reflect price-adjusted trade. The Kiel Institute for the World Economy makes the bimonthly estimates available online. Figure 1, for example, shows the dashboard of the website for July 2022:
Figure 1
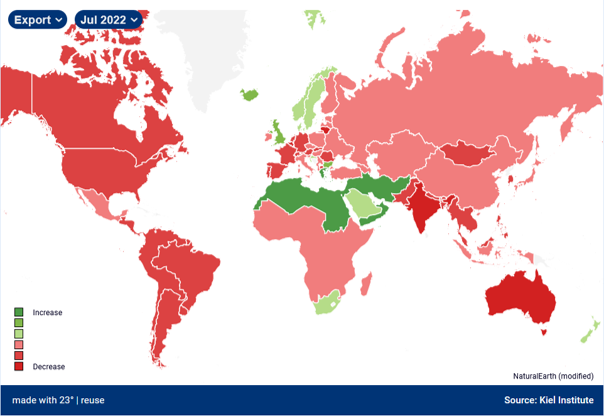
Notes: Image obtained on https://www.ifw-kiel.de/de/ for exports in July 2022. The darker the shade of green the more positive the exports of the respective countries or blocs. The darker the shade of red the more negative the trade flow.
The project processes approximately two Million container ship positions from the data provider Fleetmon.com per year including information on course, size as well as draught of the container ships. The data covers all container ships, their global movements and stops (“port calls”) at more than 500 major ports. To translate a port call to cargo volume loaded or unloaded, the current draught1 of the ship is compared to technical minimum and maximum values, interpreted as a share of capacity used and multiplied by the overall carrying capacity of the ship.
All shipping information is fed to a machine learning model which aggregates the ship information into useable time series and calculates estimates for trade flows. The algorithms underlying the KTI are trained to interpret ship movements as price-adjusted (real) trade flows. Stamer (2021) provides more details on the procedure, as well as various econometric tests of out-of-sample estimates. Overall, the indicator provides more accurate forecasts than benchmark models for the majority of covered countries. Current estimates of trade figures are updated twice a month for the current month (nowcast) and the subsequent month (forecast). The resulting values can be interpreted as stand-alone forecasts of trade flows based on container shipping only, or may be used as an indicator for trade in broader forecast models.
Figure 2
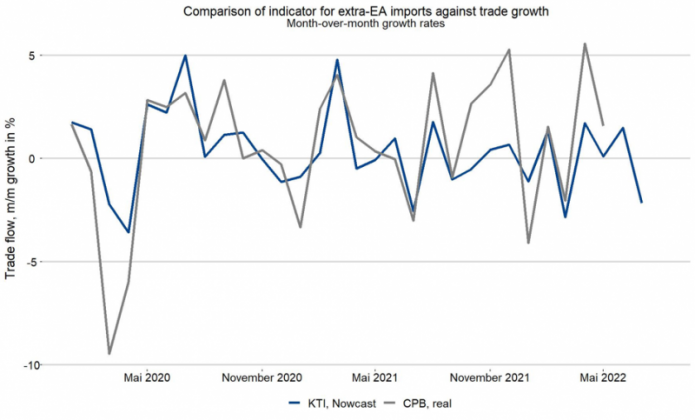
Notes: Nowcast refers to Kiel Trade Indicator for extra-euro area (EA) imports. Trade flow growth obtained from CPB (2022) for real extra-euro area exports.
Figure 2, for instance, shows the Kiel Trade Indicator for imports by the euro area countries from external countries (KTI, Nowcast) and the reference growth rates of real import growth provided by the CPB Netherlands Bureau for Economic Policy Analysis (CPB, 2022). The respective lines show considerable overlap, although the KTI values predate the official statistics by up to two months. Note, that the Kiel Trade Indicator explicitly focuses on the container shipping network. While the container liners transport approximately half of global trade by value, other vessels such as tankers, as well as trains, trucks and airplanes also play a role in goods trade. Hence, the Kiel Trade Indicator offers one specific source of information on trade flows, but should not be confused with an all-encompassing forecasting model of trade.
Besides the headline figures, the Kiel Trade Indicator also reports on container ship traffic and highlights current, policy-relevant trends. For example, Figure 3 shows the dramatic increase in the volume of goods on stationary ships during the Covid19 crisis. The share of goods locked in congestion reached almost 14% in August 2021 and remains at very high levels well into 2022. Tracking congestion of container ships offers one perspective on logistical bottlenecks as well as on supply chain disruptions and congestion is associated to high transportation costs in the container shipping network.
Figure 4 illustrates the impact of the war against Ukraine and subsequent EU-sanctions against Russia on the three largest Russian container ports and on the port of Odessa, Ukraine. As seen in the figure, cargo arrivals at Russian container ports dropped dramatically, especially for St. Petersburg, the largest container port of Russia in 2021, which saw a decline of around 75% compared to pre-war levels. This comments on the effectiveness of European sanctions that are highly debated.
Figure 3
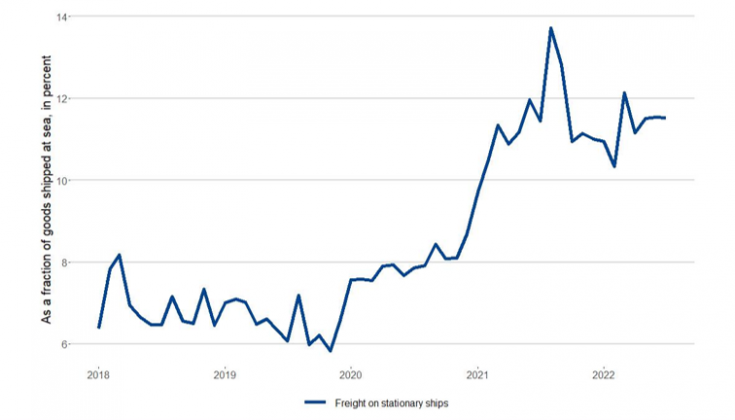
Notes: Updated on August 4, 2022. The figure approximates the volume of goods which are located on ships that are immobile and outside of ports as a share of the total volume of goods moved in the container shipping network.
In summary, the Kiel Trade Indicator uses high-frequency container ship data to provide real-time information on trade flows and policy relevant trends in maritime transportation. While one may supplement data from the container shipping network with other indicators and data sources, the KTI provides a key piece to understanding trade flows in real time.
Figure 4
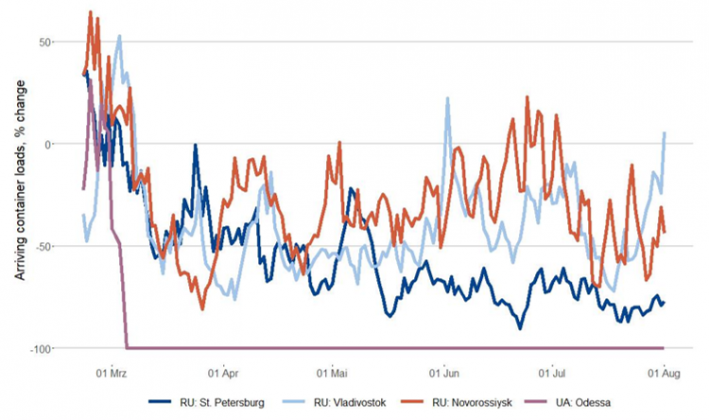
Notes: Updated on August 4, 2022. The figure approximates the volume of goods arriving per container ship at ports of St. Petersburg, Vladivostok and Novorossiysk, Russia, as well as Odessa, Ukraine. Comparison to previous year.
CPB, (2022): CPB Netherlands Bureau for Economic Policy Analysis. World Trade Monitor May 2022. https://www.cpb.nl/en/world-trade-monitor-may-2022. Accessed August 2.
Stamer, Vincent (2021): Thinking Outside the Container: A Sparse Partial Least Squares Approach to Forecasting Trade Flows, Kieler Arbeitspapiere 1/2012.