This policy brief is based on FEB-RN Research Paper No. 01/2024. The views expressed are those of the authors and not necessarily those of the institutions the authors are affiliated with.
Abstract
The paper of C. Mateus, I.B. Mateus & N. Todorovic “Mutual fund performance: the model for selecting persistent winners” presents a model highly relevant for investors aiming to identify “true” winning active mutual funds with persistent performance over the subsequent three years. It offers a sophisticated, easy-to-replicate approach that can be applied to different fund style categories and asset classes. The model eliminates the bias of the Fama-French-Carhart approach, leading to non-zero passive index alphas (a biased measure of skill and excessive performance) and adds practicability by incorporating relevant peer-group performance (industry standard) to the mutual fund evaluation framework. The findings show that the Mateus, Mateus, Todorovic approach identifies more certain, unique and persistent winners. The performance and persistence in performance are assessed in comparison with the results of the standard Carhart approach. The new model identifies consistent winners that earn higher returns net of benchmark and peer-group vs. Carhart winners; moreover, the model distinguishes unique winners overlooked by the standard FFC approach with persistent performance 36 months ahead. It also classifies more extreme and unique persistent losers. The results are robust to different specifications of contingency tables, holding periods, style categories of funds and decile/quintile portfolio sorts.
A vast strand of past academic literature has looked at the performance of actively managed equity funds using the standard Fama-French and Carhart factor models. Until recently, the prevailing evidence has shown funds’ underperformance after fees, with a few exclusions, and has provided scarce evidence of performance persistence. A new discussion arose when the recent papers pointed out that the arbitrary nature of Fama-French factor construction leads to disproportionate weights assigned to value and small-cap stocks (Chan et al., 2009; Chinthalapati et al., 2016; Cremers et al., 2012; Mateus et al., 2019a). This consequently causes a bias, resulting in non-zero benchmark alphas when the passive benchmarks are regressed on the Carhart four-factor model, whereas alpha is commonly seen as a measure of a portfolio manager’s skill. For example, significant Carhart alpha of 0.82% was documented for the S&P 500 index from 1980 to 2005, the highest alpha of 7.5% was recorded for the Russell 2500 Value index for the period 1995–2004, persistently negative four-factor alphas were observed for the FTSE 100 Index for the period 1992–2013. Such biases in the Fama-French risk factor construction affect the inferences on fund performance.
The latest literature has also highlighted the importance of incorporating the active peer benchmark into fund performance assessment due to potential mismatches in self-designated benchmarks, unavailability of all style-specific indices (examples, FTSE, MSCI segmentation) and lack of consideration of fund relative performance assessment among peers, which is of essential interest to investors and practitioners (Hunter et al., 2014; Mateus et al., 2019b and 2019c; Mateus et al., 2023). Thus, a fund that beats a corresponding benchmark may not be the best in the peer group ranking, and a fund that underperforms during economic downturns may be the top performer in the peer group.
Figure 1 below distinctly shows the periods of positive and negative Carhart alphas of the Russel 1000 Index, estimated over 336 monthly rolling periods. The figure also reveals that the peer group alpha, estimated as the average of returns for funds categorised as Large Value, does not have the same pattern.
Figure 1. Rolling Carhart alpha of Russell 1000 Value and Large Value Peer group
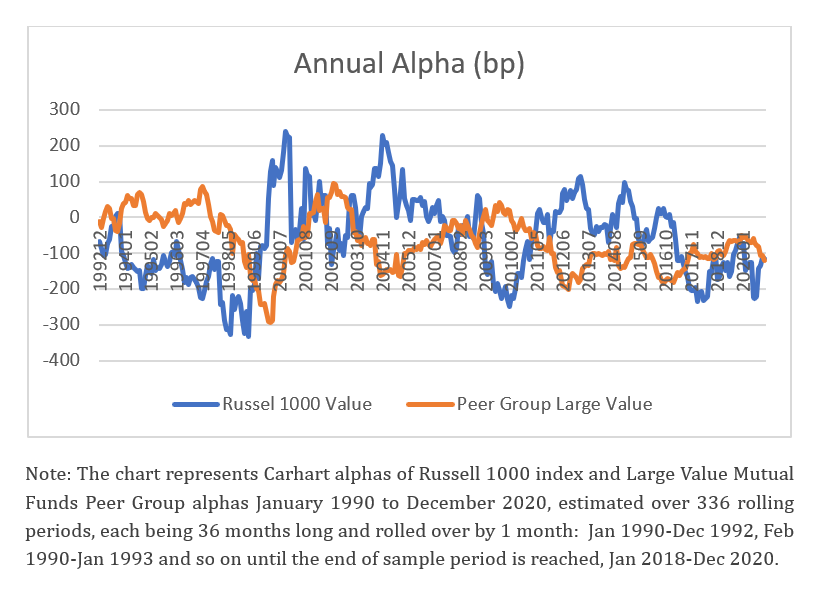
Moreover, it shows that without adjustments, the peer group provides positive alpha only in 10 percent of cases; however, when adjusted for the benchmark alpha, the outcomes change and reveal a greater peer group alpha, beating the benchmark in 49.5 percent of instances. This example emphasises the need for a model that eliminates non-zero index alphas and accounts for fund relative performance with the inclusion of common idiosyncratic risks, a model that would bring certainty to investors and practitioners with respect to the selection of true winners and losers, that would display further persistence in performance.
The paper of C. Mateus, I.B. Mateus & N. Todorovic “Mutual fund performance: the model for selecting persistent winners” introduces a new approach that augments the Carhart model and enables investors to identify the funds that outperform both the benchmark and the peer group. The model allows to identify more certain winners by eliminating the under-/outperformance of funds driven by the bias in the Fama-French factor construction.
The model augments the standard Carhart factor model at two levels. First, it amends the left side of the four-factor model by estimating the excess return of a fund, subtracting the return of the benchmark instead of the risk-free rate, thus allowing for the exclusion of non-zero index alphas. Second, it constructs the Active Peer Benchmark (APB) as an equally weighted return of all the funds within the peer group and incorporates the “peer group factor” on the right side of the model, which controls for the unique performance and risk of the fund’s peer group, through the peer group alpha and the error term previously estimated following the same augmented Carhart approach. Thus, using the Mateus, Mateus and Todorovic model, investors and practitioners can identify fund performance adjusted for biases in Fama-French factor construction and peer-group commonalities. The outcome of the model shows the true skill alpha.
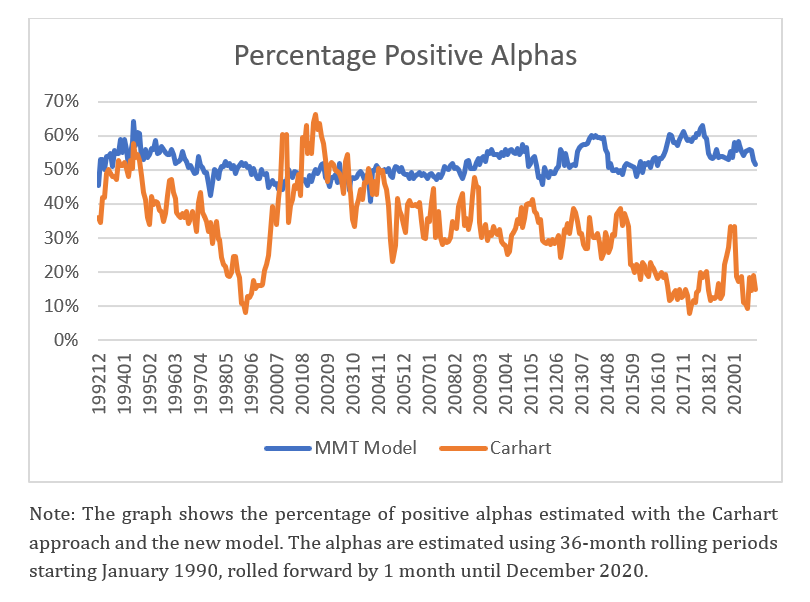
Figure 2 shows that the new model displays more consistent positive alphas, estimated using 36-month rolling periods for the Large Value funds, over the period from January 1990, rolled forward by one month, until December 2020. The outcomes for Carhart alphas are more volatile due to the imposed benchmark alphas, meaning that negative benchmark alphas may trigger consecutive fund underperformance. The paper provides examples highlighting that the Carhart model may wrongly classify a fund as an underperformer, especially during periods when a self-reported benchmark (and peer-group) underperforms.
Figure 2. The percentage of positive alphas estimated with the Carhart and the new model
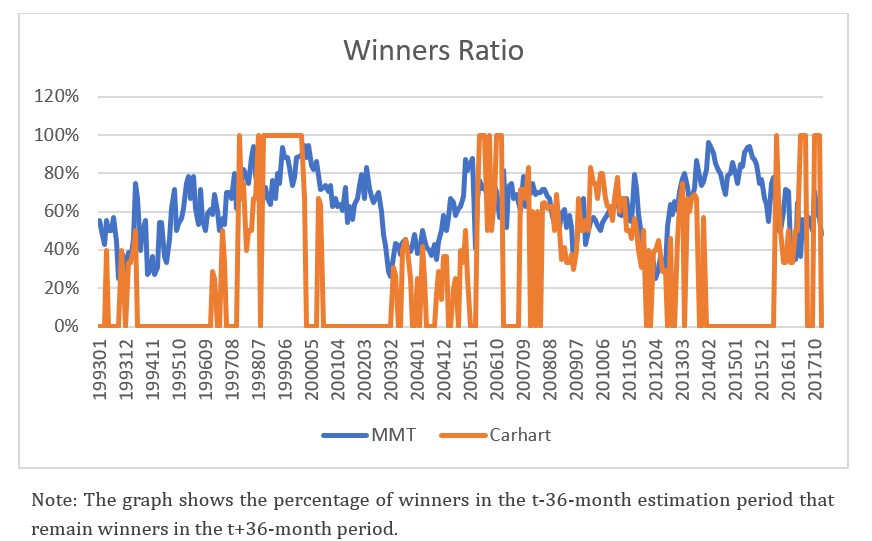
The figure below further illustrates that the Mateus-Mateus-Todorovic (MMT) model exhibits a stronger ability to identify true and consistent winners compared to the Carhart model. The winners identified with the new model show much stronger performance persistence. Thus, the winners selected using the new model exhibit their consistent performance in the 24- and 36-month post-estimation period, whereas the performance of the winners chosen with the Carhart model is inconsistent.
Figure 3. The percentage of positive alphas estimated with the Carhart and the new model
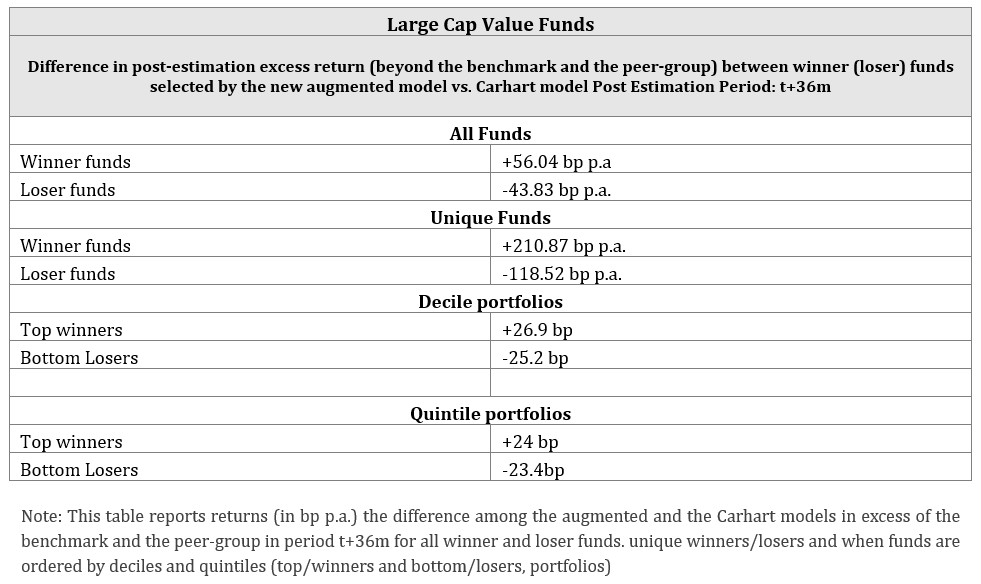
To show the magnitude of a potential bias arising from the omission of the issues linked to the Carhart factor construction and a mismatched benchmark, the authors estimate annualised excess returns of winners and losers above the benchmark and the peer group in the consecutive post-performance 36-month period, where winners and losers are identified following both, the new and the Carhart model. The difference in excess returns of the winners and losers shows that the winners identified by the new model earn benchmark and peer-group adjusted return 56.05 bp above, whereas losers have more pronounced negative excess returns, −43.83 bp p.a., in comparison to Carhart’s winners and losers, respectively.
The bias of a greater magnitude is recorded for the unique funds (winners or losers identified by the MMT model but omitted by the Carhart, and vice-versa), where the excess return reaches +210.87 bp p.a. in difference for the winner funds and -118.52 bp p.a. for the losers versus the standard Carhart model. Equivalent differential excess returns are documented when the portfolios are split by alphas into deciles and quintiles. This outcome shows that the Mateus-Mateus-Todorovic model has a stronger ability to identify the true winners and losers exhibiting persistent performance 36 months ahead. Furthermore, the new model highlights that both at times of index out- and underperformance, the Carhart model ascertains a greater number of fund-periods with negative alphas and swings to categorise more funds as losers compared to the new model.
Table 1. Excess returns Augmented (new) and Carhart Models
The results are robust to different specifications of contingency tables, holding periods or style categories of funds.
The Mateus-Mateus-Todorovic model is of significant importance to investment professionals. It offers a sophisticated, practical and easy-to-replicate approach which allows for identifying persistent and genuine mutual fund winners, the funds that generate consistent excess returns above both the corresponding benchmark and the peer group, over subsequent 36-month periods. The new model provides a crucial contribution to mutual fund performance evaluation as it suggests a more accurate and practical framework which eliminates biases of non-zero passive index alphas inflicted by the standard Fama and French’s and consequently Carhart’s models factor construction, and reflects the industry standard by incorporating fund peer-group relevant assessment accounting for commonalities in performance and risk of the peer group that are not captured by the standard market factors or the benchmark alone.
The “true” winners identified by the new approach displayed consistently superior returns in excess of their stated benchmark and the peer group, 56.05 bp p.a and 77.65 bp p.a more than Carhart’s winners for Large Cap Value and Large Cap Growth funds, respectively. The unique winners (those not identified by the Carhart model) demonstrated even higher economic significance, producing 210.87 bp p.a. and 117.99 bp p.a. excess returns for Large Cap Value and Large Cap Growth funds, respectively. The same approach allows identifying unique and more extreme persistent losers. The “true” and unique winners and losers identified by the Mateus, Mateus and Todorovic model exhibited significant persistence in performance 24 and 36 months ahead. The findings are not limited to specific types of funds and hold true across different style categories, including Small Cap Value and Small Cap Growth. The results are robust to different holding periods and various statistical specifications for defining winners and losers, including analyses based on only statistically significant alphas, different specifications of contingency tables, and decile/quintile portfolio sorts. This methodology provides investors with a better chance of making better investment decisions and correctly classifying funds that are truly outperforming, rather than those whose success is merely a reflection of market or peer-group trends. Such a fund’s superior selection ability and accurate performance assessment are of particular importance when the fund-specific benchmark and the peer group underperform.
Chan, L. K. C., S. G. Dimmock, and J. Lakonishok, 2009, “Benchmarking Money Manager Performance: Issues and Evidence.” Review of Financial Studies 22(11), pp. 4553–4599.
Chinthalapati, V.L., Mateus, C. and Todorovic, N., 2017, Alphas in disguise: A new approach to uncovering them, International Journal of Finance and Economics, 22 (3), pp. 234-243.
Cremers, M., Petajisto, A. and Zitzewitz, E., 2012. Should Benchmark Indices Have Alpha? Revisiting Performance Evaluation, Critical Finance Review, 2, pp.1-48
Hunter, D., Kandel E., Kandel S. and Wermers R., 2014, Mutual fund performance evaluation with active peer benchmarks, Journal of Financial Economics, 112(1), pp. 1-29.
Mateus, I.B., Mateus, C. and Todorovic, N., 2019a, Review of new trends in the literature on factor models and mutual fund performance. International Review of Financial Analysis, 63, pp. 344–354.
Mateus, I.B., Mateus, C. and Todorovic, N., 2019b. Use of active peer benchmarks in assessing UK mutual fund performance and performance persistence. The European Journal of Finance, 25(12), pp.1077-1098.
Mateus, I.B., Mateus, C. and Todorovic, N., 2019c. Benchmark-adjusted performance of US equity mutual funds and the issue of prospectus benchmarks. Journal of Asset Management, 20(1), pp. 15–30
Mateus, C., Mateus, I. B., and Todorovic, N., 2023, Searching for mutual fund winners? The strategy is to outbid both, the benchmark and the peer group”, Applied Economics, https://doi.org/10.1080/00036846.2023.2175778
Mateus, C., Mateus, I. B., and Todorovic, N., 2024, Mutual fund performance: The model for selecting persistent winners, FEB-RN Research Paper No. 01/2024, Available at SSRN: https://ssrn.com/abstract=4894796