This policy brief is based on Eijsink & Van Dijk (2023), Borrowing capacity and house prices, DNB Analysis. The authors would like to thank Frank van Hoenselaar and Aishameriane Venes Schmidt for their assistance on this project and other colleagues from De Nederlandsche Bank for their feedback. The views expressed here are those of the authors and do not necessarily represent the views of De Nederlandsche Bank.
We describe a measure for the developments of housing affordability. Affordability is computed as the difference between maximum mortgage borrowing capacity and house price developments. Income and interest rates are important drivers of historical changes in borrowing capacity. In the Netherlands – characterized by low supply elasticity and high loan to value ratios – the relationship between borrowing capacity and house price is found to be close to unity. In a scenario with quickly increasing interest rates, akin to the situation in 2022, we observe a rapid decrease in affordability. From mid 2023 onwards, affordability improves again. This is mainly driven by the fact that income growth offsets the increased interest rate cost. In the long-run, affordability returns to 0 as house prices have responded accordingly to changes in borrowing capacity. An additional tax-scenario indicates a very strong impact of tax treatment of homeowners on house prices.
In many countries, house prices increased steadily since 2015. But the price increases came to a halt in the summer of 2022. In response to rising inflation, central banks increased interest rates. This had an impact on mortgage interest rates with declining house prices as a result. Aspiring buyers may have followed these developments with great interest, hoping to enter the housing market at a good time against a lower price. However, even though house prices have come down in the past year, mortgages rates have increased substantially. For first-time buyers, who are constrained by some form of Loan to Income (LTI) or Debt Service to Income (DSTI) limit, this implies that their maximum mortgage also decreased. This raises the question whether houses have in fact become more affordable for first-time buyers. In order to assess this, we construct an affordability indicator as the difference between the developments of the maximum mortgage of an average first-time buyer and the house prices.
To put the results of the study in perspective, a brief explanation of the institutional context of the Netherlands may prove to be useful for some readers. Mortgage lenders in the Netherlands are required to abide by an implicit DSTI-limit, defined and annually updated by the National Institute for Family Finance Information (NIBUD). We will use these DSTI-limits to calculate our measure. Furthermore, the LTV limit in the Netherlands is 100%. Therefore, we will assume all first-time buyers are fully credit constraint and borrow the full amount to finance their purchase.1 In addition, the Dutch housing market is characterized by a very low supply elasticity. For this reason, most Dutch housing market models exclude supply side variables such as housing stock and new production. Due to the low supply elasticity, increases in the borrowing capacity are shown to have a close relationship with house prices. In a recent publication, we show that this relationship is not statistically significantly different from 1 (Eijsink & van Dijk, 2023). Lastly, mortgage interest can be deducted from income taxes at the rate of the lowest tax bracket of 36.93% and there is an implicit rent tax of 0.35% of the value of the house that is added to the taxable income in the income tax.
We define the borrowing capacity as the amount of money a household can spend on buying a home. We assume that first-time buyers will not fund any of the house purchase themselves, which reasonably reflects the position of first-time buyers. We base this method on the maximum mortgage loan a household with an average gross income can obtain given the level of mortgage interest rates. These maximum mortgage amounts for households are set by Nibud (Nibud, 2023). Between 1995 and 2022, households’ borrowing capacity increased substantially, by 239%. Income and interest rates were the most important contributors to the growth of the borrowing capacity, as can be seen in Figure 1. Nibud’s DSTI-limit itself had a negative effect on the development of borrowing capacity. This is not due to adjustments of Nibud standards over time, but to the operation of mortgage interest deductibility. When mortgage interest decreases, mortgage interest deductibility also decreases. This reduces the proportion of gross income that can be spent on mortgage payments, partly negating the positive contribution of the decrease in interest rates. In an earlier publication we also used two alternative methods to calculate the borrowing capacity based on constant DSTIs. These measures lead to similar empirical results (see Eijsink & Van Dijk, 2023). For the sake of brevity, we will stick to one method here.
Figure 1: Decomposition of borrowing capacity
Cumulative index (1995Q1 = 100)
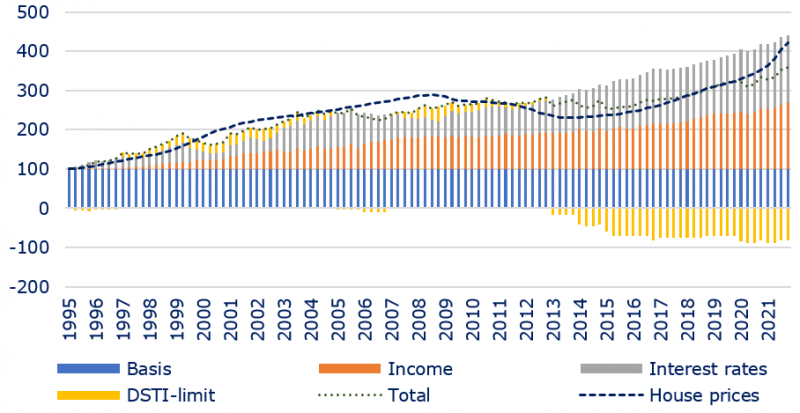
We use the measure of the borrowing capacity to show the relationship between borrowing capacity and house prices. We do this by means of a vector error correction model (VECM), see Eijsink & Van Dijk (2023) for model details.2 Figure 1 also shows the relationship between the borrowing capacity and house prices. We use the borrowing capacity as an explanatory variable in the model, and in addition include historical house prices and construction costs. Supply-side variables (such as housing stock and new housing production) have no significant effect in the model and have therefore been omitted.3 In our model, a one-off rise of 3.5% in the borrowing capacity (one standard deviation) leads to a 3.9% increase in house prices after about 20 quarters. This indicates that the elasticity of the borrowing capacity is close to unity. It also explains how the combination of falling interest rates and income growth can drive house prices sharply higher, as we have seen in recent years. Furthermore, the relationship between borrowing capacity and house prices is stable over time and the elasticity does not differ significantly from 1 over the long term.4
Figure 2: House prices and the borrowing capacity
Indices, 1995 = 100
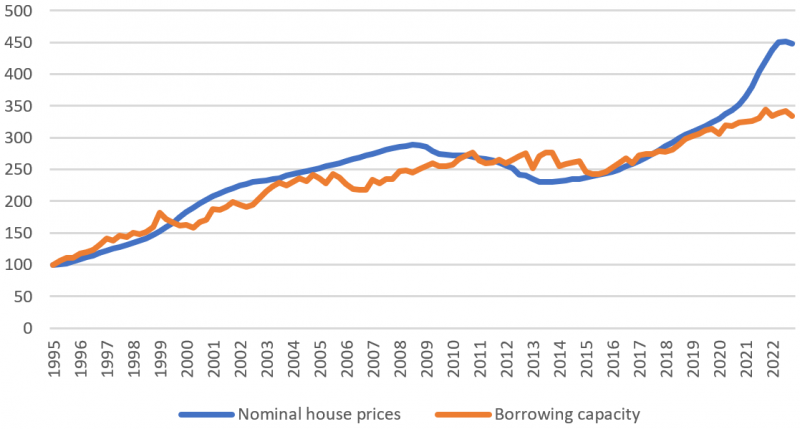
Although house prices move in line with borrowing capacity in the long run, they may diverge in the short run. The short-run divergence between the borrowing capacity and the house prices is how we define the affordability of houses. In order to show the developments of the affordability we have taken the start of 2022 as the starting point. We then assume a gradual increase in the mortgage rate of 2.5 percentage points to 4.15% over the course of 2022. This increase of the mortgage rate largely follows the actual developments of the mortgage rate. For income developments, we use the forecast of the DNB Broad Macroeconomic Projection Exercise December 2022, which assumes an increase of disposable income of 5.4% in 2023 and 4.4% in 2024.
Figure 3: Developments of house prices, borrowing capacity and affordability
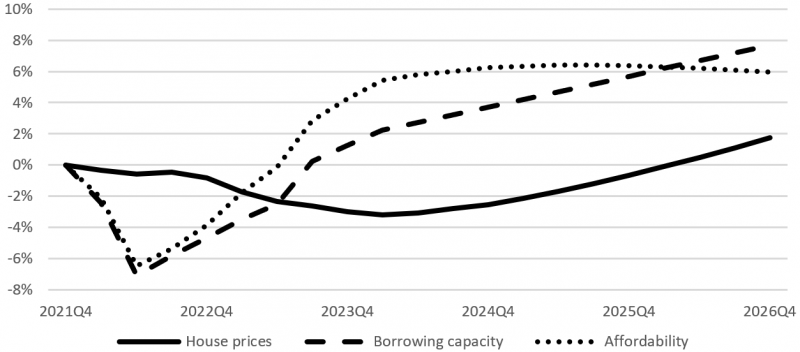
Figure 3 shows the developments of the house prices, borrowing capacity and affordability for this scenario. It shows that borrowing capacity decreases almost immediately in response to rising interest rates, while house prices show a delayed reaction. As a result, affordability decreases significantly (dotted line in Figure 3). This is also what we saw in practice in 2022. The expected income growth due to high inflation and a tight labor market did not yet materialize in 2022 and hence did not translate into a rise in borrowing capacity. With house prices failing to match the fall in borrowing capacity, affordability decreased. However, the income developments will lead to an increase in the borrowing capacity, which in turn will lead to an increase in affordability. In this scenario, from mid-2023 (quarter 6), the combination of a materialized house price fall and the rise in incomes would improve affordability, relative to the end of 2021. In the long-run, the affordability returns to 0 as house prices have responded accordingly to changes in borrowing capacity. This is a stylized scenario. Actual developments in the housing market may differ, for instance because of a downturn in market sentiment or policy changes.
The model can also be used to show the effect of changes in taxes. As mentioned before, in the Netherlands, home owners can deduct their mortgage expenses using the mortgage interest deductibility (MID) at the rate of the lowest income tax bracket of 36.93%. Furthermore, homeowners pay an imputed rent tax (IRT) by adding 0.35% of the value of their house to their taxable income. In a recent report on the wealth distribution it was suggested that the IRT could be increased to 2.45% by 20 annual increases of 10 basis points,5 in combination with a reduction of the MID to 31% in 2025 (IBO Vermogensverdeling, 2022). This tax scenario would result in a price decrease of about 29% in the long-run (4-5 years).
This price effect reflects a situation in which the tax measures would be instantaneously instigated. A gradual phase-in of the measures would have a different effect only if we assume households do not have perfect foresight and the discount rate of future house price declines is larger than 0. In reality, the effect of reducing tax benefits for homeowners will most likely be larger than the gradual effect with zero foresight, but smaller than the instantaneous effect. The gradual scenario does not account for offsetting measures such as lower income taxes, forward looking behavior, and assumes all consumers are credit constraint. With this gradual phase-in of the measures, the price effect after 5 years would be about -8.6%. Here, we assume a decrease in the MID rate of 300 bps per year and an increase of the IRT of 10 bps per year. Note that the IRT would still be only 0.85 after 5 years.
A decrease in tax benefits for homeowners using this tax scenario would generate an increase in the government budget of approximately €21.6 billion. This would most likely be returned to households using a decrease in income taxes (terugsluis). Increases in disposable income would in turn lead to a larger borrowing capacity. This would thus dampen the effect of a tax shock.
Damen, S., Vastmans, F., & Buyst, E. (2016). The effect of mortgage interest deduction and mortgage characteristics on house prices. Journal of Housing Economics, 34, 15-29.
Eijsink, G. & Van Dijk, D. Borrowing capacity and house prices. DNB Analysis.
IBO Vermogensverdeling (2022). Licht uit, spot aan: de vermogensverdeling. Technical Report Rijksoverheid.
Jordà, Ò., Knoll, K., Kuvshinov, D., Schularick, M., & Taylor, A. M. (2019). The rate of return on everything, 1870–2015. The Quarterly Journal of Economics, 134(3), 1225-1298.
In practice, the average LTV of a first-time buyer (buyers under the age of 36) was around 85% in 2021.
This method is similar to that of Damen et al. (2016).
This is common in housing market models for the Netherlands, since the Netherlands has a highly inelastic housing supply. Demographic factors have also been found to be insignificant.
The 90% confidence interval of the response rate after 20 quarters ranges from 1.4% to 5.4%. We have used a Bayesian VAR model to test the stability of the relationship, among other things. See Eijsink & van Dijk (2023) for more details.
2.45% was suggested in order to bring the imputed rent tax closer to a conservative estimate of the imputed rent of 4% (Jorda et al., 2019). See IBO Vermogensverdeling (2022) for more details.