This policy note is based on IMF Working Paper WP/25/150. The views expressed in this paper are those of the author and do not necessarily represent the views of the IMF, its Executive Board, or IMF management.
Abstract
The size of the global Money Market Fund (MMFs) sector has surged in recent years, but what drives its growth? This study looks at MMF growth across nine major markets in the last 20 years, focusing on three driving factors: the yield gap between MMFs and bank deposits, shifts in perceived safety during banking stress, and structural differences among MMF types. The results show that yield-seeking remains the main force behind MMF growth, including after the 2023 banking turmoil, a period that presents little evidence of a broad “flight to safety.” In most regions, higher MMF yields also steer investors away from public debt funds and toward private debt funds. These findings highlight that, while MMFs primarily serve as cash management vehicles, investors use them to optimize yields, notably when rates are rising.
Money Market Funds (MMFs) are traditionally viewed as safe and liquid vehicles for short-term investment. Their global assets have grown sharply—from around €7 trillion in 2020 to about €11 trillion at the start of 2025—now accounting for roughly 15% of the world’s open-ended mutual funds. This expansion is striking given the long-standing concerns over MMF vulnerabilities and their implications for financial stability. Past crises have repeatedly exposed these fragilities (see Kacperczyk & Schnabl, 2010; Gallagher et al., 2019; Li et al., 2021; Aldasoro et al., 2021; Bouveret et al., 2022; FSB, 2020), and the FSB recently reaffirmed that MMFs remain exposed to liquidity mismatches and sudden redemptions that can amplify systemic stress, especially when they have a large footprint in short-term funding markets (FSB, 2024).
Against this backdrop, understanding the drivers of MMF growth is essential. In a recent IMF paper, I examine periods of MMF expansion across nine countries with significant MMF sectors, representing major global regions. The analysis finds that yield-seeking behavior is the dominant driver of MMF growth, particularly during monetary policy tightening cycles, and that this pattern persisted through the 2023 banking turmoil. Contrary to the idea of a broad “flight to safety” to MMFs post-turmoil, it was higher MMF yields that fueled inflows, which were even smaller in scale to previous hiking cycles. Yield-seeking dynamics also appear to shift flows from public- to private-debt MMFs, where return differentials can be larger, during tightening phases.
Basic information on the global MMF sector can help to put the analysis in perspective. The sector is concentrated largely in advanced economies, with the United States accounting for just over half of global assets and Europe’s activity centered in France and key financial hubs such as Ireland and Luxembourg. Nevertheless, MMFs also play an important role in the Asia-Pacific region (notably in China) and in the Americas, (particularly Brazil and Mexico when excluding the U.S.). While smaller in absolute size, MMFs in emerging markets represent on average a much larger share of domestic mutual fund sectors—around 30% compared with less than 10% in advanced economies, making shifts in MMF flows more impactful for domestic liquidity and financial stability.
Figure 1. The Global MMF Sector: Concentrated in Advance Economies, but important in Emerging Markets (Global MMF Sector size by region)
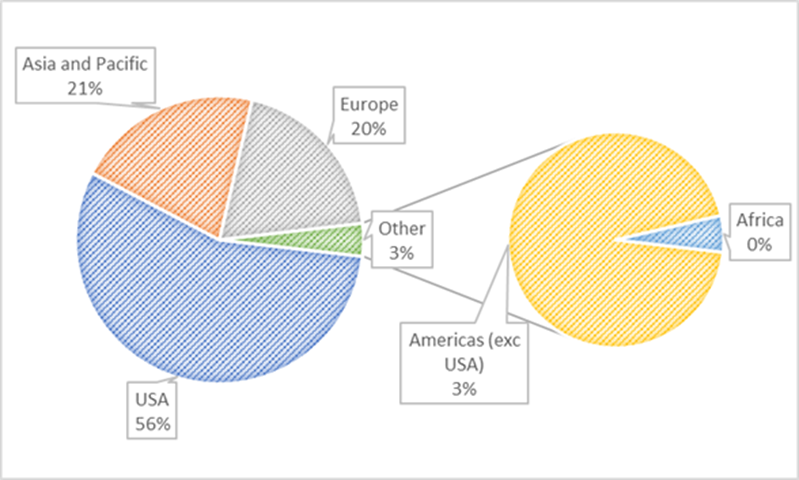
Note: The Figure shows the share of total MMF Net Assets across global region. The regions include data on 35 countries and are classified according to the EFAMA international statistics. The data are from 2025Q2. Source: EFAMA.
I focus on nine countries with large MMF sectors across the four global regions (USA, Europe, the Americas – excluding USA- and Asia/Pacific), all of which were undergoing monetary policy tightening in 2023, when the banking turmoil occurred. These include the United States, France, Ireland, Luxembourg, South Korea, Australia, Brazil, Mexico, and Chile. I analyze MMF growth rates, rather than flows, to account for large cross-country differences in sector size, while controlling for the broader macro-financial environment, fund size, and domicile.
The key finding is that the MMF yield advantage — the superior return on MMFs relative to alternative short-term instruments such as bank deposits — is a key determinant of MMF growth across countries. This yield advantage, here termed as MMF spread, is measured as the difference between short-term money market rates1, a proxy for MMF yields, against the country’s bank certificate of deposit or savings rates, depending on data availability. MMFs grow significantly faster when they offer better returns relative to bank deposits (Figure 2). I also control for other growth factors and find that MMFs tend to expand during periods of higher interest rates, but their growth is dampened by inflation, heightened global risk sentiment, and a steepening yield curve. Finally, the results show that larger MMFs tend to grow faster than smaller ones, suggesting growing concentration in the sector globally.
Figure 2. When yields rise, MMFs thrive (Estimated impact of MMF spreads on MMF growth)
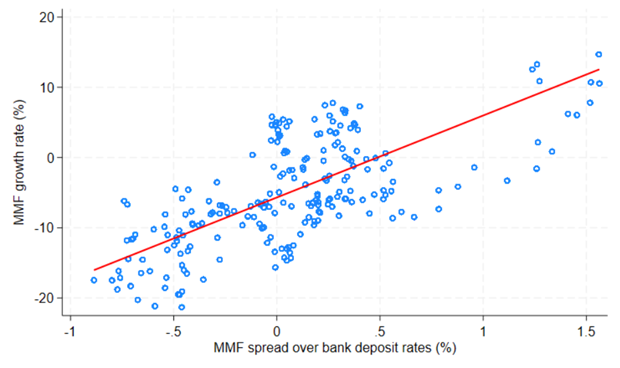
Notes: The chart plots the relationship between MMF growth and the yield spread between MMFs and bank deposits (MMF spread). Each point represents the monthly average across MMF funds and domiciles from January 2005 to January 2024. The upward slope indicates that higher relative MMF yields are associated with faster MMF growth. Results are consistent with panel regression estimates controlling for macroeconomic, financial and fund variables. Variables are standardized to have a mean of zero and a standard deviation of one. Sources: Lipper and author’s calculations.
The positive relationship between the MMF spread and MMF growth is especially pronounced during monetary policy tightening (Figure 3). In those periods, previous literature has postulated that MMF yields are more likely to increase rapidly compared to other cash management alternatives, such as bank deposits. This creates a compelling incentive for investors to move their cash into MMFs, seeking better returns without sacrificing liquidity (Xiao, 2020). Results show that such a mechanism holds strong across regions confirming the role of MMFs globally as vehicles for yield-seeking behavior, notably in a rising-rate environment.
Figure 3. The impact of MMF spreads on growth is higher during hiking cycles (Estimated impact of MMF spreads on MMF growth, by monetary policy cycle)
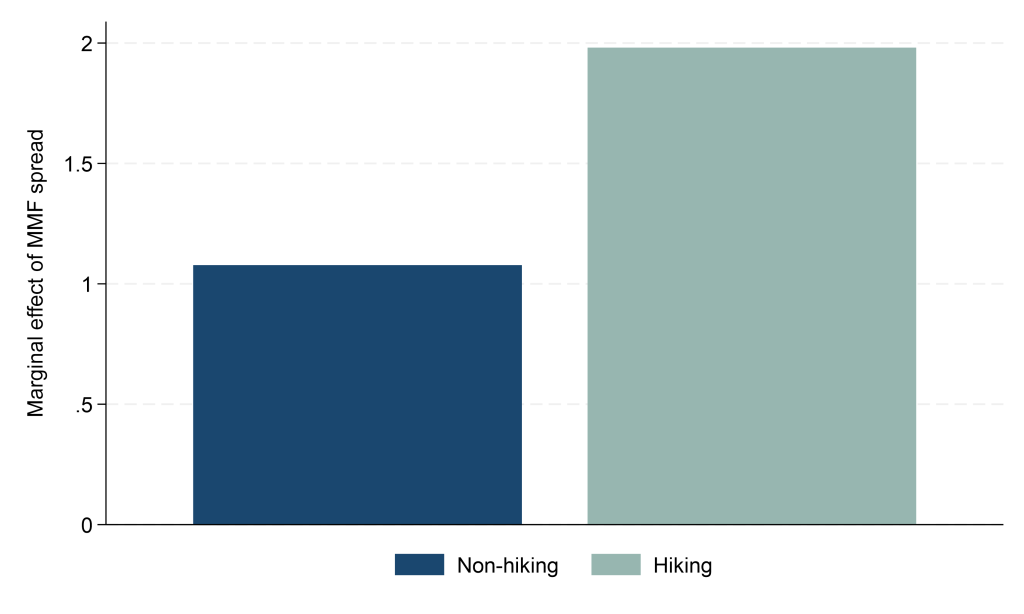
Note: The Figure reports estimates of the MMF growth rate sensitivity on MMF spreads and control variables, in the period from Jan 2015 to Jan 2024 during hiking vs non-hiking periods (Figure 4). Controls include country-specific inflation and GDP, the VIX (common across countries) as a proxy for global risk aversion, and the yield curve spread (10-year minus 2-year). The specifications also control for individual jurisdictions and MMF size (not reported). All continuous variables are standardized to have a mean of zero and a standard deviation of one. Sources: Lipper, Bloomberg and author’s calculations.
How would a banking crisis affect those dynamics? During banking crises investors often seek deposit alternatives, which MMFs can offer. Thus, inflows to MMFs maybe more motivated from a need to seek safety rather than yield. The collapse of several U.S. regional banks and Credit Suisse in 2023 put the spotlight on MMFs as a potential “safe haven.” Unlike the GFC or the COVID-19 shock, the 2023 turmoil was not a systemic crisis, which could lead to outflows from both banks and MMFs, but rather a crisis that primarily affected banks, thus allowing a clearer view of potential “flight-to-MMF” effects. It also occurred during a globally synchronized monetary tightening cycle, providing a consistent backdrop to analyze the turmoil, beyond monetary policy effects. Finally, it also allows for global comparisons of MMF behavior: While the post-SVB inflows into U.S. MMFs received much attention, cross-country evidence remains limited.
The results indicate that yield-seeking remained a key driver of MMF growth across most regions following the 2023 banking turmoil. In the United States, MMF growth became more sensitive to MMF spreads following the turmoil (Figure 4). However, despite higher relative yields supporting MMF growth, overall MMF growth was weaker than in past hiking cycles. These results downplay the scenario of investor “flight to MMF safety”. Instead they point to yield optimization as the key motivation, as investors effectively “woke up” to the higher returns offered by MMFs following the turmoil. These findings complement existing studies documenting intra-U.S. banking flows (from regional to large banks) that largely absorbed investors’ flight-to-safety concerns during that episode (Caglio et al., 2024). Beyond the U.S., Asia-Pacific and Americas markets exhibited similar patterns. By contrast, in the euro area investors appeared to have sobered, with MMF spread sensitivity remaining positive, but moderating from previously elevated levels. MMF growth did not exceed that observed in earlier hiking cycles—again consistent with the absence of a flight to MMF safety.
Figure 4. Superior MMF spreads remained a key driver of MMF growth following the 2023 banking turmoil
(Estimated impact of the MMF spread on MMF growth after the 2023 turmoil -green line-, compared to previous hiking cycles -blue line)
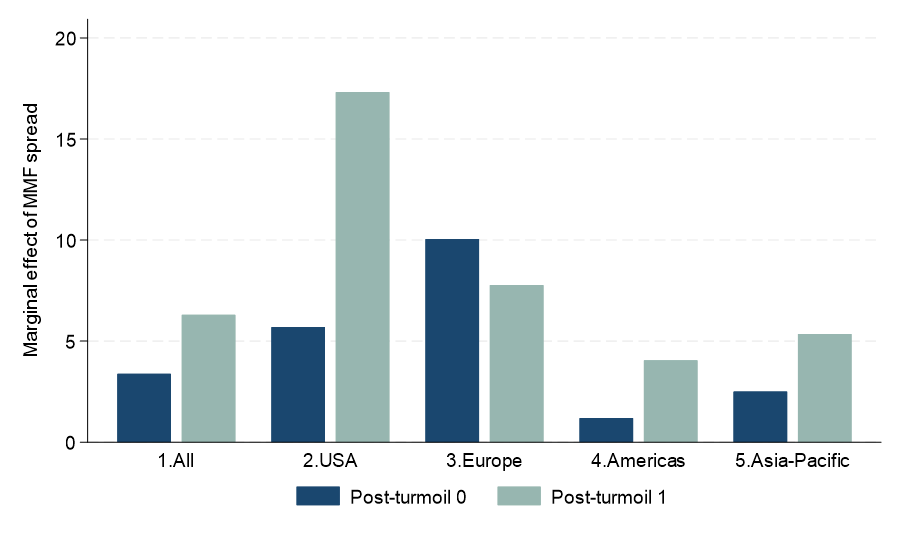
Notes: The Figure reports estimates for all countries and by region of the interaction term between MMF Spreads and a dummy variable, which equals 1 from March to June 2023 and 0 in the previous hiking cycles. The Americas region includes Brazil, Chile, and Mexico (excluding the U.S.), Europe includes France, Ireland and Luxembourg, and the Asia-Pacific region includes Australia and Korea. Controls include country-specific inflation and GDP, the VIX (common across countries) as a proxy for global risk aversion, and the yield curve spread (10-year minus 2-year). The specifications also control for individual jurisdictions and MMF size (not reported). All continuous variables are standardized to have a mean of zero and a standard deviation of one. Sources: Lipper, Bloomberg and author’s calculations.
To further examine investors’ preferences for safety versus yield, I analyze how key MMF characteristics influence MMF growth when yield spreads are rising. Although fund structures vary widely across jurisdictions, MMFs can generally be categorized into public-debt funds, which invest mainly in cash and short-term government (backed) securities, and private-debt funds, which hold a broader range of liquid private instruments. In the United States, public-debt MMFs have become dominant—now accounting for over 80% of taxable MMF assets (Figure 5). This shift, largely driven by post-2015 regulatory reforms, suggests that U.S. investors may prioritize safety and liquidity over yield when selecting fund types.
In contrast, outside the United States, public-debt MMFs are far less prevalent. Their relative size has remained broadly stable or even declined across most other countries in the sample. Public-debt funds hold a notable share only in Korea, where they account for around 40% of the MMF sector, while in other jurisdictions their share is below 20%. In Europe, funds with characteristics equivalent to U.S. government MMFs—namely constant net asset value (CNAV) funds—represent only about 10% of total EU MMF assets.
Figure 5. Public debt MMFs are far less prevalent outside the US (Evolution of public debt MMFs denominated funds)
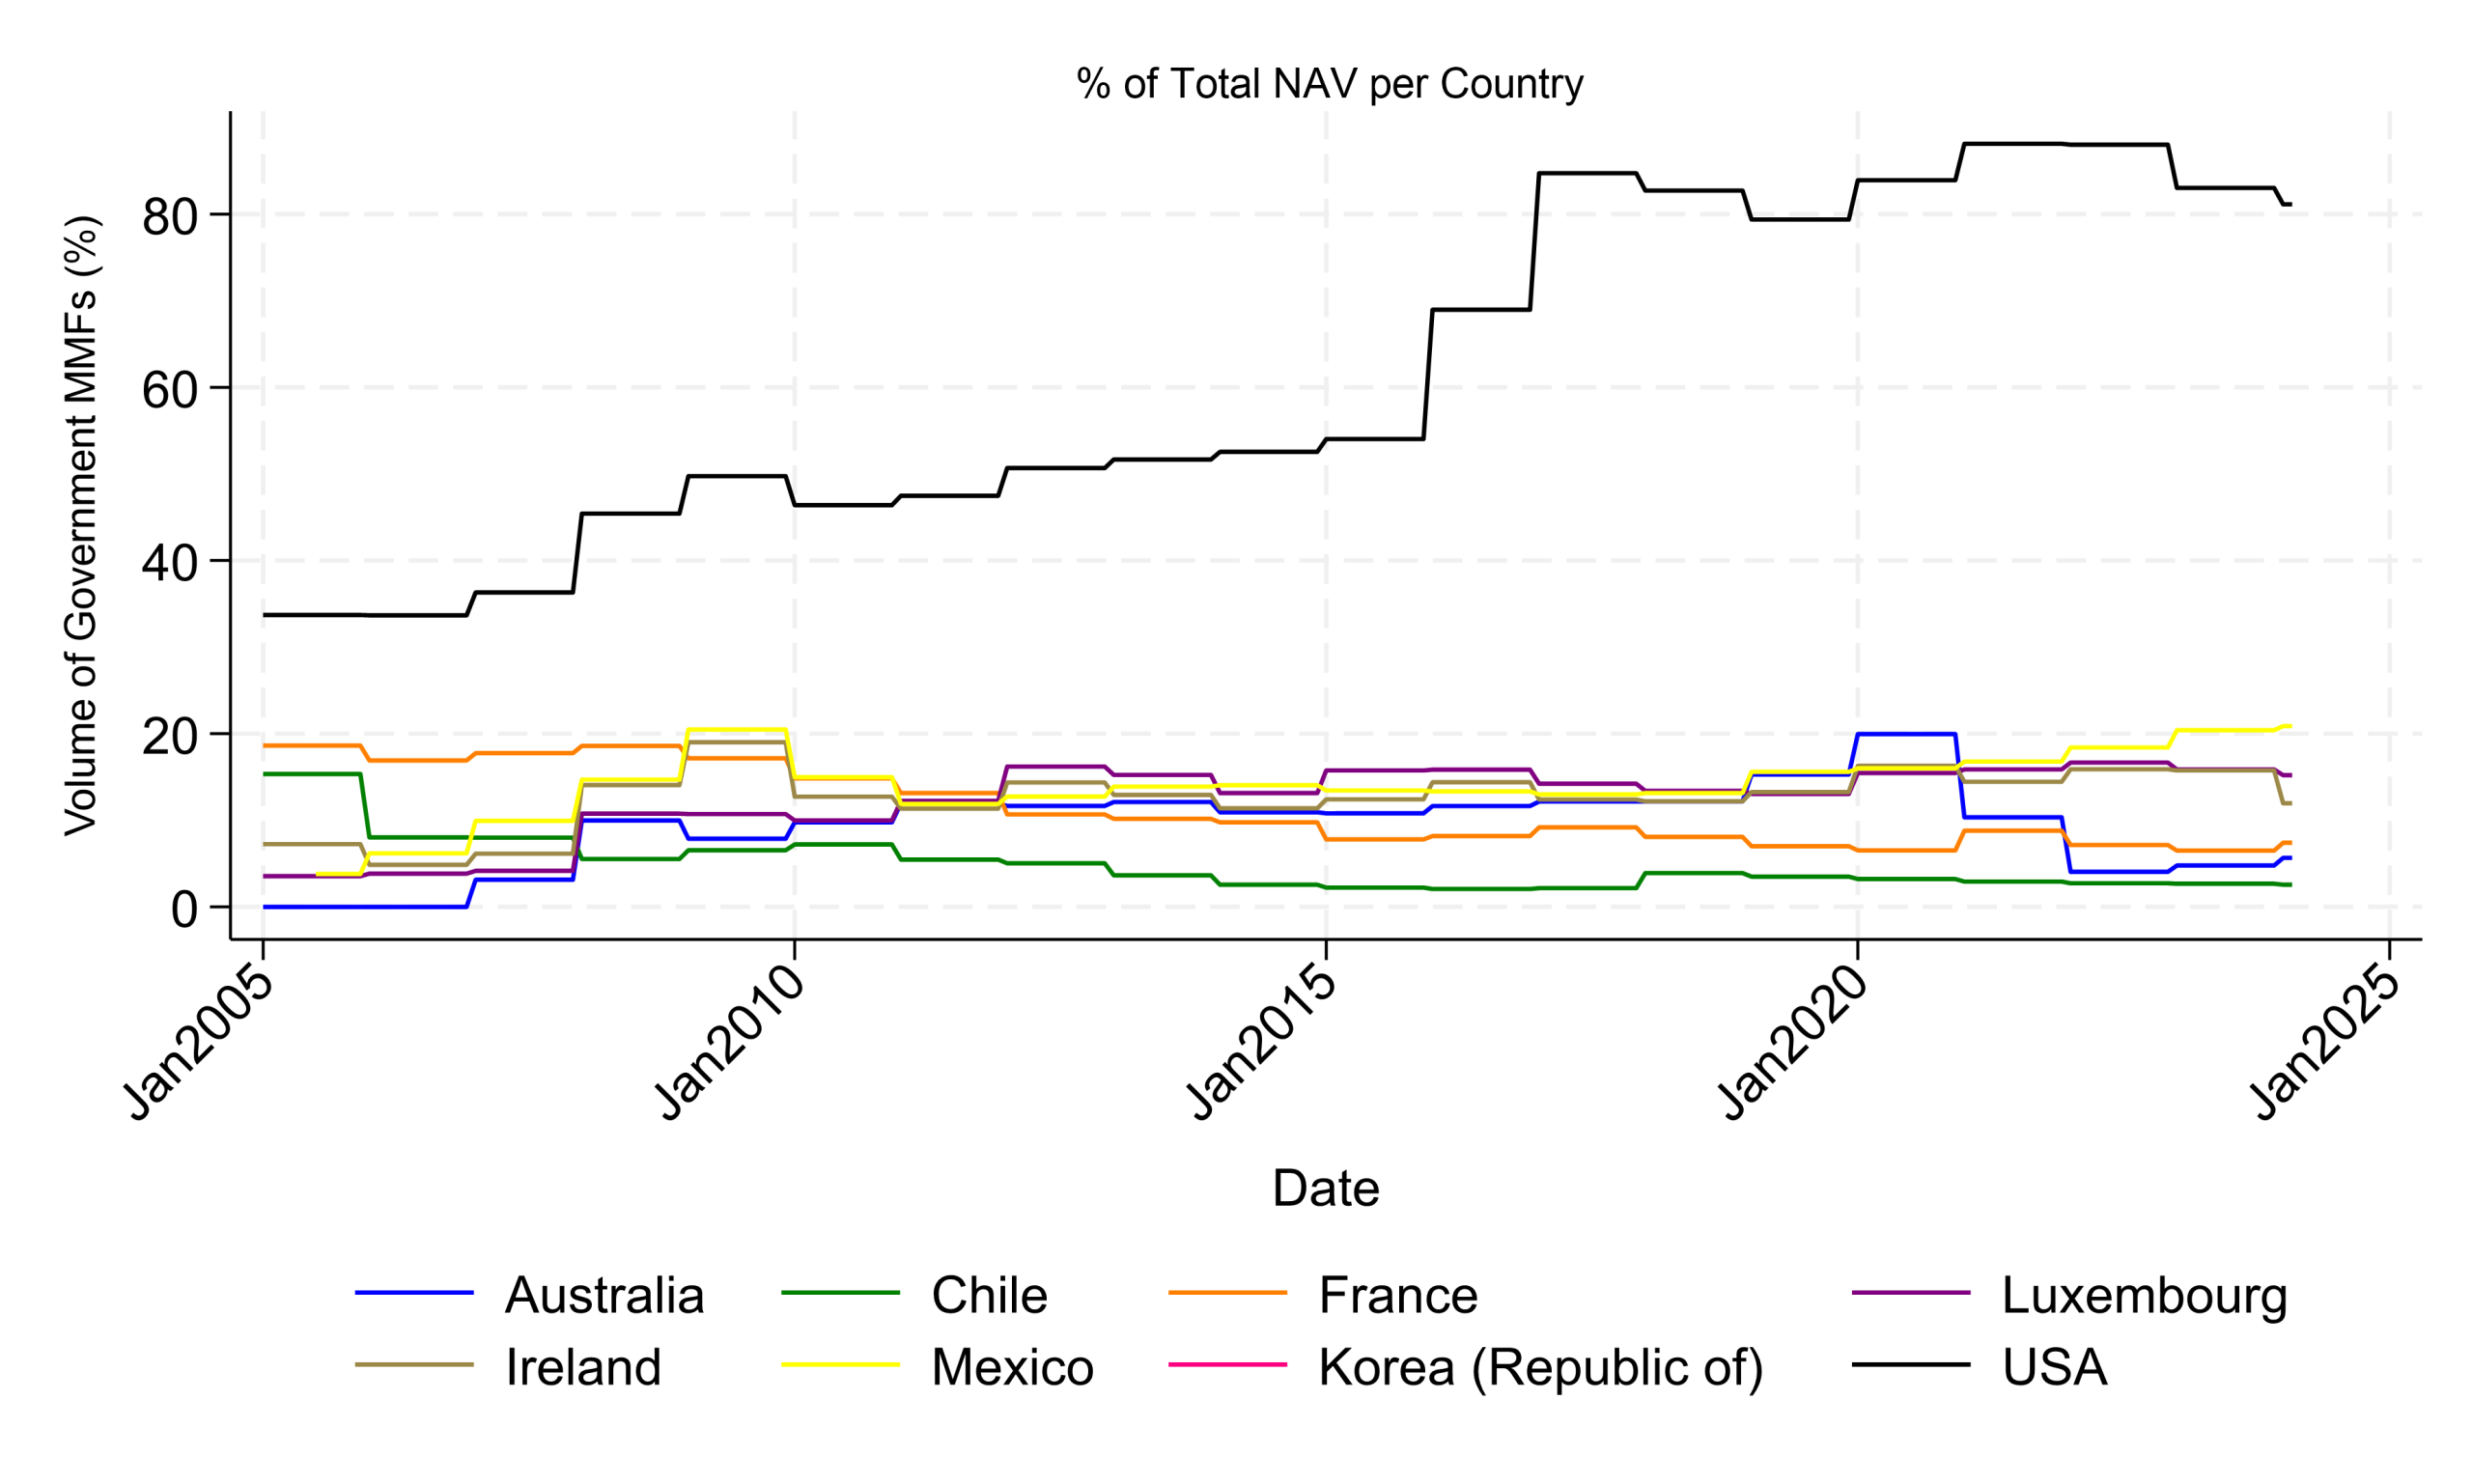
Notes: The Chart plots the evolution of government (public) funds in various jurisdictions. The government MMFs include Government and Treasury MMFs in the US and CNAVs in Europe. For the remaining countries in our sample, the Fund is assigned in the category when the name suggests it is a government MMF. Data run from January 2024 to February 2024. Source: Lipper and author calculations.
Overall, outside the U.S., private-debt MMFs are more prevalent, likely reflecting smaller sovereign debt markets. These funds often impose tighter redemption constraints but can compensate with higher yields. The global perspective of the paper provides a useful setting to assess how MMF type influences growth—especially during periods when yield considerations become the dominant force behind investor behavior.
Results indicate that, on average across all jurisdictions, public-debt MMFs are not consistently associated with higher growth. Their non-dominant role outside the U.S. is confirmed by regional heterogeneity in the results: While public-debt MMFs in the sample grew faster on average than private-debt ones in the U.S. and Asia-Pacific, the opposite pattern emerged in Europe. In the Americas, the difference was insignificant.
Globally, a more consistent pattern is that public-debt MMFs tend to grow less than private-debt ones during periods of widening MMF spreads, suggesting that investors seeking higher yields shift toward private funds (Figure 6). Further results suggest that this yield-driven reallocation is particularly evident after the 2023 banking turmoil, consistent with earlier findings that investor sensitivity to MMF spreads increased.
An exception is the Americas (excluding the U.S.), where public MMFs appear more attractive when spreads rise (Figure 6). This heterogeneity likely reflects differences in market structure, investor composition, and the availability of close cash substitutes. In some emerging markets, public MMFs may offer relatively higher yields than their U.S. or European counterparts, owing to higher local sovereign debt returns.
Figure 6. When MMF spreads rise, public debt MMFs become less attractive
(Estimated impact of public vs private debt MMFs on MMF growth, when the MMF spread is rising)
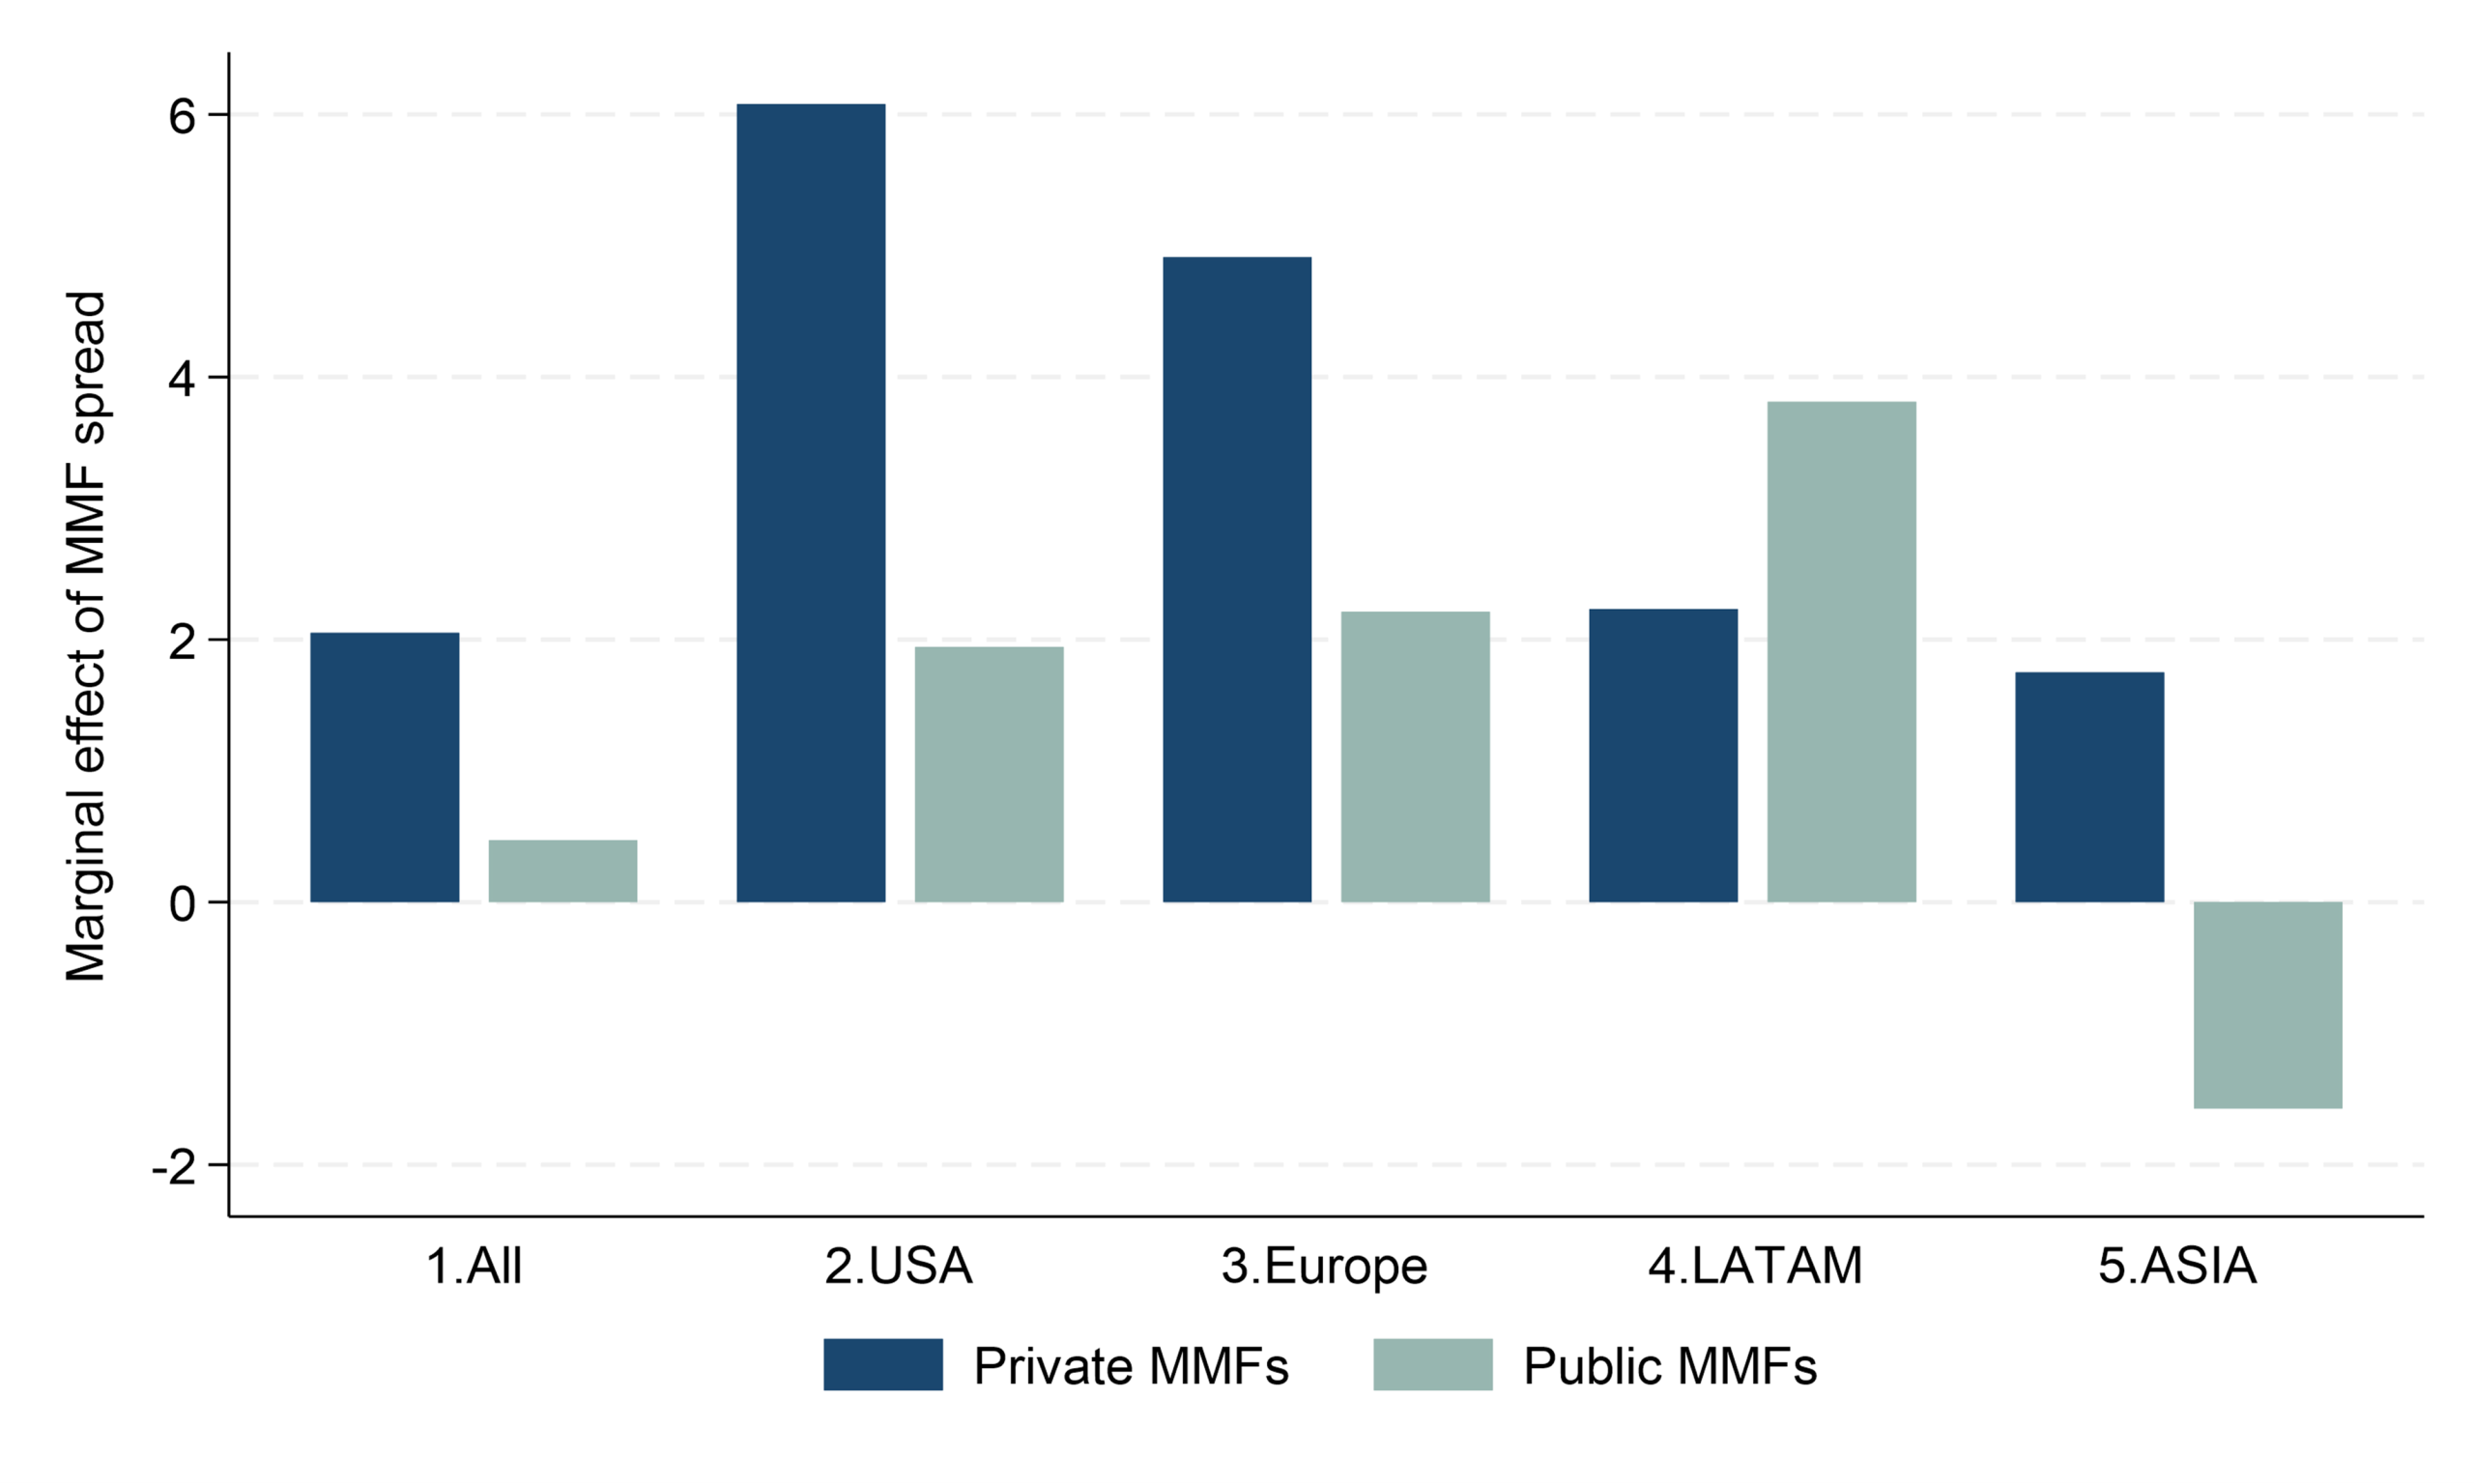
Notes: The Figure reports estimates for all countries and by region of the interaction term between MMF Spreads and a dummy variable, which equals 1 public and 0 for private MMFs. The Americas region includes Brazil, Chile, and Mexico (excluding the U.S.), Europe includes France, Ireland and Luxembourg, and the Asia-Pacific region includes Australia and Korea. Controls include country-specific inflation and GDP, the VIX (common across countries) as a proxy for global risk aversion, and the yield curve spread (10-year minus 2-year). The specifications also control for individual jurisdictions and MMF size (not reported). All continuous variables are standardized to have a mean of zero and a standard deviation of one. Sources: Lipper, Bloomberg and author’s calculations.
Overall, despite different MMF structures and investor dynamics across global regions, yield optimization is a dominant force behind MMF growth, that grows stronger in periods of monetary policy tightening. While investors remained tuned to the theme of yield optimization following the banking turmoil of 2023, there were no clear signs of investor flight into MMFs in that period more than previous hiking periods. With few regional nuances, investors globally appear to reallocate toward MMFs offering higher returns in rising-rate environments, even if stark differences in fund composition remain across regions. Identifying and understanding these nuances is important for policymakers, for a number of reasons: Understanding when and how MMFs expand is crucial, as their rapid growth can amplify systemic risks in times of stress, when the direction of flows may reverse sharply. Moreover, a cyclical behaviour of growth in certain periods may lead to a cyclicality in the attractiveness of other alternatives, such as bank deposits, leading to an acceleration of deposit outflows, potentially complicating monetary policy transmission and straining bank funding. These dynamics underscore the need for robust MMF regulation and oversight. Policymakers should ensure that MMFs maintain adequate liquidity buffers, sound risk management practices, and transparency, so that they can accommodate the rise and bust cycles, mitigate systemic vulnerabilities and support financial stability.
Aldasoro, I., Eren, E., & Huang, W. (2021). Dollar funding of non-US banks through Covid-19. BIS Quarterly Review, March 2021. Available at https://www.bis.org/publ/qtrpdf/r_qt2103c.htm.
Bouveret, Antoine, Antoine Martin, and Patrick E. McCabe. 2022. Money Market Fund Vulnerabilities: A Global Perspective. Finance and Economics Discussion Series 2022-012. Federal Reserve Board, Washington, DC.
Caglio, C., Dlugosz, J., & Rezende, M. (2024). Flight to safety in the regional bank crisis of 2023. Board of Governors of the Federal Reserve System, January 8, 2024. Available at SSRN: https://ssrn.com/abstract=4457140 or http://dx.doi.org/10.2139/ssrn.4457140.
Financial Stability Board (FSB) (2020). Holistic review of the March market turmoil. November 2020. Available at https://www.fsb.org/2020/11/holistic-review-of-the-march-market-turmoil/.
Financial Stability Board (FSB) (2024). Thematic Review on Money Market Fund Reforms: Peer Review Report. Annex 1 provides a comprehensive overview of MMF categories and their key characteristics across jurisdictions. Available at: https://www.fsb.org/uploads/P270224.pdf
Gallagher, Emily, Lawrence Schmidt, Allan Timmermann, and Russ Wermers. (2019). “Investor Information Acquisition and Money Market Fund Risk Rebalancing during the 2011–12 Eurozone Crisis.” The Review of Financial Studies, 32(11), 4390–4436.
Kacperczyk, M., & Schnabl, P. (2010). When safe proved risky: Commercial paper during the financial crisis of 2007-2009. Journal of Economic Perspectives, 24(1), 29–10.
Li L. Y. Li, M. Macchiavelli, and X.Zhou. (2021). Liquidity Restrictions, Runs, and Central Bank Interventions: Evidence from Money Market Funds. Review of Financial Studies, 34.11 (2021): 5402-5437.
Nikolaou, Kleopatra. 2025. MMF Growth During Hiking Cycles: A Global Analysis. IMF Working Paper. International Monetary Fund.
Xiao, K (2020). Monetary transmission through shadow banks. The Review of Financial Studies, vol 33, no 6, pp 2379–420.Yousaf, I., Riaz, Y., & Goodell, J. W. (2023). The impact of the SVB collapse on global financial markets: Substantial but narrow. Finance Research Letters, Elsevier, 55(PB)
I use fund-level data from Lipper. where information on fund-level MMF yields is either not available or not comparable across countries in the sample due to different yield maturities reported in MMFs across jurisdictions The short-term money market rates used instead correspond to the currency of denomination for each MMF. For example USD denominated funds would be assigned the US short-term overnight market rate. See paper for more information.