Authors’ note: The views expressed in this Policy Brief are those of the authors and do not necessarily represent the views of the Banco de España or the Eurosystem, nor those of the International Monetary Fund (IMF).
The sluggish global trade growth following the 2008 financial crisis has sparked a debate on the current state and future trajectory of trade globalization. We study the evolution of trade globalization over the past 25 years in two regions striving for global economic integration, Asia and Latin America. We do so by estimating an indicator of trade globalization that captures the ease of trading internationally with respect to trading domestically. This indicator points to similar trade globalization patterns between the two regions, but a great degree of heterogeneity within them (associated with a set of trade policy instruments, including tariffs, non-tariff measures, WTO membership, and trade agreements). It also shows that trade globalization has been particularly strong in agriculture, mining, and manufacturing, but has lagged in services. We quantify the economic implications of the estimated globalization trends. Our simulations indicate that long-term impacts of globalization on GDP are heterogeneous — with some countries exhibiting substantial gains and others experiencing losses.
The sluggish global trade growth following the 2008 financial crisis has sparked a debate on the current state and future trajectory of trade globalization.
In our recent paper (Campos et al., 2023), we study the evolution of trade globalization over the past 25 years in Asia and Latin America. While during this period both regions strived for global economic integration, differences arise both between and within regions in the pace, sequencing, and content of the trade reforms proposed and implemented, e.g., reductions in tariffs, quantitative export restrictions, foreign exchange limitations, currency overvaluation, etc. (Irwin, 2022).
We estimate an indicator that tracks the evolution of trade globalization in goods and services. This indicator is derived from a theory-consistent version of gravity models that uses both domestic and international trade flows for estimation. It measures the cost of trading internationally relative to the costs of trading domestically. Figure 1 shows how trade globalization has increased over time in each of the four broad sectors, but also suggests the existence of a “two-speed” trade globalization, faster for goods, with services lagging behind. Lower levels of trade integration in services may – at least partially – reflect that an important proportion of trade in services are directly sold in foreign markets by foreign affiliates – i.e. with direct commercial presence – and are often not reported in trade statistics. On the other hand, Figure 1 does not show any systematic difference between the two regions, Asia and Latin America, and the rest of the world.
Figure 1: The increase in trade globalization in Asia and Latin America, by sector
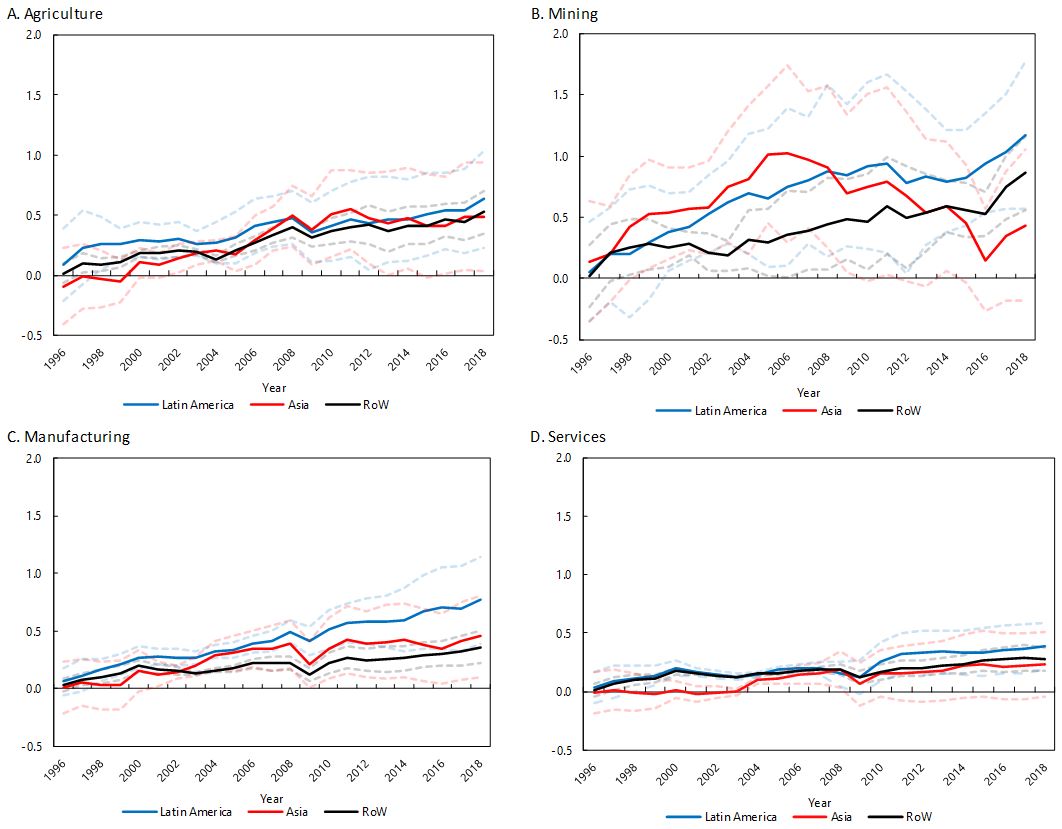 Notes: Solid lines identify our indicator of trade globalization (intended as the ease of trading internationally with respect to trading domestically) for the three regions Asia, Latin America, and Rest of the World. Positive numbers indicate a higher level of trade globalization vis-à-vis 1995. Dashed lines depict a 95% confidence interval.
We also study how trade globalization evolved for all Asian and Latin American countries included in our sample. Overall, the countries that experienced the fastest increase in trade globalization between 1995 and 2018 are Vietnam, China, Cambodia, and India in Asia, and Mexico and Peru in Latin America. However, this picture varies strongly across sectors. In agriculture, Vietnam stands out in Asia, possibly due to its role as one of the world’s largest rice producer and exporter. In mining, Chile and Peru have the highest score in Latin America, mostly reflecting the growing importance of their copper industry. In manufacturing our estimates point to Vietnam, China, Laos and Cambodia in Asia, and Mexico, Peru, and Costa Rica in Latin America as the ones that globalized the most. These results for the Asian economies can be rationalized by the rise of China as the “world factory” after joining the World Trade Organization (WTO), and the consequent incorporation of its neighbors to global value chains (GVCs). In Latin America instead, results may be related to the strengthening of economic ties with the US during this period. NAFTA is also very likely to be one of the main drivers for the evolution of Mexican manufacturing exports. Costa Rica implemented a set of policies, including a trade agreement with the US, that sought to attract FDI and boost exports. These consolidated and further expanded GVCs, reinforcing the presence of multinational enterprises in the country –with spillover effects to domestic suppliers. Peru has progressively been more involved in GVCs, in sectors such as high-quality cotton textile and wearing apparel. Finally, in services, Myanmar, Cambodia, and India in Asia are those standing out. These developments are possibly explained by the strong opening up of the former two to tourism, after decades of political instability, and the rapidly growing ICT sector of the latter.
These differences across countries in the evolution of trade globalization are associated to different dimensions of trade policy, such as tariffs, non-tariff measures, WTO membership, and trade agreements.
Figure 2: Comparing the increase in trade globalization within Asia and Latin America, by sector
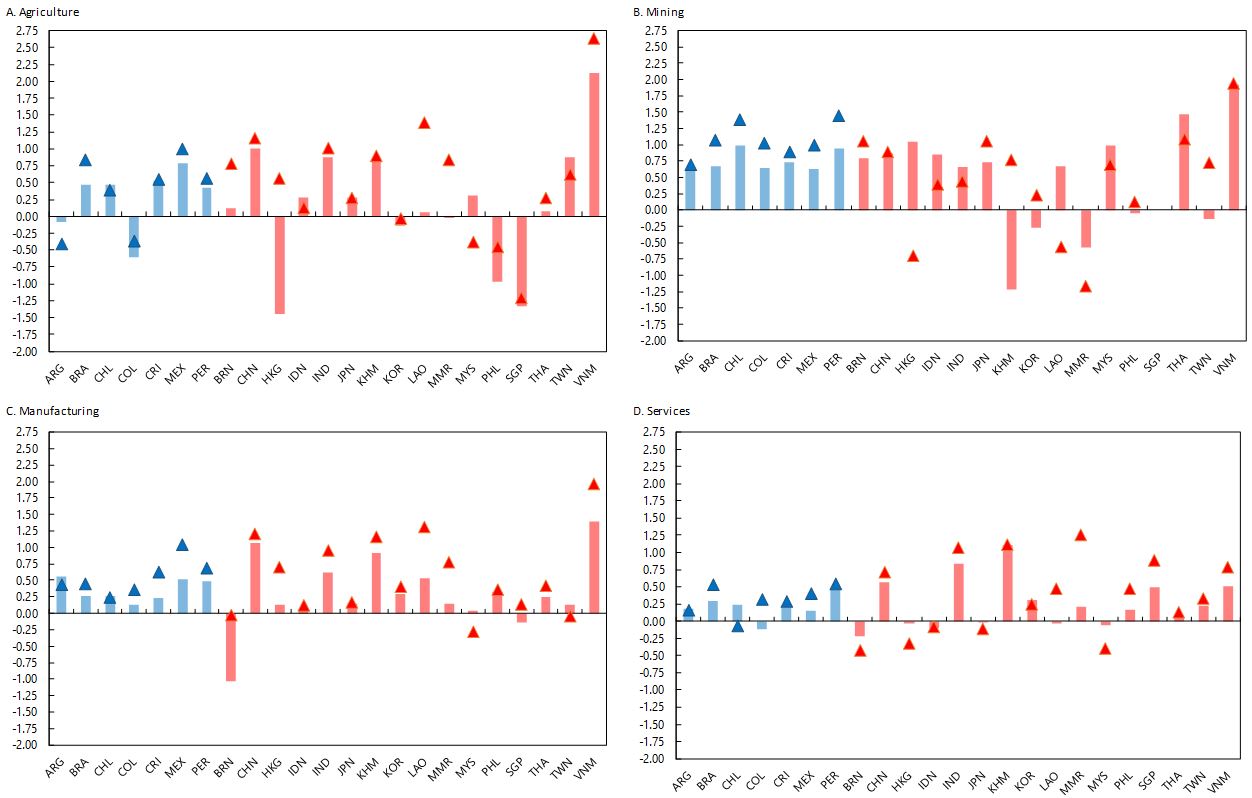 Note: Bars and triangles identify the evolution of trade globalization in 2007 and in 2018, respectively, in each country with respect to its own level of trade globalization in 1995. Therefore, if bars and triangles are above the zero line, this means that the ease of trading internationally for any country c increased during the period 1995-2007 and 1995-2018, respectively. If the triangle is above the bar, it means that country c continued to increase the ease of trading internationally in the period 2007-2018, i.e., after the global financial crisis.
We use a canonical multi-country multi-sector general equilibrium model (Caliendo and Parro, 2015) to calculate the gains from trade implied by the globalization process in Latin America and Asia, decomposing the overall effect of globalization into the role played by the common globalization trend and each country’s idiosyncratic deviation from this common trend.
In our simulations, we take each country individually and solve for the general equilibrium effects of that country returning to its 1995 level of globalization. We report the change in GDP that can be attributed to globalization according to the model, measured as how much higher GDP was in 2018 relative to the level that GDP would have been in the same year if trade costs had been the same as in 1995.
Although the change in trade costs implied by the common globalization trend is the same for all countries, the impact on each country’s GDP is different because countries differ in terms of sector size, linkages between sectors within each country, trade openness and linkages between countries, the share of value added in output in each sector, and the size of the country relative to the rest of the world. However, this is always positive.
Differently, the impact of the idiosyncratic component varies considerably across countries, raising the question of which sectors drove these movements for each country. Our quantification shows that the globalization process has had a significant impact on countries’ GDP. However, there is no single sector that explains the variation across countries (see Figure 3). Many countries, such as Mexico, Costa Rica, Cambodia, China and Vietnam in Asia, experienced a positive differential impact on their GDP, driven by increased globalization in manufacturing. The agricultural sector has played a smaller role overall, but is crucial in explaining Argentina’s relative decline in international integration and the consequent negative impact on GDP of this lower integration. Globalization in mining tends to have a more positive impact in Latin America than in Asia, and differential globalization in services is important in explaining the relative increase in globalization of Singapore and the decrease in Hong Kong.
Figure 3: The role of each sector in explaining the impact of country-specific globalization on GDP
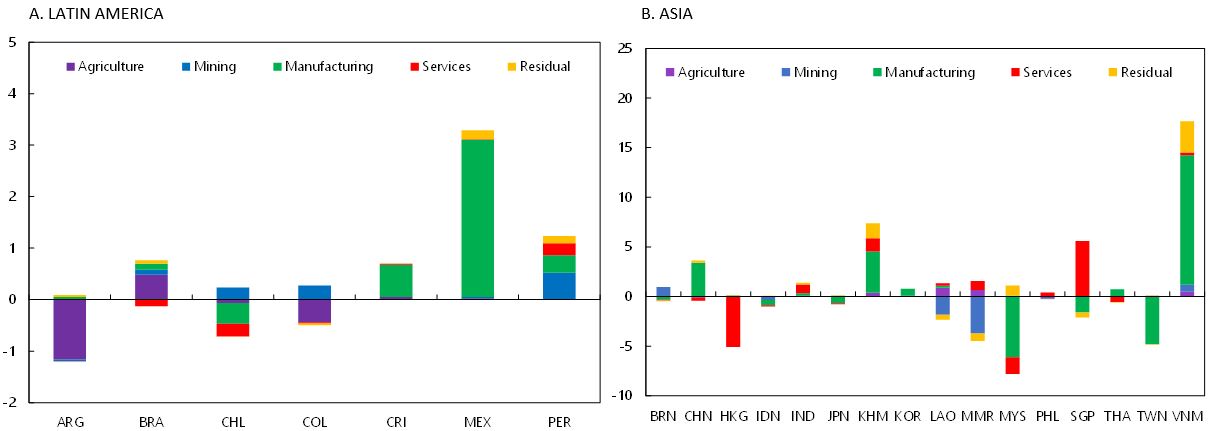 Note: The simulations use a quantitative trade model similar to the one used by Caliendo and Parro (2015). The model includes 66 countries and four aggregate sectors. Trade costs change according to each country’s idiosyncratic deviation from the common globalization trend. The simulations change the international trade costs of one country, and on sector at a time, leaving all other trade costs unchanged. In the counterfactual scenario, trade costs are set to their 1995 level. The results show the percentage change in GDP from a situation with high trade costs (the counterfactual) to one with low trade costs (the baseline).
Caliendo L. and F. Parro (2015), “Estimates of the Trade and Welfare Effects of NAFTA”, The Review of Economic Studies, 82:1-44.
Campos R.G., S. Pienknagura, and J. Timini (2023), “How far has globalization gone? A tale of two regions”, Banco de España Working Paper nº2329.
Irwin D.A. (2022), “The Trade Reform Wave of 1985-1995”, NBER Working Paper No. 29973, April.