This policy note is based on EC Discussion Paper 228. The views expressed are those of the authors and not necessarily those of the European Commission.
House prices have risen sharply across the European Union over the past decade, following repeated cycles of boom, correction, and renewed growth. Recent price increases have been driven largely by structural and demographic factors, outpacing income growth and eroding affordability, particularly under higher interest rates. Weakly developed rental markets in many Member States have provided limited alternatives to ownership. Housing demand has been supported by income and wealth growth, favourable credit conditions, urbanisation, migration, and changing family structures, while institutional buyers and short-term rentals have gained importance. On the supply side, construction has failed to keep pace with demand due to regulatory barriers, labour shortages, and high land prices, with renovation often prioritised over new building. Addressing housing affordability requires a balanced policy mix combining supply-side reforms—such as land-use changes, social housing investment, and infrastructure improvements—with prudent macroprudential and fiscal measures. Demand-side subsidies, by contrast, tend to amplify price pressures. Given the heterogeneity of housing markets across the EU, effective policy responses call for coordinated yet locally tailored actions across EU, national, and municipal levels.
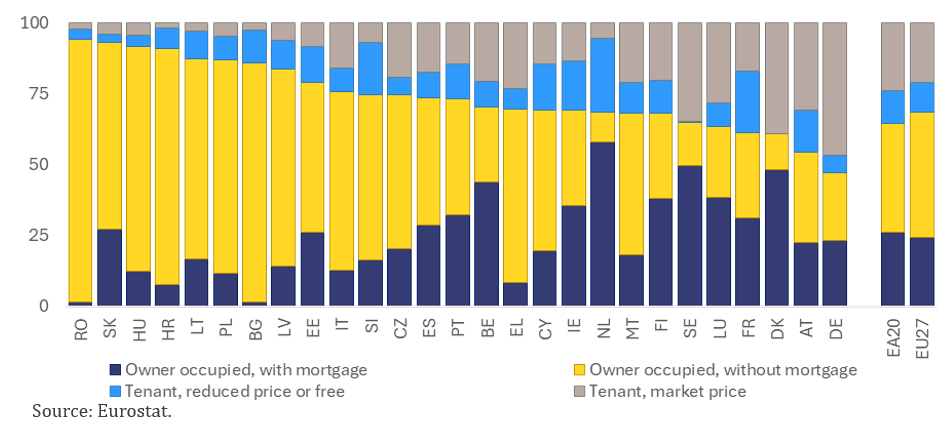
Housing markets across the EU exhibit wide structural diversity in ownership patterns, financing models, and tenure forms. Home-ownership rates range from around 50 % in Germany to 90 % in Romania and Slovakia (Graph 1), reflecting historical legacies such as post-transition privatisation, as well as legal frameworks, fiscal incentives, and cultural preferences. Since 2015, homeownership has fallen by about 2 pps. EU-wide, with sharper declines among young adults, who increasingly remain in the parental home or turn to renting due to affordability and labour-market constraints. Mortgage incidence varies widely: while most owners in western and northern Europe finance their homes through mortgages, homeownership in Central and Eastern Europe resulted from post-socialist privatisation rather than credit expansion. At the same time, the share of tenants in the EU has risen to about one-third of the population and there are pronounced differences between the market-price and reduced-price rental segments. In several countries, social housing shortages have led to long waiting lists and stimulated alternative tenure models such as cooperatives, cohousing, and shared housing, which enhance affordability and community engagement but face regulatory and financing barriers.
Graph 1. Distribution of population by tenure status, in 2024 (% of population)
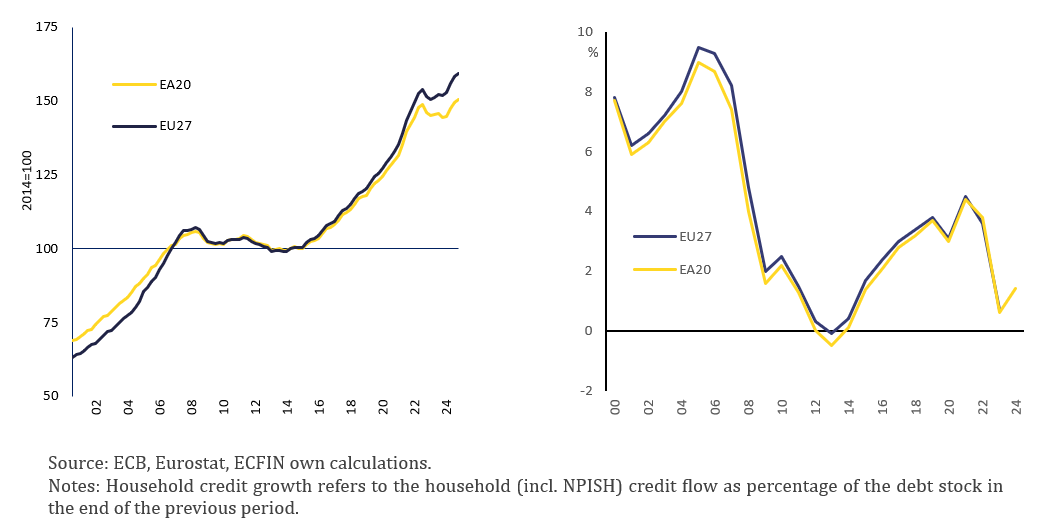
Since the start of the century, house prices have nearly tripled in nominal terms across the EU and euro area. As shown in Graph 2 (left panel), this trend can be broken down into three broad phases. First, there was strong growth in the run-up to the global financial crisis of 2008. Second, the period from 2008 to 2014 showed a small correction in house prices overall, but the price correction was substantial in certain countries which had experienced house price booms. Third, house price growth picked up again from around 2014 and further accelerated with the pandemic in 2020. While there was a short-lived correction in 2023, nominal house prices have recently resumed their growth.
The relationship between house prices, mortgage credit and household debt has evolved significantly over the past two decades. During the early 2000s, rapid credit expansion drove house price inflation and rising household indebtedness, peaking before the 2008 global financial crisis (Graph 2, right panel). Household debt became a key source of macro-financial instability, particularly in highly leveraged countries like Denmark, Ireland, Spain, and the Baltics. Since 2010, the household debt-to-income ratio has gradually declined due to reduced borrowing, stronger income growth, and inflation eroding real debt burdens, especially after the pandemic. Macroprudential measures introduced in the 2010s also helped restrain excessive credit growth. The pandemic briefly reignited mortgage credit, as eased macroprudential conditions and low rates spurred lending in 2021–2022. However, the sharp rise in interest rates that began in 2022 triggered a steep credit slowdown and house price corrections, especially in countries with previously strong house price growth such as Sweden, Germany, France, and Luxembourg. As of 2025, the household debt ratio (as % of household disposable income) remains above 100% in the Netherlands, Luxembourg, Denmark and Sweden, while the lowest levels are recorded in Romania, Hungary, Latvia and Lithuania despite dynamic credit growth in the last decade. Still, debt bearing capacity differs across EU Member States, reflecting also significant differences in household wealth.
Graph 2. Nominal house prices (lhs), and household credit growth (rhs) in the EU and EA, 2000‑2024
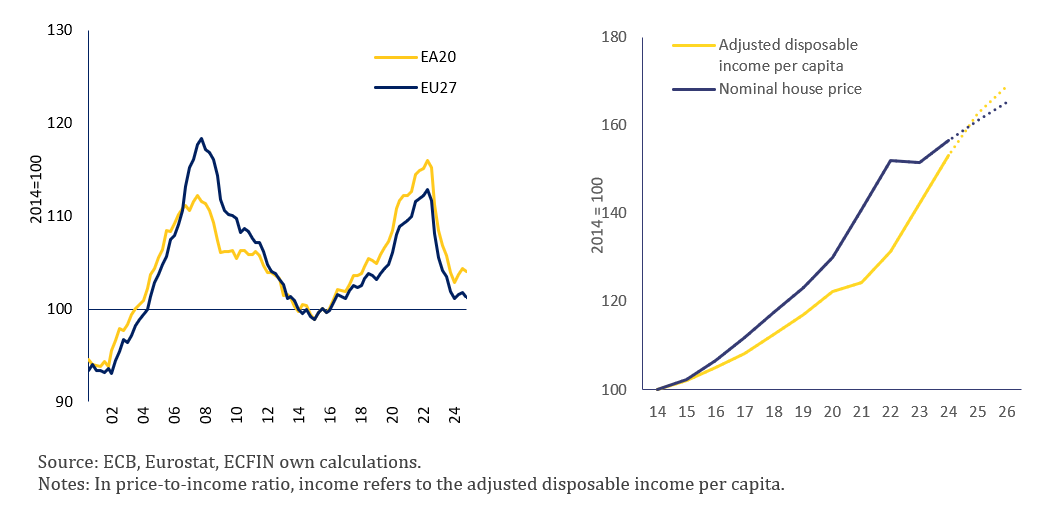
Across the EU, house prices have grown much faster than incomes over the past decade, resulting in a sustained deterioration in housing affordability.1 Since around 2016, house price growth began to outpace income growth (Graph 3). The gap widened sharply during the pandemic and, despite some correction since 2022, left the house price-to-income ratio roughly higher in 2025 than in 2014. The largest increases in price-to-income ratios — exceeding 20% — occurred in Portugal, the Netherlands, Hungary, Luxembourg, Ireland, Czechia, and Austria, while countries such as Cyprus, and Finland experienced relative decreases. In much of Central and Eastern Europe, strong income growth since 2007, particularly in Bulgaria, Romania, Latvia, Poland, and Lithuania, has offset nominal price rises. Nonetheless, these averages mask inequalities, as lower-income and younger households have been disproportionately affected by worsening housing affordability.
Graph 3. Price-to-income ratio (lhs) EU and EA, 2000-2024, and EU nominal house price and income growth (rhs), 2013-2026
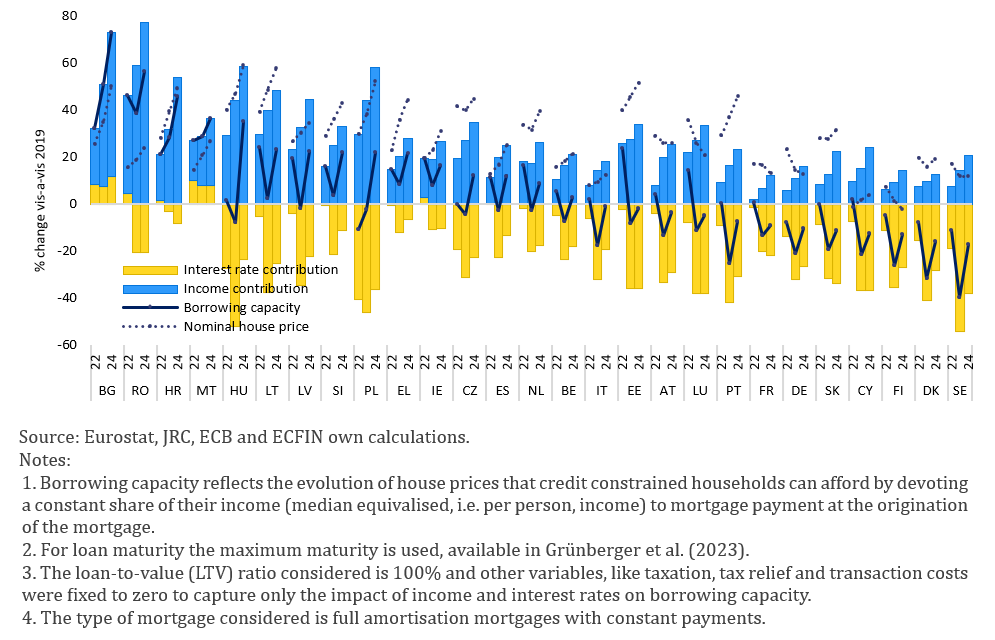
Mortgage financing remains the dominant route to homeownership, making housing affordability highly sensitive to credit conditions. For households reliant on mortgages financing, purchase affordability depends not only on house prices and incomes but also on credit conditions — especially interest rates, which determine the overall cost of borrowing. While low interest rates in the past decade helped offset rising house prices, the surge in borrowing costs after 2022 has sharply reduced how much households can afford to borrow. Estimates show that household borrowing capacity in 2024 is lower than in 2019 in roughly half of EU Member States, with the decline driven by higher interest rates despite income growth mitigating the effect in some countries. Overall, between 2019 and 2024, house prices have risen faster than borrowing capacity in nearly all EU countries (Graph 4), indicating a deterioration in purchase affordability for mortgage-dependent households. As a result, the share of income required to service a typical mortgage has increased across most of the EU, now exceeding 40% of household income in nine countries —underscoring a broad and persistent rise in the financial burden of homeownership.
Graph 4. Households’ borrowing capacity and house price changes, % change vis-à-vis 2019
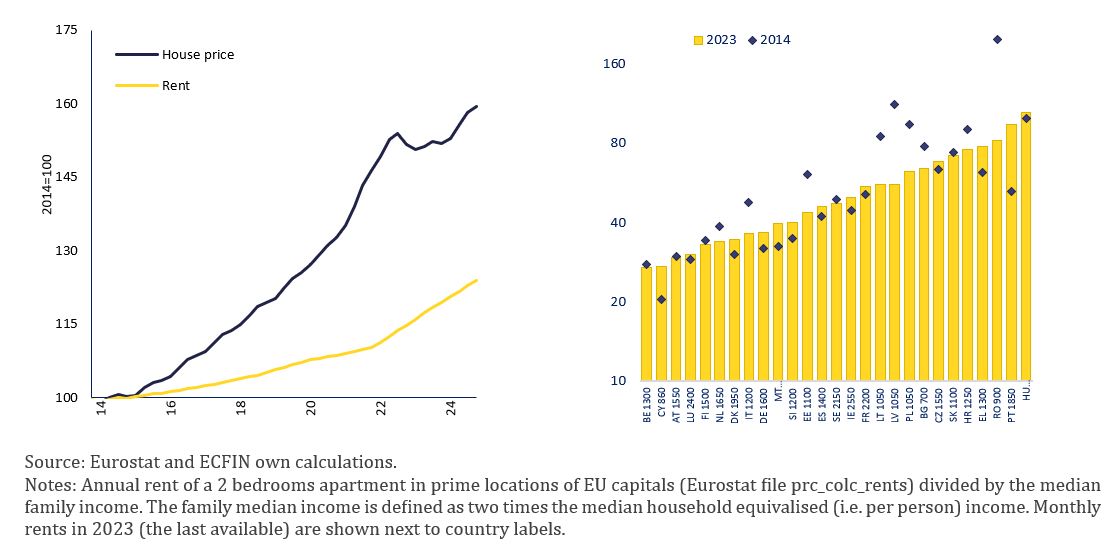
In many EU countries, rental markets remain underdeveloped and do not provide a viable alternative to homeownership. Over the past decade, rents for existing contracts in the EU have risen much more slowly than house prices, making renting appear relatively more affordable when measured by standard indices (Graph 5, left panel). However, these indices largely reflect only existing contracts and often exclude new leases, which have surged in many locations. Indexation rules limit increases on existing rents, while higher house prices for buy-to-let investors drive up rents on new contracts. This creates distributional pressures, particularly for younger adults entering the rental market. In major cities, new rental costs remain exceptionally high, often exceeding 50% of the income of a two-person household, highlighting persistent affordability challenges despite the slower growth of standard rents (Graph 5, right panel).
Graph 5. House prices and rental prices in the EU, indexed on 2014 (lhs); new rent in prime locations as a % of income, selected locations, 2014 and 2023 (rhs)
High housing costs in urban areas constrain labour mobility and economic growth. High house prices in urban areas can act as a disincentive for workers from moving to dynamic economic regions. This can result in labour shortages in rapidly developing regions, hampering growth, innovation, and productivity. Certain professions – including key workers such as teachers, emergency workers, healthcare professionals and care staff – may be priced out of urban areas. Economic studies show that decreasing housing affordability has a negative effect on economic growth in large urban areas.2 As a large share of economic growth comes from these areas, improving affordability could significantly benefit economic activity. At the same time, improving housing affordability can strengthen social cohesion and support family formation.3
House price dynamics play a crucial role in macroeconomic and financial stability, with elevated valuations posing both short- and long-term risks. Elevated valuations raise concerns about sustainability, as future growth must either be supported by fundamentals (income, rents) or risk a correction. In an environment of rising interest rates or construction costs, high valuations may expose households, lenders, and economies to downside risks.4 But even in the absence of booms and busts, house price imbalances are also found to have long-term effects, with house price overvaluations slowing economic growth in the long term,5 notably due displacement of capital, decline of labour mobility and reduction of household consumption.
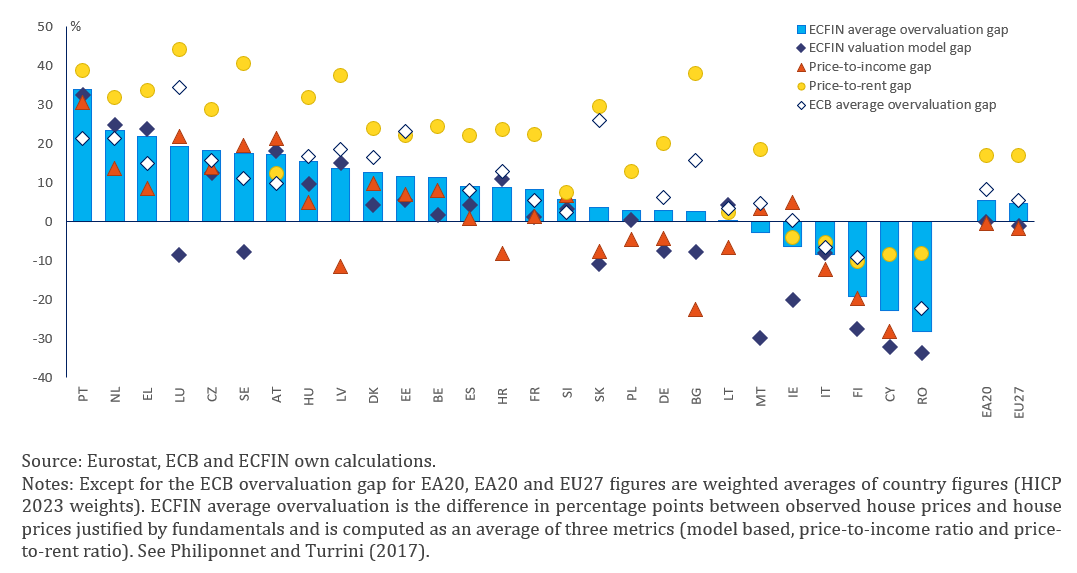
The Commission assesses house price overvaluation using two benchmark indicators and an econometric valuation model. The benchmarks are based on long-term averages of the price-to-income and price-to-rent ratios. The valuation model utilises an econometric approach based on a cointegration analysis6 taking into account income, interest rates, demographics and housing supply, and is tailored to each country. As of 2024 (Graph 6), Portugal emerged as the most overvalued housing market in the EU, followed by the Netherlands. This ranking also reflects notable house price adjustment in previously most overvalued markets such as Luxembourg, Sweden and Austria, where the priced declined between 2022 and 2024 reducing their overvaluation. On the contrary, strong house price growth of recent years pushed countries such as Portugal and Greece into overvaluation territory.
Graph 6. Estimates of over-valuation according to the Commission and ECB methodologies 2024
Several factors underpin the strong demand for housing. These drivers of housing demand include rising incomes (in some EU Member States), household wealth accumulation (especially for older cohorts), and favourable credit conditions for extended periods. Demographic and structural changes — such as urbanisation, smaller household sizes and recently remote‑work trends7 — have also increased the demand for additional or larger housing units. Further, the ‘financialisation’ of housing (via institutional investment, second‑home buying and short‑term rentals) has contributed to elevated price levels, particularly in high‑pressure markets.
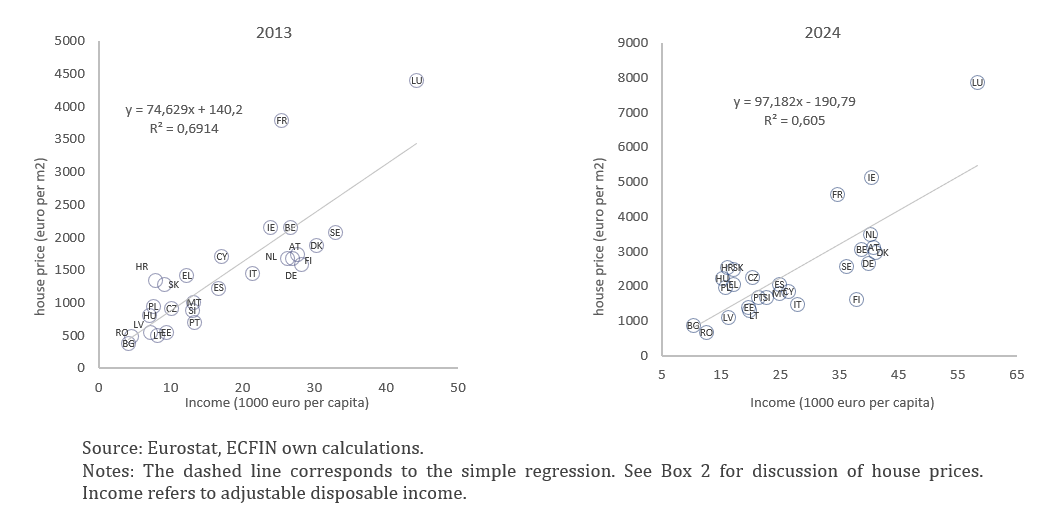
Household incomes are the key determinant of housing demand, closely correlating with house prices across EU countries. The empirical evidence indicates that housing demand has a high income-elasticity. This means that as incomes increase, so does the demand for housing.8 Graph 7 shows the close correlation between the average income per capita (in euro) and nominal house prices per square metre, in 2013 and 2024. However, despite this overall pattern, the house price level in some countries – such as in Finland or Italy in 2023 – is relatively low considering the average income or relatively high – in Ireland and Luxembourg for instance.
Graph 7. House price per m2 vs household income per capita, 2013 and 2024
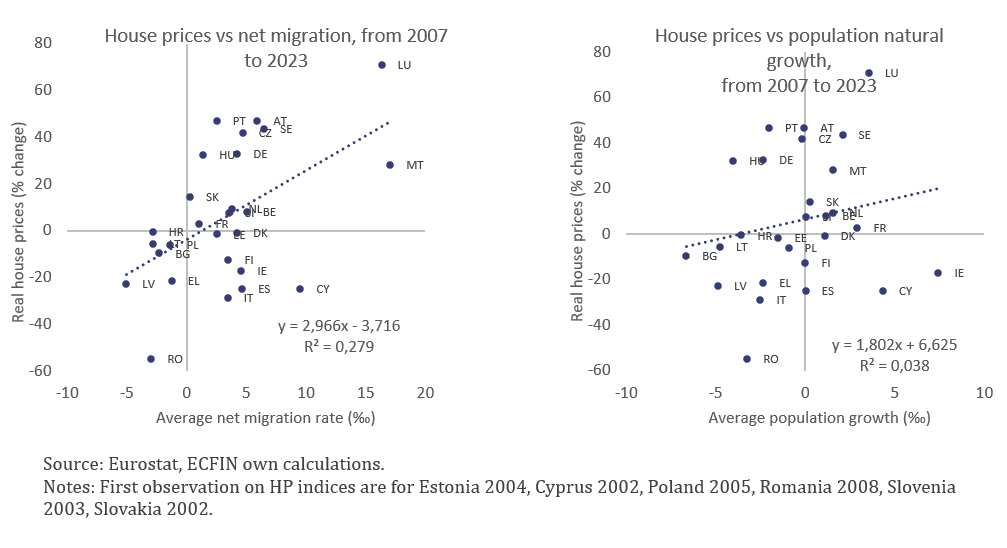
Long-term demographic factors, notably urbanisation and changing household structures, shape housing demand, while migration can have significant short-term effects. The urbanisation process in the EU has been characterised by a steady long-term migration of populations from rural to urban areas, driven mainly by employment opportunities. The share of population living in urban areas has increased from less than 70%9 of the population in 1980 to slightly below 80% in 2024 and it is expected to reach 84% by 205010. The demand for housing is affected by migration, which is most closely linked to rising house prices in urban areas. In the short term, migration stands out as a pivotal factor driving up property values, more than natural population growth (see Graph 8). Migrants tend to disproportionately settle in urban centres such as capital cities, attracted by better economic opportunities. Inward migration can exacerbate existing housing shortages and place additional strain on urban infrastructure and services. Last not the least, housing demand have been also affected by changes in family structure. Traditional family models evolved to include an increase in single-person households, cohabiting couples, and shared living arrangements. These shifts have fuelled demand for smaller, more flexible living spaces that can accommodate various household compositions. Most EU countries have seen an increase in the number of households over the last 15 years, in many cases of over 20%. The prevalence of single-person households has heightened the need for compact apartments in urban areas, intensifying competition in this segment of the housing market.
Graph 8. House prices vs selected population indicators in the EU countries, 2007-2023
Over the last decade, housing demand has been increasingly shaped by factors such as teleworking, tourism, second-home purchases, and institutional investment. Since the pandemic, working from home has become a widespread practice. As a result, workers have been re-evaluating their housing needs, with many seeking larger properties located farther away from city centres to accommodate a dedicated home office space. Teleworking is mainly feasible for office workers.11 Some studies have shown that teleworking incentivises workers in high-productivity (and high property price) cities to move to lower-productivity cities, where property is more affordable,12 which may affect relative house prices across cities. Another factor is tourism. While tourism activity has been on the rise in Europe for several decades, the expansion of short-term rentals in the last decade strengthened the link between tourism and the housing market. The expansion of home-sharing platforms has disrupted the traditional housing market by blurring the lines between short-term and long-term rentals. There is growing empirical evidence suggesting that the increase in tourism in general, and the increase of home-sharing platforms in particular, have contributed to a rise in rents and housing prices in some prime location such as historic centres of cities.13 Second residences are another factor pushing up housing demand. While younger cohorts tend to focus on purchasing their first home, older cohorts increasingly invest in a second residence—either in major cities as a rental investment, or in tourist areas for leisure purposes. Last, there has been an increase in the presence of institutional investors – which is sometimes referred to as financialisation of housing14 – in the major European cities, which might have contributed to house price growth.15 Overall, data from the ECB shows that the proportion of non-resident investors in the EU’s housing market increased from 10.4% in 2010 to 14.1% in 2020, coinciding with a reduction in home ownership.16 The presence of institutional investors seems to weaken, probably at least temporarily, the link between house price growth and local economic fundamentals and strengthens the sensitivity of the housing market to monetary policy and financial market developments.17
Over the last decade, the supply of new homes has failed to keep up with rising demand, constrained by regulatory, cost, and labour factors. A range of obstacles has hindered the construction of new housing units.18 Key supply‑side constraints include land‑use and zoning regulations, lengthy permitting procedures, labour and materials shortages, and rising land and construction costs. These constraints reduce supply responsiveness and prolong periods during which price growth can exceed fundamentals. The responsiveness of new housing supply to changes in house prices – known as the supply elasticity – has declined over the past decades in many developed countries.19 In the US, the reasons for the decline in the supply elasticity was linked to the tightening of land use regulation but also to a decline in productivity in the construction sector, which makes the construction of housing more expensive.20 The impact of both factors is likely more prominent in Europe21 where housing supply elasticity is believed to be significantly lower (e.g. around 2-4% in the US vs. 0-2% in EU countries).22 Limited country-level evidence23 points to a decline of supply elasticity across time and to the fact that less elastic housing supply at city levels has an adverse impact on economic growth.24
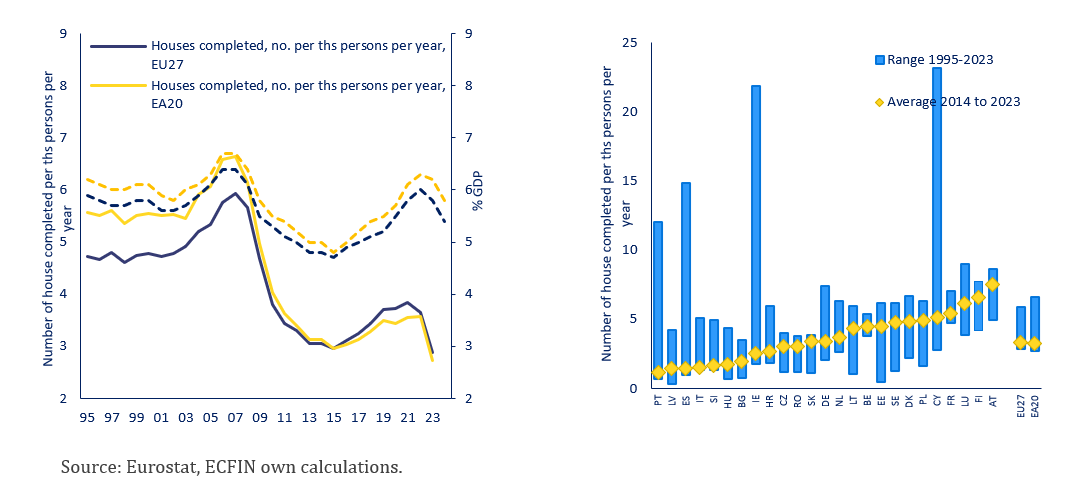
Trends in residential investment further illustrate supply constraints. Residential investment fell sharply after the global financial crisis – in part because its high levels had been induced by housing bubbles (Graph 9). Since the recovery in 2013, the share of residential investments in GDP started to gradually recover. Despite the recent drop, it currently stands at around 5% of GDP, which is similar to the levels observed before 2008. However, over the same periods, new construction has been declining, reaching historical lows. The gap between residential investment needs and new construction is driven by different factors, notably by the increase in building costs and the relative increase in the resources invested in house renovations.
Graph 9. Residential investment (% of GDP) vs newly completed dwelling
(per 1000 inhabitants) in the EU, 1995-2023
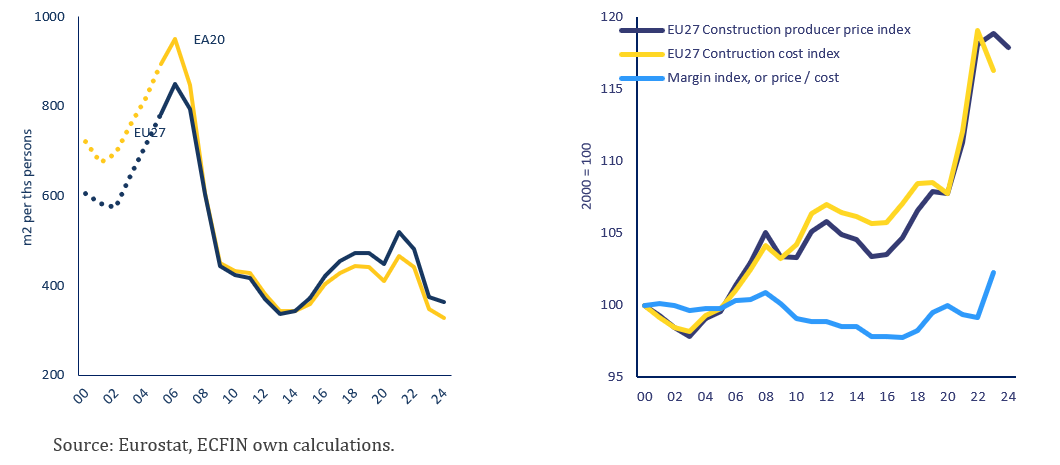
Recent trends in building permits and sharply rising construction costs highlight mounting pressures on new housing supply across the EU.25 While there was some upward trend in permits until 2021, they have declined to historical lows since 2022 (Graph 10, left panel). While the numbers may not be fully comparable between countries, the historical comparison shows that building permits are close to historical lows in most EU countries. For nearly two decades (2000–2020), construction prices remained relatively stable in real terms. However, costs increased strongly over the pandemic and even more so in the years since, with construction costs rising faster than the already high inflation (Graph 10, right panel). Between 2020 and 2022, the cost of labour and prices of materials surged significantly, exacerbated by supply chain disruptions and soaring commodity prices, including energy. In 2022, higher interest rates became another factor putting upward pressure on construction costs.
Graph 10. Building permits (m2 per 1000 inhabitants) and construction producer price adjusted to inflation (2014=100) in the EU, 2000-2024
Rising land values, rather than construction costs, have been the main driver of long-term house price increases in the EU and other developed economies. This trend is evident in developed nations, where housing prices have been consistently increasing since the 1950s, mainly due to escalating land values rather than construction expenses.26 In the EU, around 75% of land is utilised for agriculture and forestry, with only 3% for residential purposes. Over the past decade, major cities in the EU have experienced significant increases in land values. While a comparable disaggregated data base on land prices is not available on the EU-wide level, there have been attempts to provide country-level estimates27 using different methods.28 These data suggest that average land values have been increasing faster than house prices themselves. This is consistent with land values significantly driving house price variations in the US29 and other advances economies such Japan, Australia, or Canada.
Housing market outcomes are shaped both by policies directly targeting housing and by broader policies that indirectly affect housing, sometimes with even greater impact. Policies directly aiming to affect housing outcomes include social housing, rental market regulation, homeownership support policies and zoning regulations. Policies which do not primarily target housing developments but have a significant impact on them include fiscal policy, macroprudential policies, environmental and energy policies, and taxation. The impact of these latter policies can be greater than the impact of direct policies. As a result, addressing affordability challenges necessitates a specific policy mix tailored to both national or local (regional or city-specific) housing market conditions and taking on board all different policy areas that ultimately affect housing markets.
While public policies addressing housing can target either demand or supply, evidence suggests that supply-side measures are generally more effective in improving housing affordability. Both theory and evidence from the economic literature suggest that supply-side measures are generally effective and therefore offer the most promising avenue for addressing rising house prices. These measures include streamlining permitting, revising zoning laws, increasing buildable land, reforming property taxes, increasing investment in social housing, reforming the rental market, improving transport and other supportive infrastructure.30 Instead, a majority of European governments have introduced demand-side policies, such as mortgage interest deductibility or first-time buyer grants, interest-rate subsidies, which can have detrimental long-term effects.31 While such policies appear to facilitate access to housing in the short term, they can increase demand and fuel price increases over time. Furthermore, there is generally broad public support for policies that are punitive towards property owners, including rent control and restrictions on home-buying by institutional investors.32 While these policies can have positive short-term effects on prices, over the longer term they can lead to lower housing investment and supply – unless very carefully calibrated. Overall, there is clear support to the construction of means-tested affordable housing, but less so for policies conducive of increased housing supply at market prices.33 Hence, addressing structural drivers of house price growth is politically challenging.34
Following years of price increases, housing affordability has become a major political and social concern across the EU, particularly in urban areas. Over the past decade, house prices have grown on average faster than household incomes. More recently, rising financing costs have further constrained purchase affordability. While rents for existing contracts have increased more moderately — partly due to regulatory reasons—new rents have risen sharply, making renting a less viable alternative to homeownership. These pressures are particularly acute in urban areas and among vulnerable groups, including young people and families. The consequences are both economic, in terms of reduced labour mobility and weaker growth, and social, as housing challenges affect family formation and social cohesion.
Rising house prices over the past decade reflect constrained supply and regulatory barriers limiting new housing delivery. Over the last decade, the supply of new homes has failed to keep pace with demand, with construction activity remaining at historically low levels. As a result, rising demand linked to income growth has primarily translated into higher prices rather than increased supply. Supply constraints are often reinforced by complex regulatory environments. While some regulations stem from EU legislation, many are set at the national or local level, and additional layers introduced by Member States or municipalities can hinder overall housing delivery and affordability.
Addressing Europe’s housing affordability crisis requires a decisive shift toward structural, long-term solutions focused on increasing housing supply, improving affordability, and enhancing construction efficiency, alongside prudent macroprudential and fiscal frameworks. Policy efforts should focus on removing regulatory bottlenecks that constrain new construction, simplifying and accelerating permitting procedures, and ensuring that land-use planning supports residential development where demand is strongest. Public investment and incentives should prioritise the construction and renovation of affordable and energy-efficient homes, leveraging EU funds and green finance instruments. Enhancing productivity in the construction sector through digitalisation, industrialised building methods, and training could also help to reduce costs and shorten delivery times. At the same time, demand-side measures should be carefully targeted to vulnerable groups to avoid inflating prices further. In addition, prudent macroprudential and fiscal frameworks are essential to prevent excessive credit growth and mitigate housing market volatility. Measures such as loan-to-value and debt-service-to-income limits, countercyclical capital buffers, and the reduction of distortive tax incentives in favor of more neutral housing taxation can help curb excessive borrowing and contain house price inflation in supply-constrained markets. Greater use of recurrent property or land-value taxation, along with targeted measures on vacant properties, can further discourage speculative investment and support long-term housing market stability.
While household income is commonly compared with house prices to assess housing affordability, other relevant indicators such as mortgage rates are considered below.
Anthony, J., (2022): Housing Affordability and Economic Growth. Housing Policy Debate, Vol. 33.
van Wijk, D., and P. Feijten (2025): Rising House Prices, Falling Fertility? How Rising House Prices Widen Fertility Differences between Tenure Groups. Eur J Population Vol. 41, 33.
Albuquerque, B., E. Cerutti, Y. Kido and R. Varghese (2025): Not all Housing Cycles are Created Equal: Macroeconomic Consequences of Housing Booms. IMF Working Paper, No. WP/25/50.
Custas, J.C., M. Kukk, and N. Levenko (2022): Misalignments in house prices and economic growth in Europe. Applied Economics, Vol. 55, Issue 28, 3215-3237.
Details of the original model are outlined in Philiponnet, N. and A. Turrini (2017): Assessing house price developments in the EU, European Economy – Discussion Papers, No. 048. The current approach features some modifications. Namely, Vector Error Correction Model estimated for a panel of all EU countries, using a system of six fundamental variables; the nominal house price, total population, housing stock, real disposable income per capita (household income expanded with GNI, instead of GNI that was originally used), real long-term interest (mortgage interest rates database expanded with government long-term interest rates instead of government long-term interest rates that were originally used) rate and the private expenditure deflator. These variables capture the fundamental drivers of house prices, that are outside the short or medium-term influence of policies and are not subject to the same boom and bust cycles as house prices. While non-filtered series are used in the estimation of coefficients, interest rates, income and the deflator are filtered when computing the fundamental price and the gap to avoid abrupt changes of the estimated gap.
Brueckner J. and S. Sayantani (2022): Intercity impacts of work-from-home with both remote and non-remote workers. CESifo Working Paper, No. 9793.
Cheshire, P. and S. Sheppard (1998). Estimating the Demand for Housing, Land, and Neighbourhood Characteristics. Oxford Bulletin of Economics and Statistics, Vol. 60, Issue 3, 357-382.
World Bank (2025): Urban population (% of total population) – European Union. World Development Indicators.
United Nations (2024): World Urbanization Prospects: The 2024 Revision. Department of Economic and Social Affairs, Population Division.
Gokan T., S. Kichko, J. Matheson and J. F. Thisse (2022): How the rise of teleworking will reshape labour markets and cities. CEPR Discussion Paper, No. 17672.
Brueckner J. and S. Sayantani (2022): Intercity impacts of work-from-home with both remote and non-remote workers. CESifo Working Paper, No. 9793.
Franco, S.F. and C. D. Santos (2021): The impact of Airbnb on residential property values and rents: Evidence from Portugal. Regional Science and Urban Economics, Vol. 88, 103667. Reichle, P., J. Fidrmuc, and F. Reck (2023): The sharing economy and housing markets in selected European cities. Journal of Housing Economics, Vol. 60, 101914. Anastasiou, D., P. Kapopoulos and K. M. Zekente (2024): Housing Affordability, Tourism Activity and Income Inequality: Friends or Foes? Open Economies Review. Mikulić J., M. Vizek, N. Stojčić, J. E. Payne, A. Č. Časni, and T. Barbić (2021): The effect of tourism activity on housing affordability. Annal of Tourism Research, Vol. 90, 103264.
Gabor, D. and S. Kohl (2024): “My home is an asset class”: The financialization of housing in Europe. https://hdl.handle.net/21.11116/0000-0009-E232-F.
Lima, V., R. Hearne and M. P. Murphy (2022): Housing financialisation and the creation of homelessness in Ireland. Housing Studies, Vol. 38, Issue 9, 1695–1718. Saaristo, S. M. And R. Silva (2023): Struggles against financialisation of housing in Lisbon – the case of habita, Housing Studies, Vol. 39, Issue 6, 1–28. Guironnet, A., P. H. Bono and N. Kireche (2023): The French touch to the financialisation of housing. Institutional investment into the Paris city-region (2008–2021). Housing Studies, Vol. 39, Issue 12, 2985–3006.
The proportion of EU households that own their homes has decreased from 71.4% in 2010 to 69.4% in 2020, while the proportion of households that rent their homes has increased from 28.6% to 30.6% over the same period, which is a reversal of trend of previous decades. This shift towards renting has been driven by the increasing unaffordability of housing, particularly in urban areas.
Bandoni, E., G. De Nora, M. Giuzio, E. Ryan and M. Storz (2025): Institutional investors and house prices. ECB Working Paper, No. 3026.
Baum-Snow, N. and G. Duranton (2025): Housing Supply and Housing Affordability. NBER Working Paper, No. 33694.
Banerjee, R., D. Gorea, D. Igan and G. Pinter (2024): Monetary policy and housing markets: insights using a novel measure of housing supply elasticity. BIS Quarterly Review, December 2024.
Gyourko, J., J. Hartley and J. Krimmel (2021): The local residential land use regulatory environment across US housing markets: evidence from a new Wharton index. Journal of Urban Economics, Vol. 124, 103337. Goolsbee, A. and C. Syverson (2023): The strange and awful path of productivity in the US construction sector, NBER Working Paper, No. 30845.
Beze, E. (2023): Geographic constraints and the housing supply elasticity in Germany, Ruhr Economic Papers, No. 1003. Chapelle, G., J.B. Eyméoud and C. Wolf (2023): Land-use regulation and housing supply elasticity: evidence from France,” THEMA Working Papers 2023-08.
Caldera, A. and Å. Johansson (2013): The price responsiveness of housing supply in OECD countries, Journal of Housing Economics, Vol. 22, Issue 3, 231-249. Cavarelli, M. Ch., B. Cournede and E. Özsöğüt (2019): How responsive are housing markets in the OECD? National level estimates. OECD Economics Department Working Papers, No. 1589
Egan, P. and K. McQuinn (2023): Regime switching and the responsiveness of prices to supply: The case of the Irish housing market. The Quarterly Review of Economics and Finance, Vol. 87, 82-94. Günnewig-Mönert, M. and R. C. Lyons (2024): Housing prices, costs, and policy: The housing supply equation in Ireland since 1970. Real Estate Economics, Vol. 52, 1075–1102.
Accetturo, A., R. Lamorgese, S. Mocetti and D. Pellegrino (2021): Housing supply elasticity and growth: evidence from Italian cities, Journal of Economic Geography, Vol. 21, Issue 3, 367–396,
Eurostat offers two indices for building permits: the “dwelling index” and the “floor area index.” The dwelling index tracks changes in the number of permits for one-dwelling and multi-dwelling residential buildings, excluding community residences like elder care homes. The floor area index measures changes in the useful floor area for which permits are issued, using an alternative size measure if needed. It is more comprehensive than the dwelling index, covering all residential buildings, including community residences, as well as non-residential buildings such as offices, hotels, shops, warehouses, industrial sites, schools, and hospitals.
Knoll, K., M. Schularick and T. Steger (2017): No Price Like Home: Global House Prices, 1870–2012. American Economic Review, Vol. 107, Issue 2, 331–353. Dotsis, G., P. Petris and D. Psychoyios (2025): Assessing Housing Market Crashes over the Past 150 years. Journal of Real Estate Finance and Economics, Vol. 70, 359–377.
There are three methods used for land price estimation. i) residual method, which estimates land price as the difference between housing value and replacement cost of the structure, ii) spatial transaction-based approach, which uses structural and non-parametric methods for land price estimation, iii) a hedonic regression, which separates house value into its land and structure components.
Braun, S. and G. S. Lee (2021): The prices of residential land in German counties. Regional Science and Urban Economics, Vol. 89, 103676.
D. Albouy, G., M. Ehrlich, and M. Shin (2018): Metropolitan land values. Review of Economics and Statistics, Vol. 100, Issue 3, 454-466. Davis, M. A., W.D. Larson, S. D. Oliner, and J. Shui (2021): The price of residential land for counties, ZIP codes, and census tracts in the United States. Journal of Monetary Economics, Vol. 118, 413-431.
OECD (2023). Brick by Brick (Volume 2): Better Housing Policies in the Post-COVID-19 Era, OECD Publishing, Paris. OECD (2024). An Agenda for Housing Policy Reform, Policy Brief.
OECD (2021). Brick by Brick: Building Better Housing Policies, OECD Publishing, Paris. OECD Affordable Housing Database – http://oe.cd/ahd.
Müller, D. and E. Gsottbauer (2021). Why Do People Demand Rent Control?, Working Papers in Economics and Statistics, No. 2021-20, University of Innsbruck, Research Platform Empirical and Experimental Economics.
Elmendorf, C. S., Nall, C., & Oklobdzija, S. (2024). What state housing policies do voters want? Evidence from a platform-choice experiment. Journal of Political Institutions and Political Economy, 5(1), 117–152.
Nall, C. (2024). Can Economic Fact-Checking Remedy Incorrect Beliefs About Housing Markets? Housing Policy Debate, 1–6.