This policy brief is based on ECB Working Paper No. 3085. The opinions expressed in this article are those of the author and do not necessarily coincide with those of the ECB or the Eurosystem.
Abstract
This Policy Brief introduces the Marginal Propensity to Lend out of Deposit inflows (MPLD) — the banking analogue of households’ marginal propensity to consume. Using U.S. bank data from 1995–2021, I develop a new instrumental variable approach based on local dividend payouts to estimate how unsolicited deposits affect lending. The analysis shows that before the Global Financial Crisis, the average U.S. bank lent out nearly every dollar of new deposits. Since the onset of Quantitative Easing (QE), the average MPLD has declined to 0.35, reflecting looser liquidity constraints. But differences across banks remain large: institutions with thin cash buffers and fragile funding structures continue to behave “hand-to-mouth.” These findings matter for monetary policy design, quantitative tightening (QT), and the debate on central bank digital currencies (CBDCs).
Household economics has long recognized that spending behavior depends on constraints. Some households are “Ricardian,” smoothing the impact of income shocks across time, while others are “hand-to-mouth,” spending almost all unexpected income. The size of the marginal propensity to consume (MPC) is therefore a window into who is facing tight borrowing or liquidity constraints (Kaplan & Violante, 2014).
The same logic can be applied to banks. In principle, an unconstrained bank has already optimized its asset mix, so a windfall deposit inflow (in the form of cash or central bank reserves) should not trigger a credit expansion. Instead, the bank may simply hold more reserves (Stulz et al., 2023) or pay down costly wholesale funding, since any loan that is profitable at the margin should already have been originated. But in practice, banks often do expand lending when new deposits arrive, suggesting the presence of binding liquidity constraints. The marginal propensity to lend out of deposit inflows (MPLD) measures the per-dollar lending response to unsolicited deposits.
Understanding MPLDs is relevant for at least three reasons:
At first glance, deposits and loans move together. But this correlation cannot be taken as causal:
A simple bank-level regression of loan growth on deposit growth would therefore overstate the true MPLD.
To overcome these problems, I develop an instrumental variable (IV) strategy based on local dividend payouts. The idea, based on Lin (2022), is simple: when households receive dividends, at least some of the money ends up in bank deposits. Because dividend income varies across counties and over time, it generates shocks to banks’ deposit bases.
The instrument assigns each bank a predicted inflow equal to county-level dividend income multiplied by the bank’s local market shares. Intuitively: if a bank administers 20% of deposits in a county that receives a $10m dividend windfall, it is “predicted” to receive $2m in additional deposits from that county. Aggregating across counties yields a strong predictor of bank-level deposit inflows.
This instrument isolates variation that is plausibly unrelated to loan demand. To further address concerns:
The first stage confirms the instrument is powerful: banks experience larger deposit inflows when the counties where their depositors reside report high dividend income.
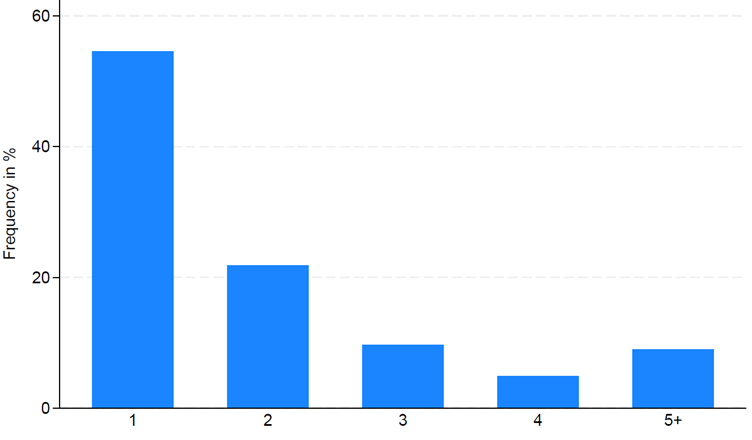
Figure 1. Number of counties in which banks raise deposits. More than half of U.S. banks concentrate deposit business in only one county
The IV estimates indicate that, on average, each unsolicited deposit dollar increases lending by about $0.31. This is much smaller than the naïve OLS estimate (≈0.42), consistent with OLS being upward-biased.
Crucially, the MPLD is not constant over time:
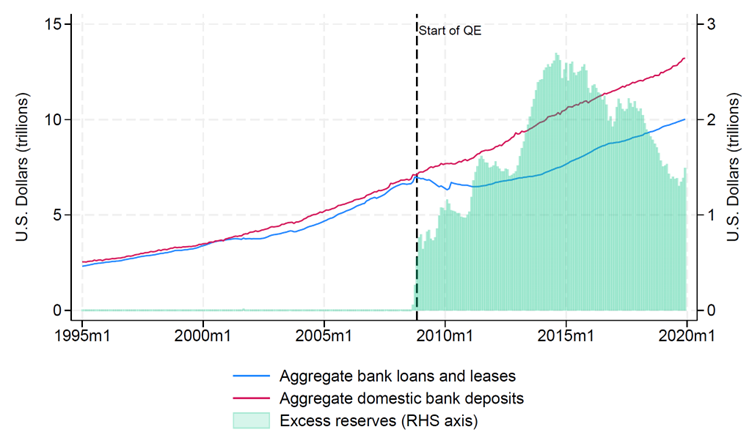
This drop mirrors the divergence of deposits and loans at the aggregate level (depicted in Figure 2 below). While deposits ballooned under QE, lending did not keep pace, and banks accumulated excess reserves in their accounts at the Fed.
Figure 2. Aggregate U.S. bank loans, deposits, and excess reserves, 1995–2020. Loans and deposits tracked closely before 2008, but diverged after QE
The MPLD varies substantially across banks:
Leverage also matters, but non-linearly. In general, the MPLD is positively correlated with leverage, consistent with the idea that an inflow of “cheap” deposits increases expected profits and thus relaxes future leverage constraints. But for banks near regulatory leverage limits, inflows can mechanically tighten capital ratios and even lead to negative MPLDs — cutting loans when deposits rise (Bolton et al., 2025).
Before QE, deposit inflows translated proportionally across loan categories, with real estate lending absorbing the largest share. After QE, the fall in MPLD is almost entirely driven by real estate loans: banks became much less willing to expand mortgage credit in response to deposit shocks. This might reflect regulatory changes regarding the ability to securitize mortgages, making them less dependent on deposit funding.
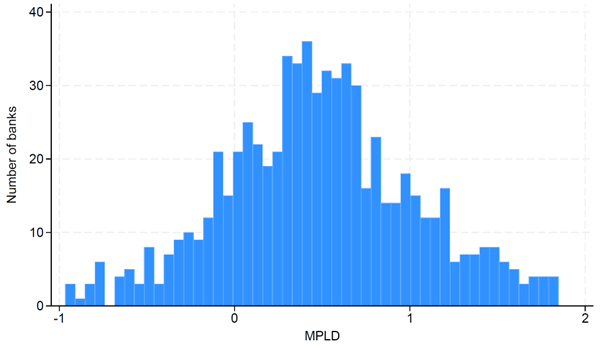
Estimating MPLDs bank-by-bank confirms the heterogeneity. As Figure 3 below shows, most banks’ estimates fall between 0 and 1, but some exhibit MPLDs above 1 (deposit inflows crowding in other funding or reallocations), while others have negative MPLDs (constrained by capital requirements). The distribution reinforces the notion that high aggregate excess liquidity conceals sharp differences between banks.
Figure 3. Distribution of MPLDs across U.S. banks, 1995–2021. Most banks fall between 0 and 1, but some exceed 1, while others even show negative MPLDs
QE created abundant reserves, weakening the deposit-loan link. But the fact that MPLDs remain positive means liquidity supply still matters (Acharya et al., 2023). QT could therefore tighten credit disproportionately at high-MPLD banks. As ECB Director Schnabel (2023) warned, uneven reserve distribution may require central banks to maintain larger buffers to prevent volatility.
The collapse of Silicon Valley Bank in 2023 highlighted how fragile funding structures can lead to deposit outflows or even outright bank runs. Banks with high MPLDs are especially impactful in such an event. Therefore, MPLDs could serve as a supervisory risk indicator.
Concerns that CBDCs will “drain” deposits from banks hinge on MPLDs. For some banks, deposit flight could indeed cut lending dollar-for-dollar. For others, the effect might be small. Recent research (Keister & Sanches, 2023; Whited et al., 2022) suggests aggregate impacts are modest, but distributional effects could be concentrated in high-MPLD institutions.
Liquidity injections may be wasted if absorbed by large, unconstrained banks. Instead, targeting support to high-MPLD banks ensures that deposit injections translate into maximum new credit.
The MPLD is a simple but powerful diagnostic of bank behavior. Before QE, the U.S. banking system operated hand-to-mouth: every deposit dollar became a loan. After QE, constraints loosened, but did not vanish altogether. Some banks remain strongly liquidity-sensitive. For policymakers, this means that reserve supply — whether added through QE, withdrawn via QT, or displaced by CBDCs — continues to shape credit supply in an uneven way. Recognizing the heterogeneity in MPLDs is essential for designing effective, targeted policies.
Abad, J., Bigio, S., García-Villegas, S., Marbet, J., & Nuño, G. (2024). “The Heterogeneous Bank Lending Channel of Monetary Policy.” Working Paper.
Acharya, V., Chauhan, R., Rajan, R., & Steffen, S. (2023). “Liquidity Dependence and the Waxing and Waning of Central Bank Balance Sheets.” NBER WP.
Bolton, P., Li, Y., Wang, N. and Yang, J. (2025). “Dynamic Banking and the Value of Deposits.” The Journal of Finance, Vol. 80 (4), 2063-2105.
Drechsler, I., Savov, A., & Schnabl, P. (2017). “The Deposits Channel of Monetary Policy.” The Quarterly Journal of Economics, Vol. 132 (4), 1819-1876.
Kaplan, G., & Violante, G. (2014). “A Model of the Consumption Response to Fiscal Stimulus Payments.” Econometrica, Vol. 82 (4), 1199-1239.
Keister, T., & Sanches, D. (2023). “Should Central Banks Issue Digital Currency?” The Review of Economic Studies, Vol. 90 (1), 404-431.
Lin, L. (2022). “Depositing Corporate Payout”. Working Paper.
Schnabel, I. (2023). “Back to Normal? Balance Sheet Size and Interest Rate Control.” Speech at an event organized by Columbia University and SGH Macro Advisor, New York.
Stulz, R., Taboada, A. G., and van Dijk, M. A. (2023). “Why Are Banks’ Holdings of Liquid Assets so High?” NBER WP.
Whited, T., Wu, Y., & Xiao, K. (2023). “Will Central Bank Digital Currency Disintermediate Banks?” Working Paper.