menu
close

Author(s):

Lars Jensen | United Nations Development Programme (UNDP)

Keywords:

Green transition cost , just transition , climate change , energy economies , resource dependence , local projections , macroeconomics

JEL Codes:

What are the potential fiscal and macroeconomic costs of ambitious global decarbonization in countries heavily dependent on fossil fuel (FF) exports? This policy brief explores this question by first identifying a group of 40 most vulnerable countries, simulating the group’s oil rents loss for the period 2023-2040 under a Paris Agreement aligned versus a stated policies scenario, and finally by estimating a local projections model focusing on fiscal and growth implications of falling (real) oil prices. Results point to potentially massive transition costs with an estimated 60% loss of oil rents alone (in present-value terms) and with large estimated adverse impacts on real GDP, fiscal balances, and build-up of public debt. By anticipating the transition, countries can do a lot to mitigate its costs through domestic policy reform, but a just global climate transition will require a substantial increase in international support to avoid high socio-economic costs and development setbacks, especially among the most vulnerable FF-dependent economies.

Global decarbonization pathways

To limit global warming to the goals set out in the Paris Agreement, global decarbonization must proceed rapidly over the next two decades.1 The Intergovernmental Panel on Climate Change (IPCC) estimated the remaining global carbon budget at the beginning of 2020 to lie between 300-900 gigatonnes of CO2 (GtCO2) for an 83% chance of staying within a 1.5°C-2.0°C rise in global temperature (over pre-industrial temperature) by the end of this century (IPCC, 2021).2 If we assume that annual average emissions will stay at the 2019 level of 40 GtCO2 going forward, the 1.5°C budget would, therefore, be expended before the end of 2027 and the 2.0°C-budget before 2042. Current policies do not lend much optimism to limiting global warming. The Climate Action Tracker initiative has estimated that under current policies, the end of century warming would be 2.7°C. Even under all 2030 nationally determined contribution (NDC) targets, the world would emit roughly twice as many greenhouse gasses (GHGs) in 2030 as required to stay on a 1.5°C compatible pathway (CAT, 2022). Similarly, in its latest assessment report, the IPCC concludes that if considering only those countries that have already implemented mitigation policies, projected emissions would lead to a warming of 3.2°C, and when accounting for NDC targets 2.8°C (IPCC, 2023).

Whatever our likelihood of limiting warming to 1.5°C, any ambitious global decarbonization effort will unequivocally require a major reduction in the use of fossil fuels (FF), the burning of which accounts for about 85% of human-caused annual CO2 emissions and 65% of total GHGs.3 The International Energy Agency (IEA) estimates that to have a 50% chance of staying within 1.5°C, the global energy sector will have to reach net-zero emissions by 2050 (IEA, 2021). Achieving this objective is believed to require a fall in demand from the current levels of 90%, 75% and 55% for coal, oil and gas, respectively, by 2050.

While limiting global warming will undoubtedly make everyone better off in the long run, decarbonization will be a painful adjustment for some countries. Identifying the potential winners and losers of the transition is fraught with uncertainty and is particularly sensitive to national and international policy choices and cooperation, technological developments, natural resource endowments, etc. However, the group of developing economies that rely heavily on extracting and exporting FF must be considered among the most vulnerable.

Fossil fuel dependence

FF-dependent countries rely on FF, and mostly oil, to support economic activity, earn foreign exchange, fund public spending and investments, etc. Even disregarding their efforts to decarbonize, these countries are likely to suffer the hardest fiscal and economic consequences from global decarbonization, which in many cases could spill over to already fragile socio-economic fundamentals. Managing the ‘exogenous impact’ from global decarbonization in countries with already low per capita earnings and savings, low levels of human capital and strained public finances, will be nearly impossible without much more international support and cooperation accompanied by urgent domestic fiscal and economic reform.

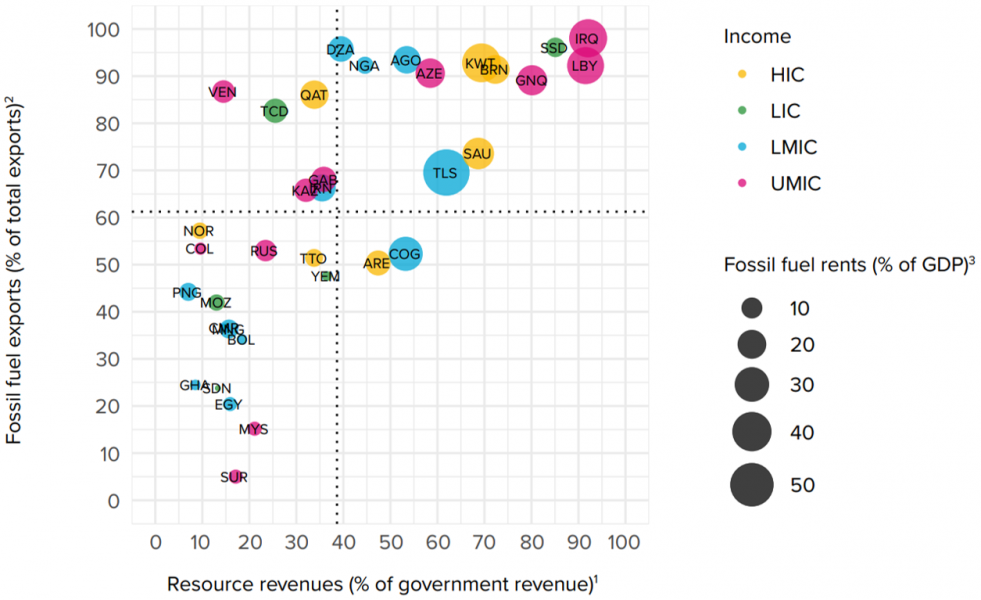
Based on estimates of FF rents, there are about 40 highly FF-dependent countries, 31 of which are low- and middle-income countries, that on average have generated FF rents (from oil, coal and gas) worth more than three percent of GDP annually from 2015 to 2019. The average/median country generated FF rents of 14.3%/11.1% of GDP; FF accounted for 61.2%/61.5% of exports; and resource revenue represented 38.6%/33.8% of total government revenue, cf. Figure 1. It is likely that FF rents alone contribute one third of total revenue.4

Figure 1: Fossil fuel dependence – rents, exports and government revenue (avg. values 2015-2019)
 width=
Source: Author based on data from WDI, GRD, EITI, BACI, CEIC and WEO. Note: The figure includes 35 of 40 highly fossil fuel-dependent countries, as five do not have recent data on resource revenues (Bahrain, Ecuador, Oman, Turkmenistan, Uzbekistan). 1 Data based on GRD except for Colombia and Mozambique, where data is from the latest EITI reports. For Libya, Venezuela and Yemen, the latest GRD data is from 2012. Datapoints for these countries are estimates of their 2019 FF revenue shares obtained by scaling their oil production times global crude price in 2012 with their oil production and crude price in 2019 using CEIC data for oil production and IMF WEO data for revenue. 2 Exports are based on data from WDI. For countries with all or many missing observations, export data from the BACI database from CEPII was relied upon. 3 Based on available datapoints from WDI. Data for Venezuela is from 2014 and South Sudan 2015. Syria is not included, as the latest datapoint is from 2007.

Estimated oil rents losses

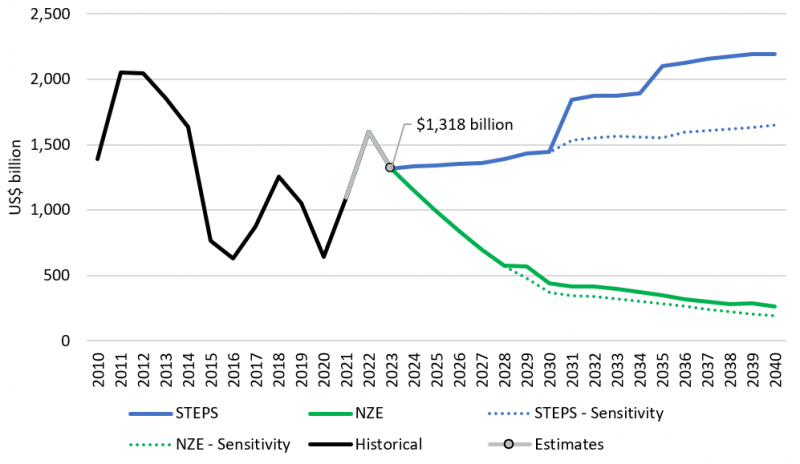
Under the most ambitious global decarbonization scenario aimed at limiting global warming to 1.5°C, it is estimated that the group could, in present value adjusted terms (PV), lose between $12-14 trillion of oil rents alone in the period 2023-2040 compared to a ‘business as usual scenario’. This represents a loss of rents of more than 60%, equivalent in size to between 120-142% of the group’s current GDP. Figure 2 depicts the (non-present value adjusted) trajectory of oil rents (in real terms) for the group of FF-dependent economies under a net zero by 2050 scenario (NZE) scenario versus a stated policies scenario (STEPS) including sensitivity analysis denoted by the dotted lines.5

Figure 2: Oil rents for the group of FF-dependent economies, real terms (US$2023)*
 width=
Source: Author’s estimations for STEPS and NZE. WDI for historical data. Note: VEN and SSD are missing from historical. VEN and UZB are missing from NZE and STEPS. *Rents are in 2023 prices (adjusted by the United States GDP deflator from IMF WEO).

Fiscal and growth implications of global decarbonization

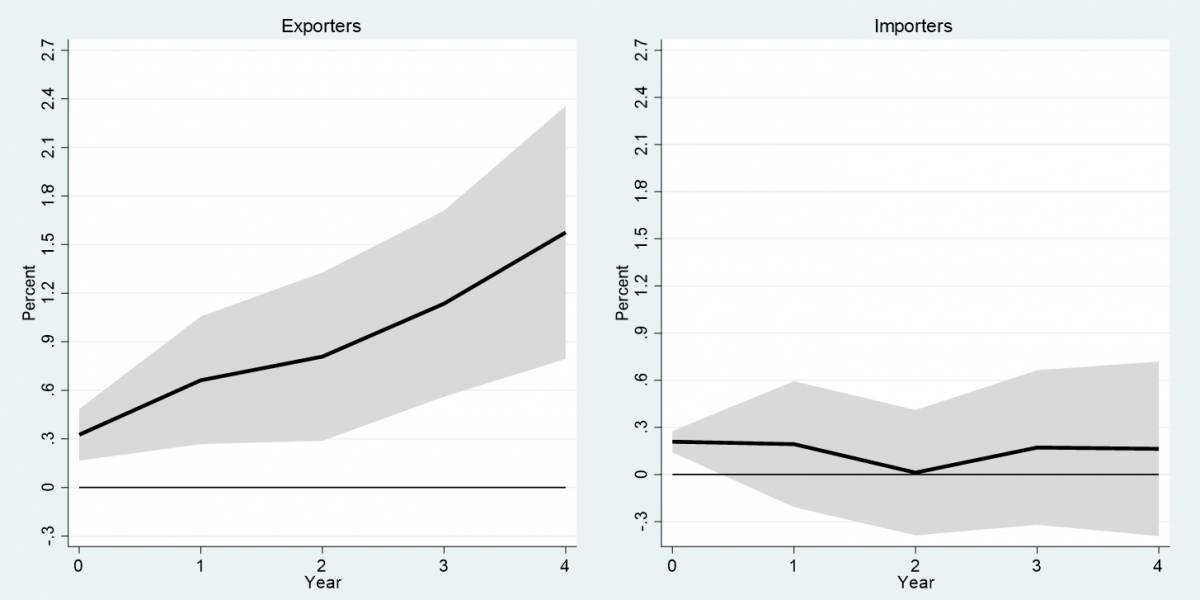
Results from estimating a local projections model on a panel of oil export- versus import-dependent emerging markets and developing economies (EMDEs) support the possibility of very high economic and fiscal transitory costs in the former group from falling oil prices.6 More specifically, results from five-year cumulative impulse response function (CIRF) estimates suggest that a 10 pp decrease in (real) oil price inflation is associated with an annual average contraction in (real) GDP of 0.31% with GDP 1.58% smaller four periods after the oil price shock. Estimation results are depicted in Figure 3 with the group of export-dependent EMDEs on the left and import-dependent on right. Furthermore, CIRF estimates suggest that an oil price shock of the same magnitude is associated with a fall in annual government revenue as a percentage of GDP by between 0.6 and 0.7 pp over the full projection horizon, and an addition of about 0.5 pp to government debt as a percentage of GDP every year with a debt ratio 2.5 pp higher four periods after the shock.

Figure 3: EMDEs – GDP (constant prices) response to a 10 pp increase in (real) oil price inflation
 width=
Source: UNDP. Note: Cumulative response of real GDP from a 10 pp increase in the real oil rice from a local projections model. The shaded area delineates the 95 percent confidence band.

Conclusion

The future trajectory of global decarbonization, and thus our chances of limiting warming to the goals set out in the Paris Agreement, remain extremely uncertain. Any scenario, however, in which the world starts making great advances on decarbonization will inevitably require a fast and large-scale reduction in the use of fossil fuels (FF). The main conclusion of the analysis summarized in this brief is that many FF-dependent economies face potentially massive fiscal and economic costs. Some countries are better equipped to handle the transition as their FF dependency (exposure) is relatively low and/or their levels of existing (physical, human and financial) capital stocks (resilience) relatively high. But many others have both high exposure and low resilience (high vulnerability) and rank among some of the least well-off countries in the world measured on human and overall levels of sustainable development. Countries can do a lot through domestic reforms targeting diversification, but without international support and cooperation to mitigate the potential socio-economic impacts of global decarbonization, many countries could see already low levels of development rolled back decades as the world hopefully gets serious about combatting climate change.

References

CAT. (2022). Warming Projections Global Update – November 2022. Climate Action Tracker.

IEA. (2021). Net Zero by 2050 – A Roadmap for the Global Energy Sector. International Energy Agency.

IPCC. (2021). Climate Change 2021 – The Physical Science Basis. United Nations Intergovernmental Panel on Climate Change (IPCC).

IPCC. (2023). Synthesis Report of the IPCC Sixth Assessment Report – Summary for Policymakers. United Nations Intergovernmental Panel on Climate Change (IPCC).

Jensen, L. (2023). Global Decarbonization in Fossil Fuel Export-Dependent Economies – Fiscal and economic transition costs. United Nations Development Programme (UNDP) Development Futures Series Working Paper.

Jordà, O. (2005). Estimation and Inference of Impulse Responses by Local Projections. American Economic Review.

United Nations. (2015). Paris Agreement.

  • 1.

    Article 2 (a) of the 2015 Paris Agreement reads: “Holding the increase in the global average temperature to well below 2°C above pre-industrial levels and pursuing efforts to limit the temperature increase to 1.5°C …’’ (United Nations, 2015).

  • 2.

    The IPCC estimates that for every 1,000 GtCO2 emitted by human activity, global temperature rises by 0.45°C.

  • 3.

    https://www.epa.gov/ghgemissions/global-greenhouse-gas-emissions-data.

  • 4.

    Resource revenue data from GRD does not differentiate between type of resource. To obtain an estimate of the FF share of total government revenue only, the total resource revenue share is adjusted downwards by the ratio of FF rent to total natural resource rent. See Jensen (2023).

  • 5.

    NZE and STEPS scenarios are based on IEA (2021). NZE represents a scenario compatible with limiting global warming to ‘well below 2-degrees while pursuing efforts to limit the temperature rise to 1.5 degrees’, and STEPS all specific policies in place or announced and a 50% chance that global warming will reach 2.6-degrees by 2100. The results shown in Figure 2 are sensitive to the reserves estimates used, especially as three major oil producers, the US, China and Russia, under the STEPS scenario would run out of crude oil reserves before 2040 leaving substantial amounts of annual oil production to be picked up by remaining producers. Given the large uncertainties surrounding reserves data and the large market share of these three countries (almost one third of crude oil production in 2020), estimates are recalculated as a sensitivity check under an assumption that reserves are not a constraint among the three producers. For details on methodology and results see Jensen (2023), section 3.1. 

  • 6.

    See Jordà (2015) for details on local projections (LP) models and Jensen (2023), annex B, for details on the LP model used in this analysis. 

About the authors

Lars Jensen

Lars Jensen is a senior macroeconomist with the United Nations Development Programme (UNDP) in New York. His research focuses on resource dependence and the climate transition, debt, and sustainable finance. Lars has published work on the links between financial regulation and the macroeconomy, banking sector regulation, debt crisis and sustainability, peacekeeping and the macroeconomy, resource dependence under the green transition and sustainable finance instruments.

More on these topics

Tags: