This policy brief is based on “How Education Impacts Consumption Smoothing” , which is a revision of the original publication (see CESifo Working Paper No. 9855).
We study consumption and saving behaviour by education group in Iceland over the years 2005-2019, a turbulent period with dramatic fluctuations in factor incomes before, during and after the collapse of the country’s banking system. Using microdata containing the tax returns of all Icelandic taxpayers, we find that higher education lowers the marginal propensity to consume (MPC) by raising disposable income and relaxing liquidity constraints. Our results have implications for economic policy. For example, with a lower MPC following an increase in the average level of education, the multiplier is also lower, thus reducing the effectiveness of discretionary fiscal policy. However, since a lower multiplier strengthens the built-in stabilizing impact on the economy, macroeconomic volatility is reduced. Finally, in addition to using more conventional redistributive devices, countries struggling with unequal distributions of wealth and income could improve their situation by raising the level of education.
Deciding on the length and type of education is one of the most important decisions individuals make. While it is well-known that education is correlated with wages, health and longevity, the relationship between education and macroeconomic developments has been researched to a much smaller extent. Education is likely to matter for the ability of individuals to shield themselves from the effect of economic recessions. Not only is a high level of education typically associated with a relatively high wage level, but it is also expected to increase an individual’s ability to make financial plans into the future, thereby improving households’ capacity to smooth consumption over the life cycle.
In a recent paper of ours – Jensen, Olafsson, Sveinsson and Zoega (2023) – we look further into these issues. Our approach is to combine data on educational attainment with administrative data on tax returns for all taxpayers in Iceland during a period that covered the financial boom of 2005-2008, the financial bust in 2008 and the subsequent recovery.
We are not aware of other studies of consumption behaviour that link data on education with data on tax returns over such a turbulent period. Specifically, real wages fluctuated wildly during this period, rising until 2008, then falling by more than one third for a large fraction of the population before recovering until the end of the sample period in 2019.
In what follows, we first describe income, consumption and saving over the life cycle and then turn to the issue of consumption smoothing of households. Since this is a key determinant of the marginal propensity to consume, the paper finally discusses some implications of our findings for macroeconomic policy.
We show the life-cycle path of income and consumption in Figure 1. A number of observations leap to the eye: First, the income path for the university educated in their thirties and forties is steeper than for those with secondary education and primary education. The income path for workers with primary education as a final degree is almost flat before tapering off in the forties and fifties. Second, the consumption path is also steeper for the university educated, which can be explained by their inability to borrow against the promise of rapidly rising wages. Third, the difference between income and consumption – i.e., saving – is rising in the forties, fifties and sixties. Fourth, consumption does not drop around the retirement age (of app. 70), indicating that households are able to smooth their consumption across their lifetime. Fifth, saving continues after retirement.
We then correct for income and personal characteristics – gender, marital status, the number of children, net wealth deciles and occupation – to find the effect of age shown in Figure 2.1
Figure 1: Average income and consumption, by age, for three education groups
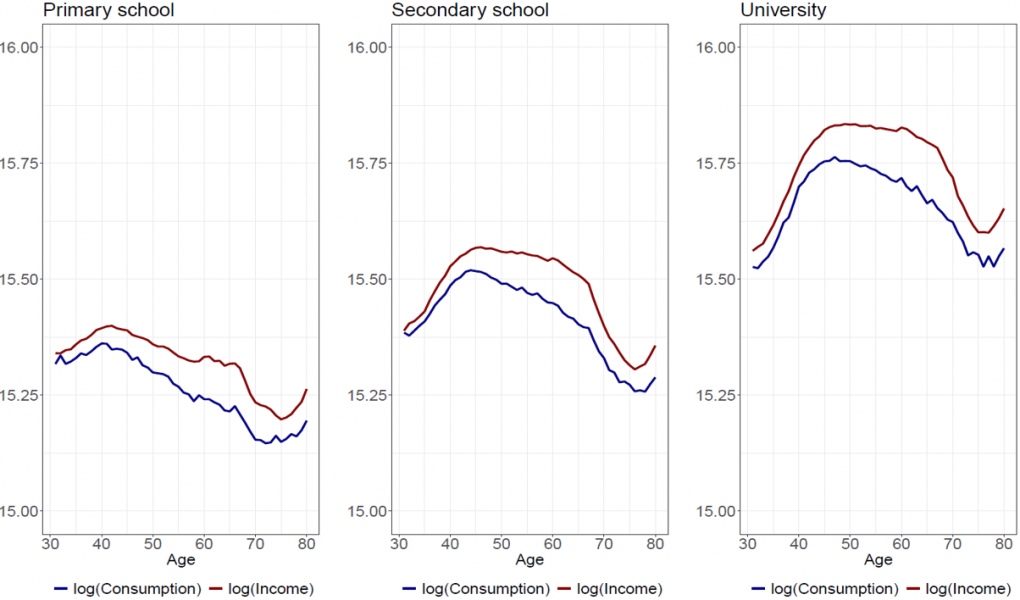
Note: Average log consumption and log disposable income by age for households aged 31 to 80 in 2005-2019.
The left panel shows 391,419 observations of 42,116 primary-educated households, the mid panel shows 739,941 observations of 79,169 of secondary school-educated households, and the right panel shows 623,251 observations of 64,291 of university-educated households.
Figure 2: Life-cycle profile for consumption
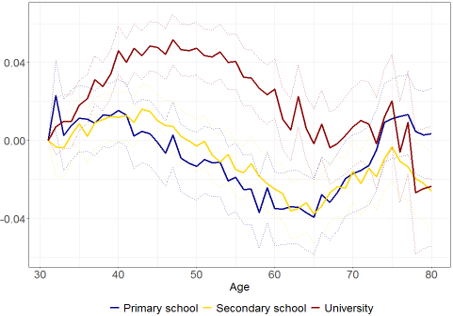
Note: The estimates are based on households aged 31 to 80 in 2005-2019. The dotted lines show the 95 % confidence interval.
Again, several observations can be made:
First, the hump-shaped consumption path disappears for the primary school educated and the secondary school educated while it remains for the university educated. The flattening is due to the effect of income over the life-cycle being removed rather than the inclusion of household characteristics. Second, consumption is declining in age after age 40 for the primary school and secondary school educated and after age 50 for the university educated, indicating retirement saving. Third, consumption rises after retirement for the two lower education groups and falls for the university educated. Using education as a proxy for permanent income, this lends support to the hypothesis that bequests are a luxury good.
The results show that household saving is generated by individuals over the age of 40 and, contrary to the life-cycle theory of consumption, continues well into retirement. The age distribution of the population should then affect gross national saving and the current account.2
Against that backdrop, we now turn to analysing consumption behaviour over the business cycle.
Using the approach of Blundell et al. (2008) to estimate the effect of transitory income shocks on consumption, we make two key observations:3 First, the MPC out of transitory shocks is lower for university-educated households than for the other two groups. Specifically, the MPC is 21% higher for those with secondary education than those with university education, and the MPC is 12% higher for the primary school educated than for the university-educated.4
Second, by complementing the analysis of tax returns with survey data, we confirm that (a) university educated individuals save for future consumption; (b) university educated save when income is higher than planned expenditures; (c) individuals without a university degree are more prone to save only through pension savings; and (d) the primary school educated individuals’ motive is more often precautionary savings.
It follows that those with a higher level of education have a lower propensity to consume out of current income, which is consistent with our findings that the MPC is lower for the university educated. But why is it that the university-educated do more consumption smoothing than the less educated?
We find that the greater consumption smoothing for the university educated is largely due to their higher income and more liquidity, as shown in Figure 3.
Figure 3: MPC by income and wealth quintiles
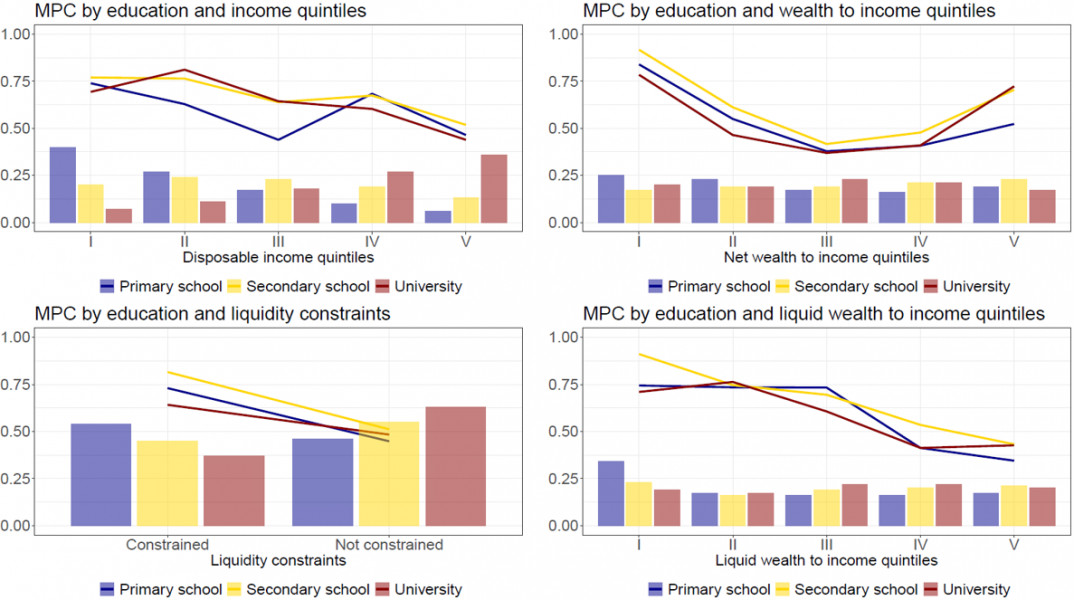
Notes: Liquid wealth is defined as the sum of bank deposits and assets in investment and savings funds. A household is considered liquidity-constrained in the lower left panel if liquid wealth is below USD 4,100 for singles and USD 8,200 for couples. These estimates are based on 1,754,611 households aged 31 to 80 in 2005-2019.
The figure shows how the MPC for the different education groups depends on disposable income, net wealth to income, liquidity constraints and the ratio of liquid wealth to income. Note that there is very little difference between the MPC of the different education groups but there is a significant difference between income quintiles and between liquidity constrained and unconstrained households. What explains the lower MPC of the university educated is their concentration in the highest income quintile and among the households who are not liquidity constrained, as shown by the bars in the figure, which show the distribution of the education groups across these variables.
Each economic upturn and downturn leaves a different mark on industries and regions. A recession may leave some industries unscathed while leaving a trail of bankruptcies and unemployment in others. Workers leave themselves more exposed to or protected against the vagaries of the market economy through their choice of education, profession and industry.
Our research shows that education matters a lot for macroeconomic outcomes. In particular, we find that consumption smoothing rises with education, as higher-educated households respond less to changes in transitory income than do lower-educated households. Allowing for heterogeneity, we find that the relatively low MPC of university-educated households is driven by the fact that they are overrepresented in the upper part of the income distribution, where the MPC is generally lower, and they are less likely to be liquidity-constrained.
It follows from our results that the business cycle has a stronger impact on the consumption of the least educated and the weakest impact on the university educated, apparently due to their higher income and more liquidity. Thus, investment in education not only yields higher income but also a more stable standard of living.
This observation has a direct implication for the topical debate about inequality. In addition to using more conventional redistributive devices, such as various welfare programmes, it appears that countries struggling with unequal distributions of wealth and income could improve their situation by raising the level of education.
Moreover, since consumption smoothing is a key determinant of the marginal propensity to consume, it also matters for the Keynesian multiplier. Indeed, by increasing the average level of education, the multiplier falls, thus strengthening the built-in stabilizing impact on the economy. While the effect of reducing macroeconomic volatility following an increase in the level of education counts on the upside, there is also a downside of a lower multiplier, namely that the effectiveness of fiscal policy is reduced.
Blundell, R., Pistaferri, L., & Preston, I. (2008). Consumption inequality and partial insurance. American Economic Review, 98(5), 1887-1921.
Deaton, A. (2019). The analysis of household surveys: A microeconometric approach to development policy. World Bank Publications.
Gudmundsson, G. S., & Zoega, G. (2014). Age structure and the current account. Economics Letters, 123(2), 183-186.
Hall, A., Scheving, A. S., & Zoega, G. (2021). The effect of a financial crisis on household finances: A case study of Iceland’s financial crisis. Journal of Financial Crises, 3(4), 1-24.
Jensen, S. H., Olafsson, S. P., Sveinsson, T. S., & Zoega, G. (2023). Mapping educational disparities in life-cycle consumption. CESifo Working Paper No. 9855.
To enable the simultaneous estimation of age effects and time effects, we follow Deaton (2019).
See Gudmundsson and Zoega (2014), amongst others.
First, we regress log income and log consumption on individual fixed effects, dummies for age, year, gender, education, marital status, number of children, the interaction between marital status and number of children, residence, net wealth deciles, and the log of real estate assets. We then proceed by obtaining the first differenced residuals of log consumption and log income The income process for each household is decomposed into a permanent component and a mean-reverting transitory and we then obtain the MPC out of transitory income shocks.
Specifically, the MPC for the three groups, all taken for the working-age 31-66 year group, are: 0.512 for the university-educated, 0.619 for secondary education, and 0.575 for the primary education group. Note that the MPC is higher for secondary school education than for primary school education.