The opinions expressed are those of the authors and do not necessarily represent those of the European Central Bank, SSM or the Eurosystem. We are grateful for comments by Tobas Linzert, Armin Leistenschneider, and Davide Tomio.
Abstract
Government bonds continue to provide the main “safe” assets in Europe and the US. They are not traded on exchanges but rather in Dealer-run markets. Dealers (often banks) therefore need to decide how much balance sheet they dedicate to market making. Partly due to rising capital requirements since 2008 dealer balance sheet space has become more costly. Recent stress events in the US and UK have highlighted how shrinking dealer intermediation contributes to worsening bond market functioning.1 To analyse the costs of bank dealer intermediation in the euro area we calculate the spread between repo rates in the bilateral and centrally cleared segments based on Bund collateral. We observe three main results. First, since the start of our sample in 2017 there are several sizable, albeit temporary increases in intermediation costs, e.g. after the start of the monetary policy tightening and at year-ends. Second, during periods when increasing volatility leads to a drop in bond market liquidity intermediation costs become more visible. Third, the information content of our measure is highlighted by its links to dealer leverage ratios and other widely used measures of bond market functioning. Overall, our findings are in line with the rapidly growing evidence for the interaction between bond and repo market liquidity and dealer constraints. Our estimates highlight the typically smooth functioning of the euro area repo market at the current juncture, but also the impact of rising volatility on intermediation costs. From a policy perspective, our analysis emphasises the importance of a comprehensive approach to reforms as there is no “silver bullet” to safeguard bond market functioning. Any regulatory measures to raise dealer balance sheet capacity by modifying leverage ratios need to avoid achieving an overall decline in dealer capital. Furthermore, the cross-border impact of reforms also needs to be monitored, in particular due to the global activity of Dealer banks.
Government bonds, traditionally viewed as safe assets, have become focal points of market stress in the past decade.2 Unlike stocks, EU and US government bonds are traded “over the counter” in bilateral transactions. Dealer banks are often parts of GSIBs, intermediate trades for clients and thereby provide market liquidity and immediacy (see Scheicher, 2023 for a survey). In recent years the dominance of banks in primary and secondary bond markets has been shrinking significantly. Despite the increasing role of NBFIs, banks continue to play a vital role in intermediation, in particular for bonds outside the benchmark segment. In the US (and gradually also in EU), the role of bank Dealers is complemented by principal trading firms (PTFs) who actively participate in the inter-dealer segment of the government bond market via high-frequency market making strategies and have evolved into significant liquidity providers for benchmark bonds. Another group of NBFIs, particularly hedge funds, account for an increasing share of trading activity in US and EU government bond markets. They increasingly apply leveraged trading strategies which can lead to one-sided trading during stress episodes (Schrimpf et al, 2020).3
The upward trajectory of government debt has put significant pressure on dealer capacity since the Great Financial Crisis (GFC). The volume of sovereign bonds has increased substantially, rising from $26 trillion in 2008 to $64 trillion in 2023 (OECD, 2024), and is expected to grow further4. However, the balance sheets of dealer banks have expanded at a significantly slower pace.
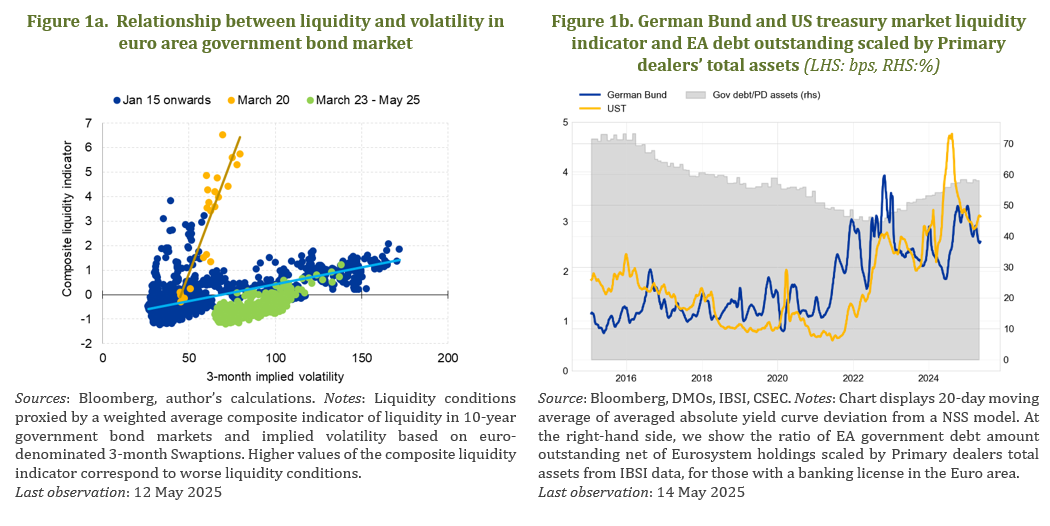
Overall, government bonds generally continue to be “safe” in terms of default risk but face mounting concerns about the ease of buying and selling in a stressed market environment (Duffie, 2025). Research from the United States (Duffie et al, 2023) and Europe (Ferrara et al, 2024) has shown that bond market functioning is typically impaired when dealers amplify volatility shocks by reducing market liquidity. Under normal conditions, government bond liquidity tend to move in parallel with volatility. However, when dealers’ intermediation capacity is constrained – as observed during the Covid19 pandemic in March 2020 – they will respond to a volatility shock by widening further bid-ask spreads posted on trading platforms. This leads to a disproportional decline in market liquidity, as illustrated by the steeper lines in Figure 1a, which highlight the nonlinear relationship between volatility and liquidity during stress episodes. In essence, as dealers become more constrained due to their internal limits or shrinking headroom in capital ratios, they reduce their market-making activity.
Against this background, enhancing the resiliency of government debt markets has been high on the global policy agenda. For instance, the G30 called for a review on how market intermediation is treated in existing regulation, with a view to identifying provisions that could be modified to avoid disincentivizing market intermediation, without weakening overall resilience of the banking system. The Securities & Exchange Commission (SEC) already adopted a regulation promoting central clearing of US Treasuries. At the time of writing, US policymakers and academics are continuing to discuss policy measures to reduce the risk of market dislocations (see e.g. Kashyap et al, 2025), with the Federal Reserve recommending a reduction in Supplementary Leverage ratio5.
Tighter post-GFC regulations have motivated the wide use of trading methods reducing the amount of space on bank balance sheets needed to conduct a given trade (cf. Duffie, 2018). The cost of maintaining space on the balance sheets of major dealer banks has risen significantly since the 2007-2009 GFC. This rise is due to increased regulatory capital requirements and the repricing of bank funding costs which have particularly affected over-the-counter markets. These effects are most pronounced in markets requiring collateral or involving the intermediation of low-risk assets, such as repo or bond markets.6 The US Supplementary Leverage Ratio (SLR) adversely affects Treasury holdings in part via their repo funding. A key factor behind this impact is the use of notional values rather than risk-based metrics in the calculation of the SLR. This approach does not account for the low credit risk of Treasuries, which would be otherwise be treated more favourably (cf. Duffie, 2018). According to Bräuning and Stein (2024), the US implementation of the SLR has significantly affected Treasury market liquidity.7 As regards Europe, UK Gilt markets offer evidence for dealer constraints. A fiscal policy shock triggered by unexpected announcements in a “mini-budget” in September 2022 caused significant dislocations in the UK fixed income markets prompting central bank intervention (cf. Pinter, 2023).
Recent developments in the US underscore further emphasise these broader trends. For instance, the US administration’s announcements of new tariffs in April 2025 introduced significant uncertainty, resulting in sharp bond price volatility and worsening liquidity conditions in the markets. At the time of writing, despite elevated volatility, trading in US Treasury and euro area government bond markets has remained largely robust.8 From a longer-term perspective, price-based measures of trading conditions suggest that liquidity in the US Treasury market has deteriorated whereas liquidity in German bonds has been comparatively more resilient during this period (Figure 1b).
The repo market has become a vital and growing source of funding for financial institutions. Consequently, dislocations in bond trading – such as reduced liquidity or price volatility – are quickly transmitted to repo market conditions, affecting both the cost and accessibility of funding for banks and NBFIs, such as asset managers. The EUR repo segment records a daily turnover of €997 billion in the fourth quarter of 2024, grew by 41% over two years and makes up 30% of the total outstanding EUR money market. In cash lending, bilateral deals mainly involved non-banks, while cash borrowing was evenly spread among banks, hedge funds, investment funds and public institutions, with notable growth from the latter. The top ten entities make up 73% of the euro area repo market. Dealer banks typically have balanced repo books.9
Costs of repo intermediation provide insights into trading conditions in government bond markets. Repo trading involves negligible risk, but is balance sheet-intensive for banks, making the compensation they require for intermediating repo a plausible proxy for their balance sheet costs. Balance sheet costs can be neutralized through netting, typically via a central counterparty (CCP), making CCP-cleared transactions less costly than bilateral trades, typically in terms of leverage ratio.10 CCPs currently handle around 70% of repo turnover. Hence, observing the difference in repo rates quoted by bank dealers via cleared and via bilateral repo for the same type of collateral provides information about the compensation dealers require to expand their balance sheets.11
We estimate intermediation costs in a regression setup and transaction-level data. A simple direct comparison of aggregate repo rates averages in the two segments would be affected by composition effects and other drivers of dealers’ bargaining power. We focus on the largest dealers’ cash borrowing transactions within the Money Market Statistical Reporting (MMSR).12 For simplicity, we restrict our sample to 1-day maturity transactions against German government collateral13 where the same collateral is traded both via a central clearing counterparty and bilaterally by the same dealer on a given settlement date.
For each day, we estimate a cross-sectional regression with the repo rate as dependent variable and a CCP dummy set to 1 for cleared trades and 0 for bilateral trades as main explanatory variable, ensuring that securities are traded at least twice by the same dealer – in the cleared and bilateral space – and capturing security specific and dealer specific characteristics, for instance to control for the average specialness of a bond a given day, and to control for the bargaining power a dealer may have on its counterparties where subscript i denotes a repo transaction, the coefficient of interest measuring the spread between cleared and bilateral transactions repo rates.14
![]()
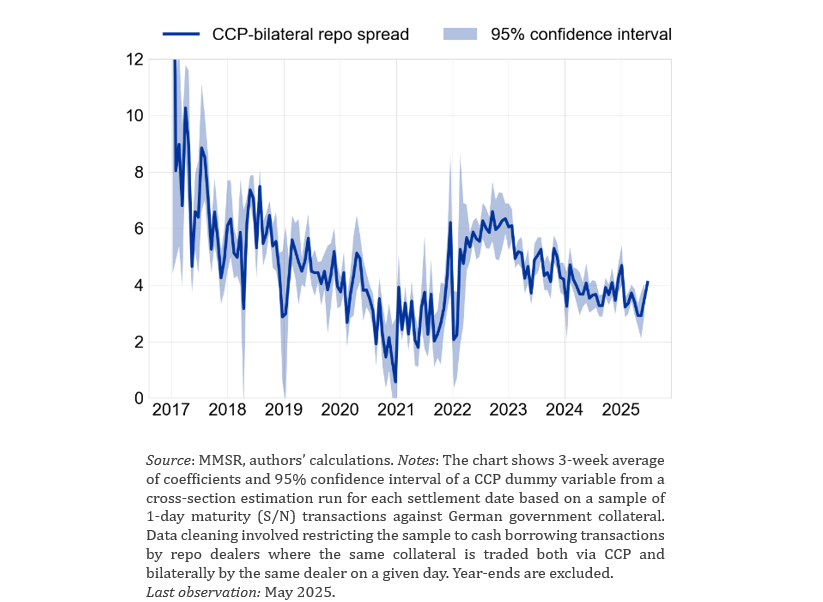
Figure 2 shows the evolution of this coefficient, reflecting the magnitude of the cleared-bilateral repo spread.15 An increase signals that banks are increasingly reluctant to expand their balance sheet: they are willing to borrow cash in bilateral repo only at a lower rate, and are ready to offer a higher rate to borrow the same amount in cleared repo. Conversely, this spread has reached a minimum from September 2020 to March 2022, coinciding with the period of temporary leverage ratio relief which exempted central bank exposures from the leverage ratio in the Euro area. The cleared-bilateral repo spread then increased markedly in 2022 after the end of the exemption, in the context of the monetary policy normalisation. Since then, it has remained at levels close to its historical average (around 4 basis points) not suggesting any further overall deterioration of dealers’ intermediation capacity for their repo activity.
We find that during the 2020-2022 period, GSIBs are indeed driving down the cleared-bilateral repo spread in Europe, suggesting that they react to a general US/EA loosening of regulation to restore intermediation capacity in repo.16
Figure 2. CCP-bilateral repo spread (basis points)
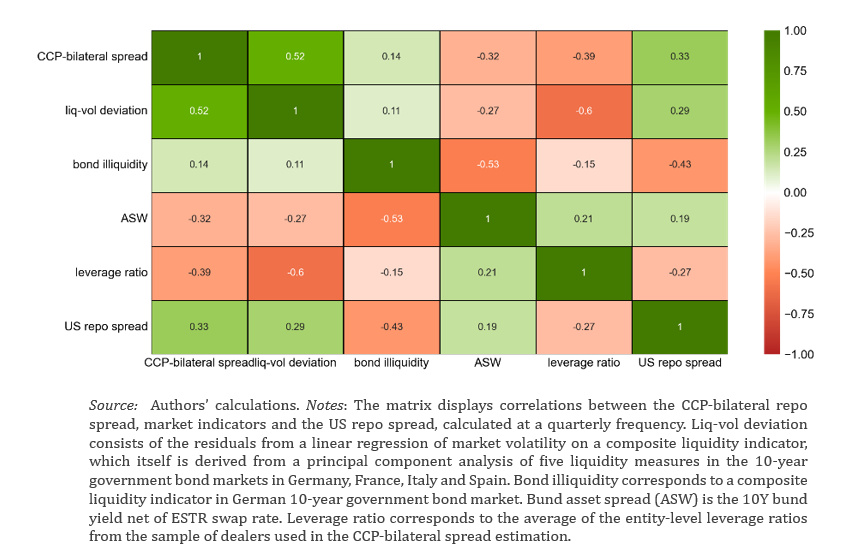
To provide further evidence about the information content of our repo spread for dealers’ fixed income intermediation capacity, we examine the co-movement of our spread with other proxies for intermediation constraints and bond market trading conditions. For this purpose, Figure 3 shows bivariate unconditional correlations with a number of variables used in the literature on US bond markets.
Figure 3. Correlation between CCP-bilateral repo spread and market indicators
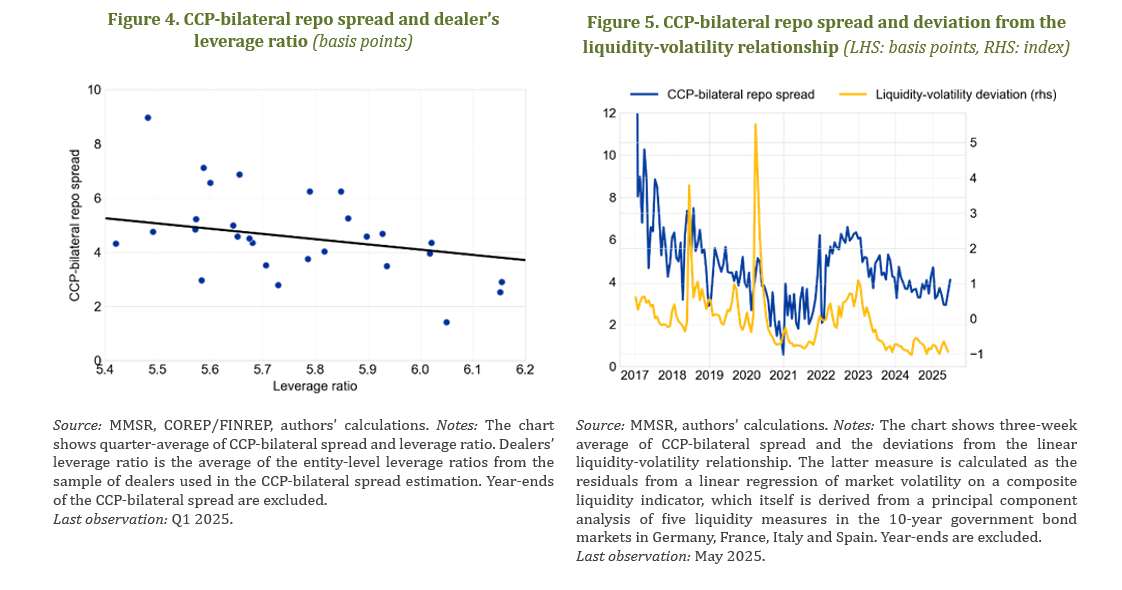
First, we illustrate in Figure 4 that in periods where dealers’ leverage ratios are high, i.e. indicative of a greater availability of capital relative to total balance sheet exposure, our spread tends to be low, consistent with dealers’ facing lower balance sheet constraints, and being less reluctant to expand their balance sheet.
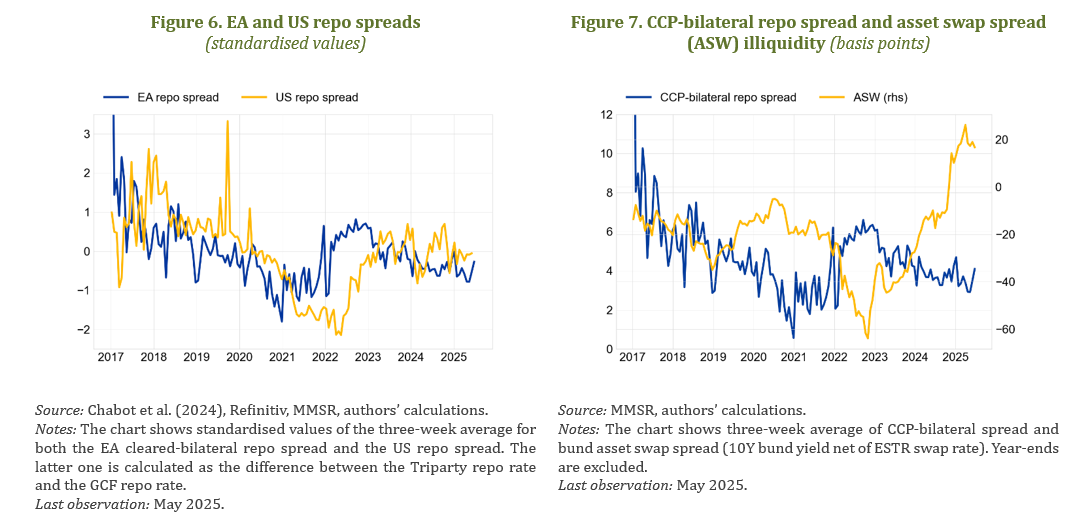
Second, in Figure 5, using again the bond liquidity-volatility relationship described before, we find a strong correlation between our spread and the deviation of this relationship, indicative of dealers’ intermediation constraints on the cash bond market in periods of high volatility (see Duffie et al., 2023). This sensitivity to volatility is partly explained by banks’ use of VaR models and their internal limit systems. Both mechanisms respond quickly to sharp price changes, constraining dealers’ ability to provide liquidity during periods of high volatility. This mechanism is further supported by the fact that the volatility-liquidity residual also produces the highest unconditional correlation.17
Third, our measure closely aligns in magnitude and dynamics with a comparable measure in the US government bond market (Figure 6), where a minimum is also reached during the same 2020-2022 period, also dropping in 2020 following the exemption of US Treasuries and reserves from the SLR. Furthermore, correlation with a simpler US measure based on aggregate data is also significant. The co-movement with US measures also indicates that there may have been some positive spillovers from the easing of the SLR in the first half of 2020. As the same group of Dealers is active in US and EU markets, any additional capacity generated by US policy also affected trading conditions in EU markets.
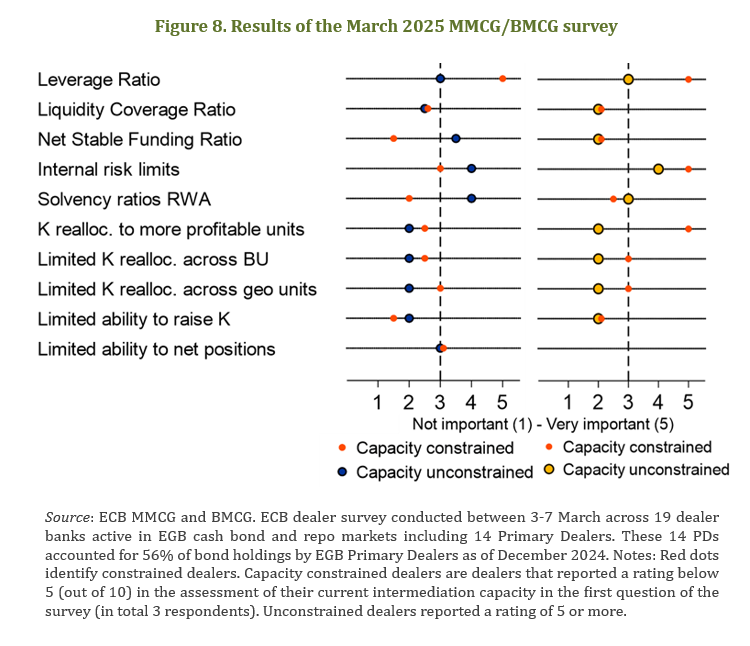
Finally, market intelligence broadly confirms the findings of this note. A recent survey conducted with dealers in the Money Market Contact Group (MMCG) and the Bond Market Contact Group (BMCG) confirms that overall intermediation capacity is still satisfactory in the EA fixed income market (Figure 8). Among the constraints that would be first binding, leverage ratio is considered as the principal one for the most constrained dealers, followed by internal risk limits and profitability considerations.
Baldo, L., F. Pasqualone and A. Scalia (2020) “Repo Market and Leverage Ratio in the Euro Area”, Bank of Italy Occasional Paper No. 551.
Bassi, C., M. Behn, M. Grill and M. Waibel “Window dressing of regulatory metrics: Evidence from repo markets”, Journal of Financial Intermediation, Volume 58, 2024.
Brauning, F., and H. Stein (2024) “The Effect of Primary Dealer Constraints on Intermediation in the Treasury Market.” Federal Reserve Bank of Boston Research Department Working Papers, 24-7.
Chabot et al. (2024) “Dealer Balance Sheet Constraints Evidence from Dealer-Level Data across Repo Market Segments”. Federal Reserve Notes.
Duffie, D. (2018) “Financial Regulatory Reform After the Crisis: An Assessment.” Management Science 64(10): 4835–4857.
Duffie, D, M Fleming, F Keane, C Nelson, O Shachar and P Van Tassel (2023). “Dealer Capacity and U.S. Treasury Market Functionality”, BIS Working paper 1138
Ferrara, FM, T Hudepohl, P Karl, T Linzert, B Nguyen, L Vaz Cruz (2024). “Who buys bonds now? How markets deal with a smaller Eurosystem balance sheet” ECB Blog.
Group of Thirty (2021) U.S. Treasury Markets: Steps Toward Increased Resilience. G30 Working Group on Treasury Market Liquidity.
He, Zhiguo, Stefan Nagel, and Zhaogang Song (2022) “Treasury Inconvenience Yields During theCOVID-19 Crisis.” Journal of Financial Economics , 143:57-79, 2022.
Kashyap, A.J., Stein, J. L. Wallen and J. Younger (2025) “Treasury Market Dysfunction and the Role of the Central Bank.” Brookings Papers on Economic Activity.
OECD (2024) “Global Debt Report 2024: Bond Markets in a High-Debt Environment”
Pinter, G. (2023) “An Anatomy of the 2022 Gilt Market Crisis.” Mimeo.
Scheicher, M. (2023) “Intermediation in US and EU bond and swap markets: stylised facts, trends and impact of the COVID-19 crisis in March 2020.” ESRB Occasional papers, Number 24.
Schrimpf, A, HS Shin and V Sushko (2020) Leverage and margin spirals in fixed income markets during the Covid-19 crisis. BIS Bulletin No 2
Duffie et al (2023) provide detailed evidence for the role of dealer capacity in the liquidity of the US Treasury market.
Significant instances include the US Treasury repo rates surge in September 2019, the ‘dash for cash’ triggered by the onset of the Covid-19 pandemic in March 2020, the mini-budget crisis in the UK in September 2022 and high volatility in April 2025 after US tariff announcements.
See also ECB Blog ‘’Hedge Funds: good or bad for market functioning” (Sept 2024).
In the US, fiscal deficits of around 6.5% need to be funded, which implies very sizable Treasury issuance.
See https://www.federalreserve.gov/aboutthefed/boardmeetings/files/powell-statement-20250625.pdf
He et al (2022) develop a theoretical framework for Dealer balance sheet costs, which illustrates the stark differences in Treasury trading between the GFC and Covid dislocation.
According to empirical analysis on US Treasury trading, both SLR and Dealer desk limits affect dealers’ provision of liquidity. Dealers’ internal Value-at-Risk constraints affect the Treasury market as dealers reduce their net position by about 2.1 percent in response to a one-standard-deviation tightening limit shock. Periods when trading desks’ limits are heavily utilized are also periods when the SLR compresses.
With rising selling pressure in the Treasury market, dealers reportedly reached their intermediation limits and market liquidity deteriorated, thereby exerting further upward pressure on yields (cf IMF 2025). In particular, Dealer holdings of ultralong US Treasury bonds had increased to record highs before an auction, indicating that dealers lack balance sheet in absorbing selling flow.
https://www.ecb.europa.eu/press/euromoneymarket/html/ecb.euromoneymarket202504.en.html
Contrary to reverse repo which is neutral for the balance sheet size, consistently with IFRS accounting system. As a robustness test, we derive the spread between netted and non-netted weighted average rates. The result is fairly consistent with the cleared-bilateral spread.
A similar approach is exploited in the US by Chabot et al. (2024) using the DVP-Triparty repo rate differential, and Baldo et al (2020) and Bassi et al. (2024) in the context of window dressing behaviours at quarter and year ends.
The sample covers 23 reporting agents, which is a representative sample of the largest actors in the repo market.
In 2024, trades against German government collateral accounted for 21% of the total volume of spot-next transactions against euro area government collateral, the second largest by collateral country.
Alternatively, we run a version of this specification in panel with daily interactions and the time fixed effects, yielding a very similar result. We also confirm our result is robust to an alternative specification of the spread, netted vs non-netted repo rates, which similar results. Finally, a robustness extension confirms the spread is similar using SFTDS instead of MMSR.
We omit the spikes at year-ends, which indicate sharp temporary spread increases around key bank reporting dates.
We estimate a specification with the cleared and bilateral rate spread as dependent variable and an interaction term between GSIB dummy (assigned a value of 1 when the dealer is GSIB) and a dummy for the leverage ratio exemption period (assigned a value of 1 for the period between September 2020 and March 2022).
Swap spreads also provide information about the size of potential frictions in bond markets, typically because bond holding is more costly in terms of balance sheet than swaps. Empirically, our repo spread is also correlated with the swap spread.